Races in Dayton, Virginia (VA) Detailed Stats
Latest news about races in Dayton, VA collected exclusively by city-data.com from local newspapers, TV, and radio stations
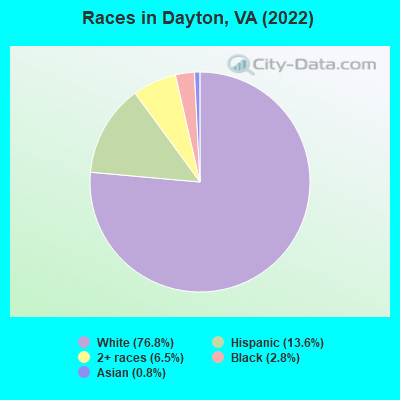
According to 2022 data, the most numerous races in Dayton, VA are White alone (1,497 residents), Black alone (55 residents), and Hispanic (265 residents). 86.4% of Dayton residents speak English at home. 8.2% of Dayton, VA residents are foreign-born (3.8% born in Latin America, 3.0% born in Africa, 1.1% born in Europe), which is 46.2% less than the foreign-born rate of 12.0% across the entire state of Virginia.
Race distribution in Dayton
2000 2022
4,965,637 70.2% White alone 1,376,378 19.4% Black alone 329,540 4.7% Hispanic 259,277 3.7% Asian alone 114,022 1.6% Two or more races 18,596 0.3% American Indian alone 11,685 0.2% Other race alone 3,380 0.05% Native Hawaiian and Other
5,095,130 58.7% White alone 1,594,785 18.4% Black alone 905,750 10.4% Hispanic 602,881 6.9% Asian alone 406,047 4.7% Two or more races 60,419 0.7% Other race alone 11,738 0.1% American Indian alone 6,869 0.08% Native Hawaiian and Other
Income and house value in Dayton Median household income in 2022 $80,336 White non-Hispanic householders$78,665 Black householdersMedian 2022 house value $350,458 White Non-Hispanic householders $402,237 Asian householders$248,656 Some other race householders$975,024 Two or more races householders$248,656 Hispanic or Latino householders
Median age by race in Dayton
36.7 Median age for White residents33.1 39.6 27.8 Median age for Black or African American residents27.0 56.1 -637,610,976.0 Median age for American Indian / Alaska Native residents-682,352,940.5 -665,056,360.0 -848,837,208.5 Median age for Asian residents-672,839,505.5 -721,763,084.7 -611,955,419.9 Median age for Native Hawaiian / Pacific Islander residents-666,666,666.0 -666,666,666.0 23.4 Median age for Other race residents23.0 -687,285,222.7 9.8 Median age for Two or more races residents5.0 27.4 36.9 Median age for White alone residents33.0 38.9 24.5 Median age for Hispanic or Latino residents10.2 33.4
Owner/renter occupied households by race in Dayton
House owners and renters - White residents 486 71.0% Owner occupied199 29.0% Renter occupiedHouse owners and renters - Black or African American residents 20 67.3% Owner occupied10 32.7% Renter occupiedHouse owners and renters - Other race residents 7 100.0% Owner occupiedHouse owners and renters - Two or more races residents 21 21.8% Owner occupied74 78.2% Renter occupiedHouse owners and renters - White alone residents 479 72.2% Owner occupied184 27.8% Renter occupiedHouse owners and renters - Hispanic or Latino residents 22 21.9% Owner occupied78 78.1% Renter occupied
Language usage in Dayton
English speakers - Total 86.4% of residents of Dayton speak English at home.
8.4% of residents speak Spanish at home 89 59.3% Speak English very well61 40.7% Speak English less than very well6.3% of residents speak other language at home 24 21.2% Speak English very well89 78.8% Speak English less than very well
English speakers - Born in the United States 92.0% of residents of Dayton speak English at home.
9.2% of residents speak Spanish at home 56 100.0% Speak English very well
English speakers - Native, born elsewhere 10.4% of residents of Dayton speak English at home.
81.2% of residents speak Spanish at home 39 100.0% Speak English less than very well
English speakers - Foreign-born 22.8% of residents of Dayton speak English at home.
26.8% of residents speak Spanish at home 17 42.5% Speak English very well23 57.5% Speak English less than very well45.0% of residents speak other language at home 3 4.5% Speak English very well64 95.5% Speak English less than very well
White (Caucasian) - Speak only English Native:
96.1% (1,365)Foreign-born:
38.5% (10)
White (Caucasian) - Speak another language Native:
3.7% (53)Foreign-born:
46.3% (12)
Black or African American - Speak only English Native:
99.8% (19)Foreign-born:
24.7% (19)
Asian - Speak only English Native:
92.4% (7)Foreign-born:
100.0% (6)
Other race - Speak only English Native:
100.0% (18)Foreign-born:
19.5% (9)
Two or more races - Speak another language Native:
41.3% (57)Foreign-born:
100.0% (9)
White alone - Speak only English Native:
96.4% (1,338)Foreign-born:
56.4% (19)
White alone - Speak another language Native:
4.2% (58)Foreign-born:
44.3% (15)
Hispanic or Latino - Speak only English Native:
44.3% (69)Foreign-born:
16.1% (8)
Hispanic or Latino - Speak another language Native:
52.3% (81)Foreign-born:
86.6% (43)
Foreign-born residents in Dayton 160 residents are foreign born (3.8% Latin America , 3.0% Africa , 1.1% Europe ).
This city:
8.2%Virginia:
12.6%
Marital status for residents in Dayton Marital status - White (Caucasian) population 15 years and over
Males 23.0% Never married64.5% Now married0.5% Separated1.4% Widowed10.6% DivorcedFemales 23.0% Never married52.4% Now married0.0% Separated6.9% Widowed17.7% DivorcedWomen who gave birth in the past 12 months Now married:
15.0% (3)Unmarried:
85.0% (16)
Women who did not give birth in the past 12 months Now married:
59.3% (223)Unmarried:
40.7% (153)
Marital status - Black or African American population 15 years and over
Males 61.5% Never married38.5% Now married0.0% Separated0.0% Widowed0.0% DivorcedFemales 26.9% Never married73.1% Now married0.0% Separated0.0% Widowed0.0% DivorcedWomen who did not give birth in the past 12 months Now married:
0.0% (0)Unmarried:
100.0% (7)
Marital status - Asian population 15 years and over
Males 100.0% Never married0.0% Now married0.0% Separated0.0% Widowed0.0% DivorcedFemales 100.0% Never married0.0% Now married0.0% Separated0.0% Widowed0.0% DivorcedWomen who did not give birth in the past 12 months Now married:
0.0% (0)Unmarried:
100.0% (6)
Marital status - Other race population 15 years and over
Males 68.2% Never married31.8% Now married0.0% Separated0.0% Widowed0.0% DivorcedFemales 0.0% Never married100.0% Now married0.0% Separated0.0% Widowed0.0% DivorcedWomen who did not give birth in the past 12 months Now married:
100.0% (5)Unmarried:
0.0% (0)
Marital status - Two or more races population 15 years and over
Males 15.0% Never married55.0% Now married0.0% Separated0.0% Widowed30.0% DivorcedFemales 91.1% Never married8.9% Now married0.0% Separated0.0% Widowed0.0% DivorcedWomen who did not give birth in the past 12 months Now married:
7.3% (5)Unmarried:
92.7% (70)
Marital status - White alone, not Hispanic / Latino population 15 years and over
Males 22.5% Never married64.6% Now married0.5% Separated1.4% Widowed10.9% DivorcedFemales 22.9% Never married51.4% Now married0.0% Separated7.3% Widowed18.5% DivorcedWomen who gave birth in the past 12 months Now married:
15.0% (3)Unmarried:
85.0% (17)
Women who did not give birth in the past 12 months Now married:
58.1% (211)Unmarried:
41.9% (152)
Marital status - Hispanic or Latino population 15 years and over
Males 55.6% Never married36.1% Now married0.0% Separated0.0% Widowed8.3% DivorcedFemales 61.3% Never married38.7% Now married0.0% Separated0.0% Widowed0.0% DivorcedWomen who did not give birth in the past 12 months Now married:
37.0% (29)Unmarried:
63.0% (49)
Ancestries in Dayton
199 20.7% German122 12.7% American117 12.1% English96 10.0% Irish63 6.5% African30 3.1% European20 2.1% Ukrainian19 2.0% Jamaican13 1.3% Scotch-Irish12 1.2% British12 1.2% Italian8 0.8% Scandinavian8 0.8% South African7 0.7% Russian6 0.6% French4 0.4% Dutch3 0.3% Northern European3 0.3% Polish3 0.3% Swedish2 0.2% Austrian2 0.2% Scottish2 0.2% Swiss1 0.1% Welsh
Children Nativity (place of birth) in Dayton
Children under 6 years - Living with two parents Both parents native 90 100.0% NativeBoth parents foreign-born 3 100.0% NativeChildren under 6 years - Living with one parent Native parent 86 100.0% NativeChildren 6 to 17 years - Living with two parents Both parents native 138 95.6% Native6 4.4% Foreign-bornOne native, one foreign-born parent 10 75.5% Native3 24.5% Foreign-bornChildren 6 to 17 years - Living with one parent Native parent 32 63.8% Native18 36.2% Foreign-bornForeign-born parent 19 100.0% Native
Grandparents responsible for own grandchildren in Dayton
Grandparents (30 to 59 years) White / Caucasian 1 100.0% Responsible for grandchildrenWhite alone, not Hispanic / Latino 1 100.0% Responsible for grandchildren
Grandparents (60 years and over) White / Caucasian 3 100.0% Not responsible for grandchildrenWhite alone, not Hispanic / Latino 3 100.0% Not responsible for grandchildren