Races in De Lake, Oregon (OR) Detailed Stats
Ancestries, Foreign-born residents, place of birth
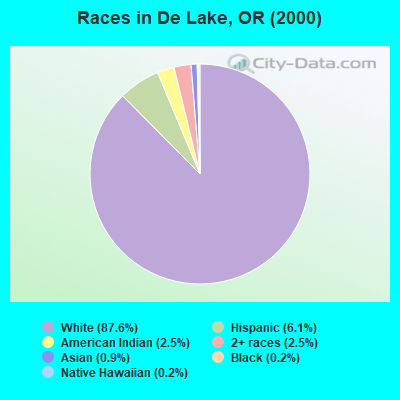
Race distribution in De Lake

- 10,45287.6%White alone
- 7286.1%Hispanic
- 2962.5%Two or more races
- 2982.5%American Indian alone
- 1040.9%Asian alone
- 270.2%Black alone
- 250.2%Native Hawaiian and Other
Pacific Islander alone - 50.04%Other race alone
2000
2022
-
- 2,857,61683.5%White alone
- 275,3148.0%Hispanic
- 100,3332.9%Asian alone
- 82,7332.4%Two or more races
- 53,3251.6%Black alone
- 40,1301.2%American Indian alone
- 7,3980.2%Native Hawaiian and Other
Pacific Islander alone - 4,5500.1%Other race alone

-
- 3,037,57171.6%White alone
- 609,53814.4%Hispanic
- 252,7446.0%Two or more races
- 191,2834.5%Asian alone
- 78,2281.8%Black alone
- 29,3990.7%American Indian alone
- 25,7310.6%Other race alone
- 15,6430.4%Native Hawaiian and Other
Pacific Islander alone

Income and house value in De Lake
- Median household income in 2022
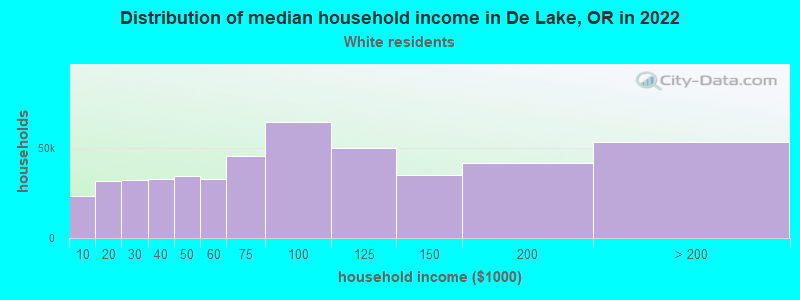
- $53,117White non-Hispanic householders
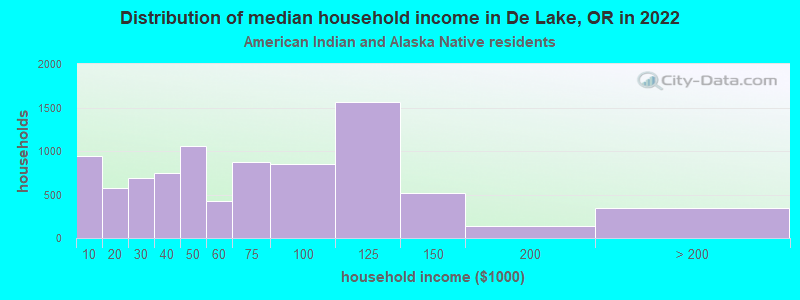
- $62,329American Indian and Alaska Native householders
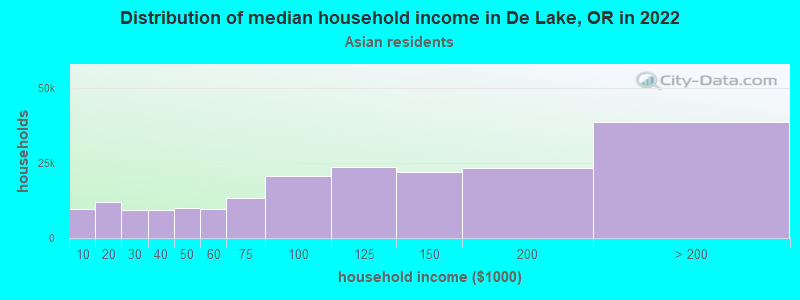
- over $200,000Asian householders
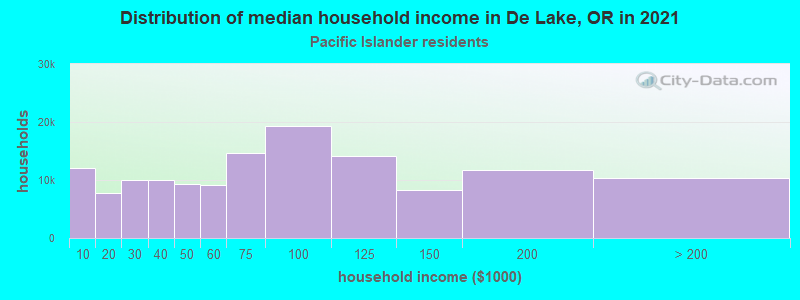
- $68,234Native Hawaiian and other Pacific Islander householders
- $89,800Some other race householders
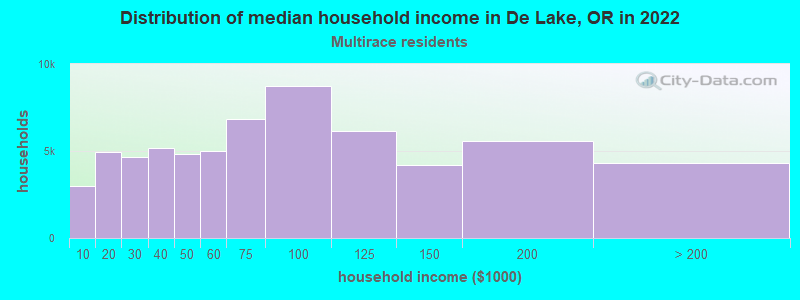
- $58,069Two or more races householders
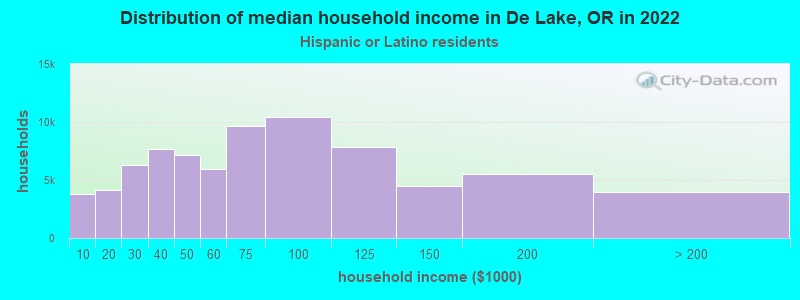
- $57,193Hispanic or Latino race householders
- Median 2022 house value
- $414,230White Non-Hispanic householders
- $637,932American Indian or Alaska Native householders
- $602,491Asian householders
- $374,537Two or more races householders
- $389,847Hispanic or Latino householders
Household income for White non-Hispanic householders
Household income for American Indian and Alaska Native householders
Household income for Asian householders
Household income for Native Hawaiian and other Pacific Islander householders
Household income for Two or more races householders
Household income for Hispanic or Latino race householders
Zip code: 97367