Races in De Ridder, Louisiana (LA) Detailed Stats
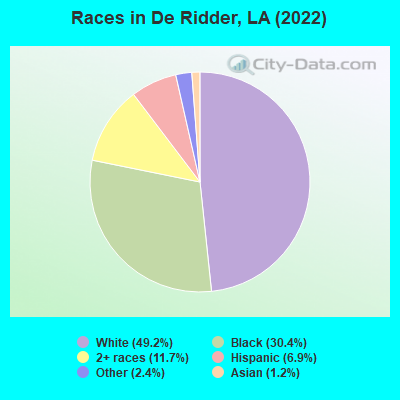
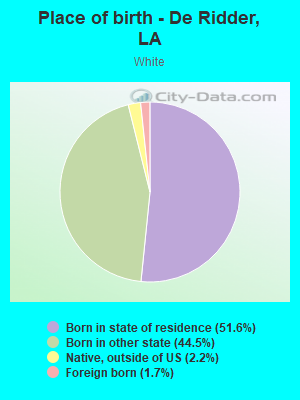
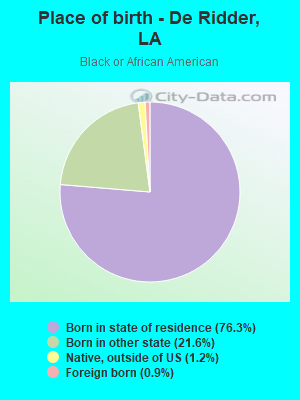
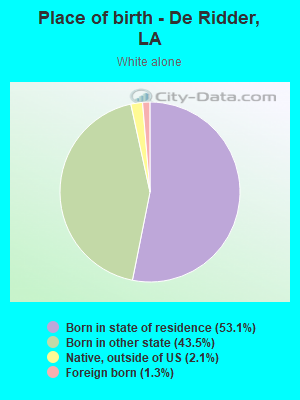
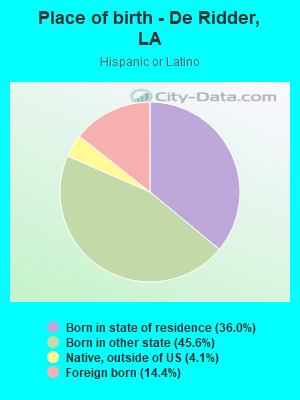
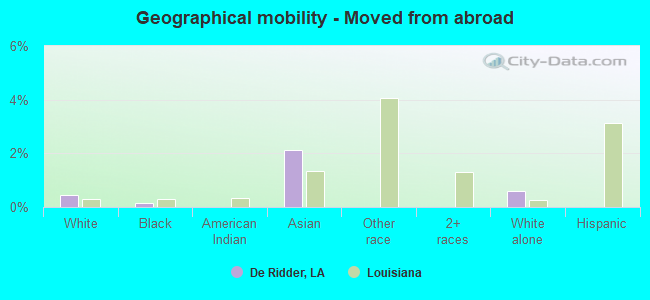
According to 2022 data, the most numerous races in De Ridder, LA are White alone (4,792 residents), Black alone (2,966 residents), and Hispanic (675 residents). 94.6% of De Ridder residents speak English at home. 2.7% of De Ridder, LA residents are foreign-born (1.2% born in Latin America, 0.6% born in Europe, 0.6% born in Asia), which is 49.9% less than the foreign-born rate of 4.0% across the entire state of Louisiana.
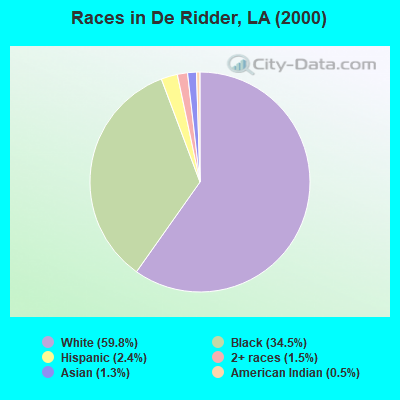
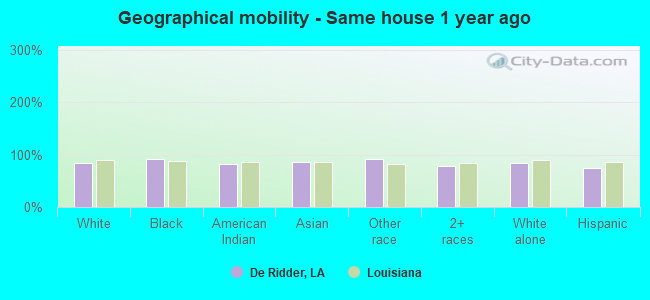
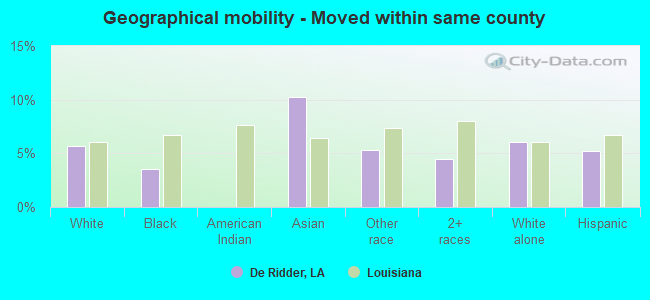
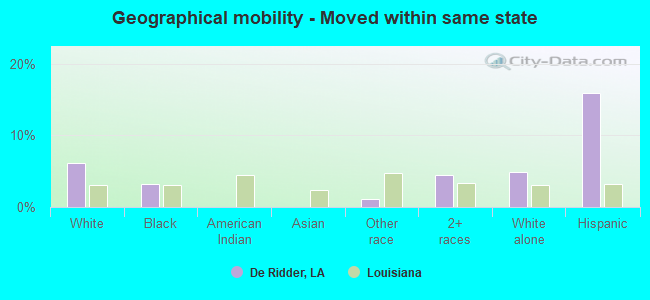
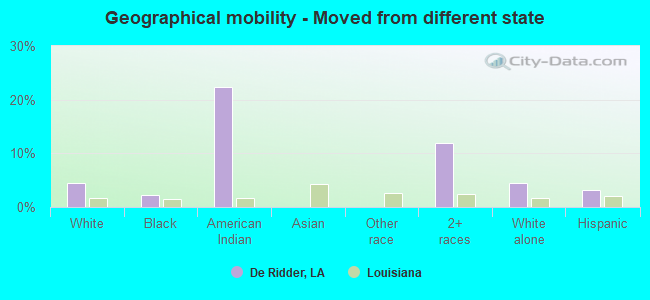
Race distribution in De Ridder
2000 2022
2,794,391 62.5% White alone 1,443,390 32.3% Black alone 107,738 2.4% Hispanic 54,256 1.2% Asian alone 39,260 0.9% Two or more races 24,129 0.5% American Indian alone 4,736 0.1% Other race alone 1,076 0.02% Native Hawaiian and Other
2,603,221 56.7% White alone 1,420,055 30.9% Black alone 262,213 5.7% Hispanic 183,270 4.0% Two or more races 81,169 1.8% Asian alone 19,991 0.4% American Indian alone 18,043 0.4% Other race alone 2,279 0.05% Native Hawaiian and Other
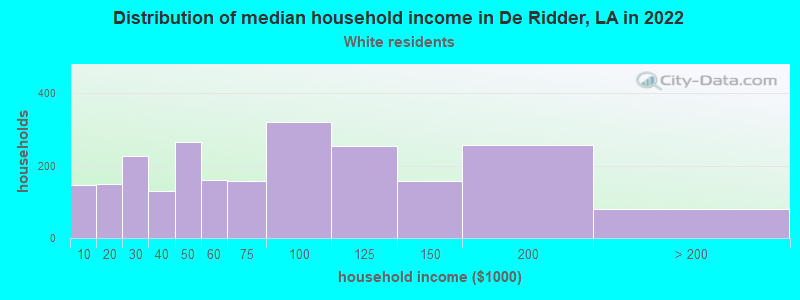
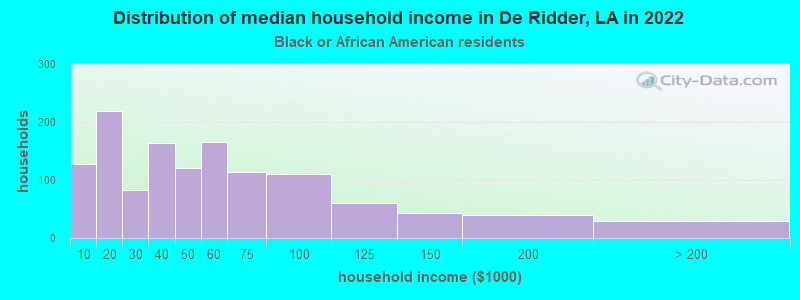
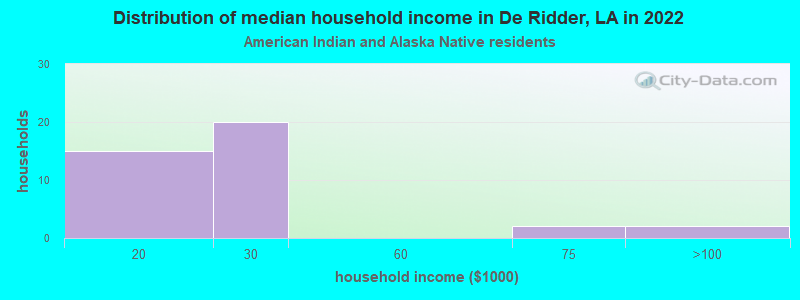
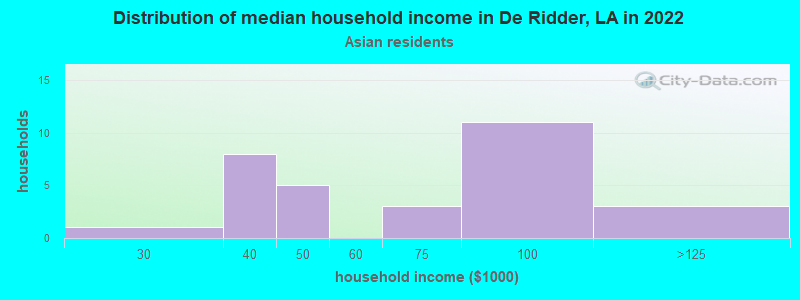
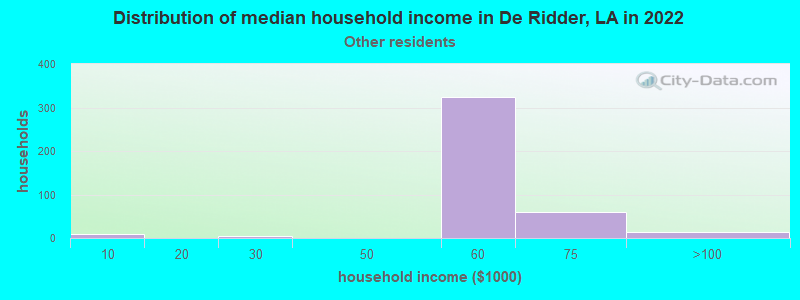
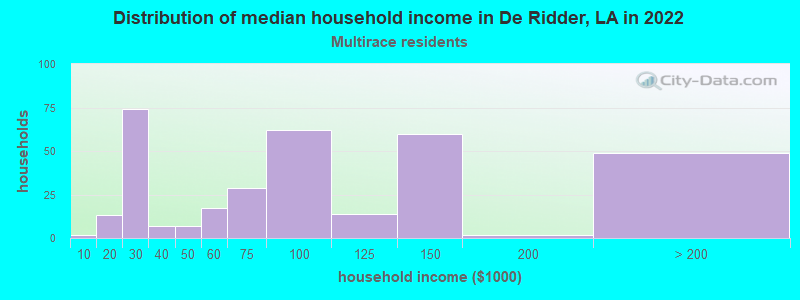
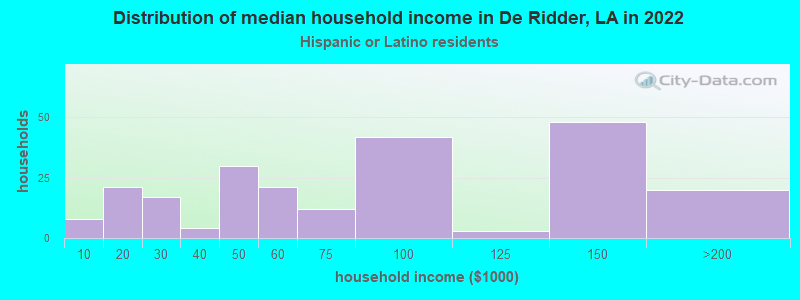
Income and house value in De Ridder Median household income in 2022 $65,189 White non-Hispanic householders$40,934 Black householders$57,876 Asian householders$56,414 Some other race householders$80,240 Two or more races householders$74,163 Hispanic or Latino race householdersMedian 2022 house value $175,726 White Non-Hispanic householders$118,644 Black or African American householders $176,906 Asian householders$129,731 Two or more races householders$155,677 Hispanic or Latino householders
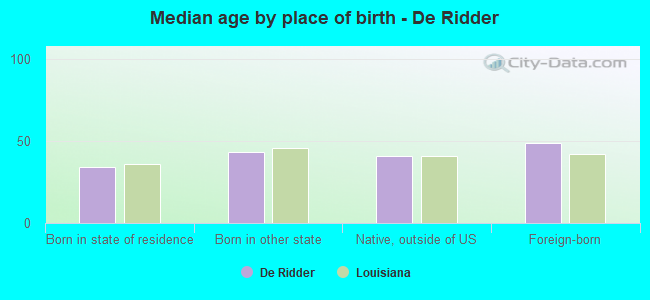
Median age by race in De Ridder
41.1 Median age for White residents38.1 42.3 37.7 Median age for Black or African American residents33.5 47.8 51.5 Median age for American Indian / Alaska Native residents66.0 -781,341,107.1 36.6 Median age for Asian residents32.9 36.9 -821,138,210.6 Median age for Native Hawaiian / Pacific Islander residents-868,167,201.7 -599,999,999.4 74.7 Median age for Other race residents69.7 41.1 29.1 Median age for Two or more races residents28.3 29.4 41.9 Median age for White alone residents39.1 44.5 30.9 Median age for Hispanic or Latino residents32.7 27.7
Owner/renter occupied households by race in De Ridder
House owners and renters - White residents 1,474 64.8% Owner occupied802 35.2% Renter occupiedHouse owners and renters - Black or African American residents 700 55.5% Owner occupied561 44.5% Renter occupiedHouse owners and renters - American Indian / Alaska Native residents 1 50.7% Owner occupied1 49.3% Renter occupiedHouse owners and renters - Asian residents 18 69.7% Owner occupied8 30.3% Renter occupiedHouse owners and renters - Other race residents 312 96.4% Owner occupied12 3.6% Renter occupiedHouse owners and renters - Two or more races residents 231 68.1% Owner occupied108 31.9% Renter occupiedHouse owners and renters - White alone residents 1,442 66.1% Owner occupied740 33.9% Renter occupiedHouse owners and renters - Hispanic or Latino residents 105 46.6% Owner occupied120 53.4% Renter occupied
Language usage in De Ridder
English speakers - Total 94.6% of residents of De Ridder speak English at home.
3.4% of residents speak Spanish at home 236 75.9% Speak English very well75 24.1% Speak English less than very well1.9% of residents speak other language at home 151 84.4% Speak English very well28 15.6% Speak English less than very well
English speakers - Born in the United States 94.6% of residents of De Ridder speak English at home.
4.5% of residents speak Spanish at home 151 94.4% Speak English very well9 5.6% Speak English less than very well1.0% of residents speak other language at home 31 88.6% Speak English very well4 11.4% Speak English less than very well
English speakers - Native, born elsewhere 81.1% of residents of De Ridder speak English at home.
12.1% of residents speak Spanish at home 17 73.9% Speak English very well6 26.1% Speak English less than very well3.7% of residents speak other language at home 7 100.0% Speak English very well
English speakers - Foreign-born 22.8% of residents of De Ridder speak English at home.
36.4% of residents speak Spanish at home 39 42.9% Speak English very well52 57.1% Speak English less than very well38.8% of residents speak other language at home 73 75.3% Speak English very well24 24.7% Speak English less than very well
White (Caucasian) - Speak only English Native:
97.1% (4,558)Foreign-born:
35.1% (29)
White (Caucasian) - Speak another language Native:
3.0% (139)Foreign-born:
65.6% (55)
Black or African American - Speak only English Native:
97.7% (2,798)Foreign-born:
66.3% (17)
Black or African American - Speak another language Native:
2.4% (68)Foreign-born:
32.6% (8)
Asian - Speak only English Native:
61.8% (40)Foreign-born:
15.3% (10)
Asian - Speak another language Native:
32.9% (21)Foreign-born:
84.1% (52)
Other race - Speak another language Native:
11.7% (34)Foreign-born:
100.0% (36)
Two or more races - Speak only English Native:
96.8% (1,240)Foreign-born:
75.4% (1)
White alone - Speak only English Native:
98.7% (4,442)Foreign-born:
47.3% (30)
White alone - Speak another language Native:
1.4% (64)Foreign-born:
52.7% (34)
Hispanic or Latino - Speak only English Native:
69.0% (349)Foreign-born:
4.1% (4)
Hispanic or Latino - Speak another language Native:
31.2% (158)Foreign-born:
95.8% (91)
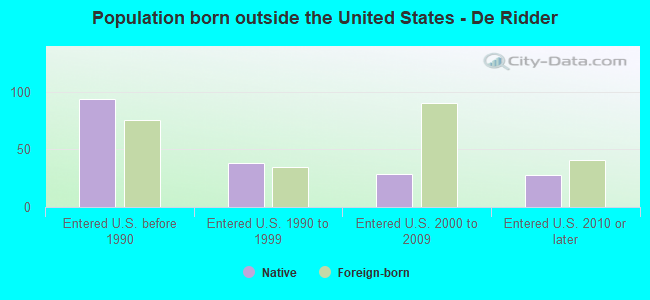
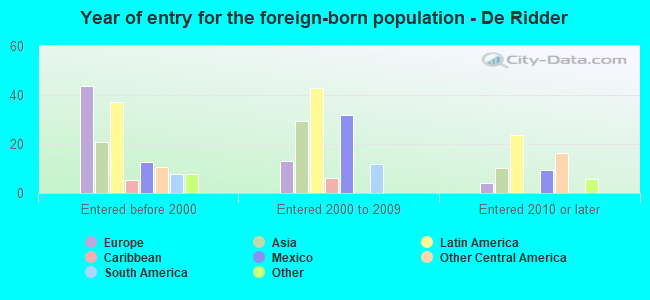
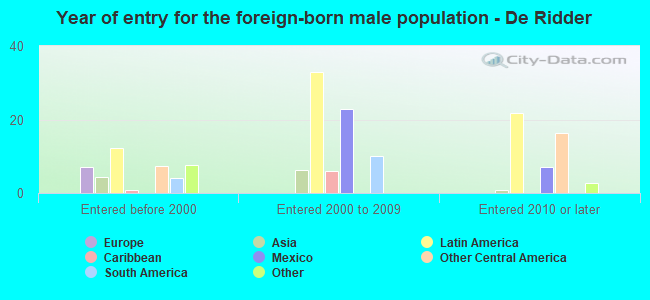
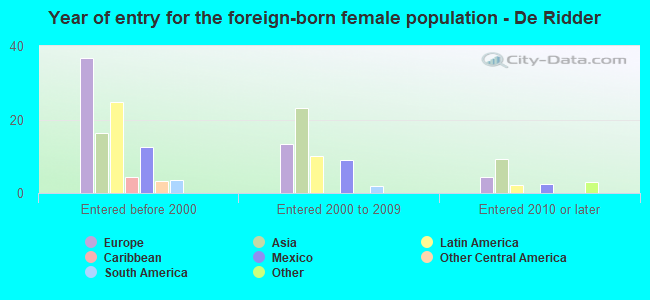
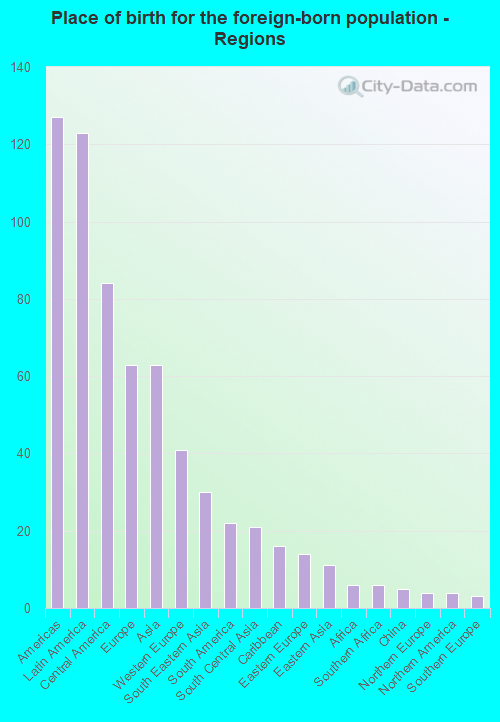
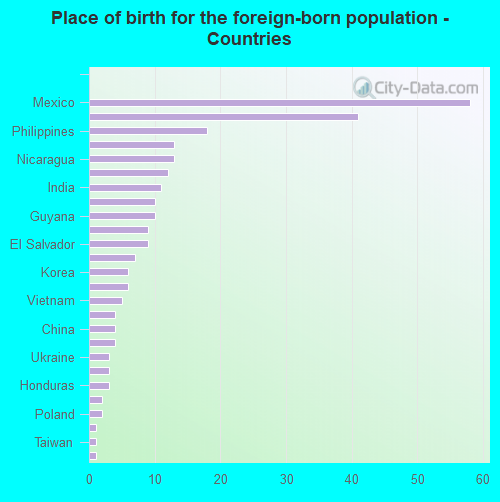
Foreign-born residents in De Ridder 260 residents are foreign born (1.2% Latin America , 0.6% Europe , 0.6% Asia ).
This city:
2.7%Louisiana:
4.2%
Marital status for residents in De Ridder Marital status - White (Caucasian) population 15 years and over
Males 27.1% Never married55.5% Now married1.0% Separated2.8% Widowed13.6% DivorcedFemales 18.9% Never married48.2% Now married2.2% Separated13.1% Widowed17.7% DivorcedWomen who gave birth in the past 12 months Now married:
92.2% (45)Unmarried:
7.8% (4)
Women who did not give birth in the past 12 months Now married:
52.1% (546)Unmarried:
47.9% (502)
Marital status - Black or African American population 15 years and over
Males 52.0% Never married28.9% Now married2.2% Separated1.7% Widowed15.2% DivorcedFemales 41.3% Never married29.2% Now married2.0% Separated11.1% Widowed16.4% DivorcedWomen who gave birth in the past 12 months Now married:
25.0% (5)Unmarried:
75.0% (15)
Women who did not give birth in the past 12 months Now married:
16.6% (100)Unmarried:
83.4% (499)
Marital status - American Indian / Alaska Native population 15 years and over
Males 0.0% Never married100.0% Now married0.0% Separated0.0% Widowed0.0% DivorcedFemales 0.0% Never married0.0% Now married0.0% Separated0.0% Widowed100.0% DivorcedWomen who did not give birth in the past 12 months Now married:
0.0% (0)Unmarried:
100.0% (2)
Marital status - Asian population 15 years and over
Males 28.1% Never married71.9% Now married0.0% Separated0.0% Widowed0.0% DivorcedFemales 12.9% Never married62.9% Now married0.0% Separated3.2% Widowed21.0% DivorcedWomen who did not give birth in the past 12 months Now married:
61.7% (30)Unmarried:
38.3% (19)
Marital status - Other race population 15 years and over
Males 27.2% Never married71.7% Now married0.0% Separated0.0% Widowed1.1% DivorcedFemales 15.0% Never married17.5% Now married52.5% Separated0.0% Widowed15.0% DivorcedWomen who did not give birth in the past 12 months Now married:
70.0% (30)Unmarried:
30.0% (13)
Marital status - Two or more races population 15 years and over
Males 55.4% Never married30.0% Now married2.5% Separated0.9% Widowed11.2% DivorcedFemales 29.2% Never married45.8% Now married3.3% Separated5.2% Widowed16.6% DivorcedWomen who gave birth in the past 12 months Now married:
78.3% (25)Unmarried:
21.7% (7)
Women who did not give birth in the past 12 months Now married:
25.3% (52)Unmarried:
74.7% (152)
Marital status - White alone, not Hispanic / Latino population 15 years and over
Males 27.8% Never married56.1% Now married1.1% Separated3.0% Widowed12.1% DivorcedFemales 18.0% Never married48.0% Now married2.3% Separated13.3% Widowed18.5% DivorcedWomen who gave birth in the past 12 months Now married:
90.2% (36)Unmarried:
9.8% (4)
Women who did not give birth in the past 12 months Now married:
52.6% (530)Unmarried:
47.4% (477)
Marital status - Hispanic or Latino population 15 years and over
Males 24.2% Never married46.0% Now married1.6% Separated1.6% Widowed26.6% DivorcedFemales 28.6% Never married39.4% Now married10.3% Separated4.9% Widowed16.7% DivorcedWomen who gave birth in the past 12 months Now married:
100.0% (10)Unmarried:
0.0% (0)
Women who did not give birth in the past 12 months Now married:
43.5% (68)Unmarried:
56.5% (88)
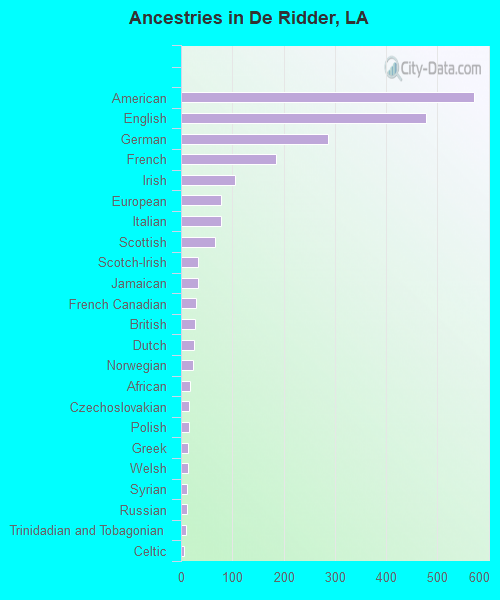
Ancestries in De Ridder
572 11.1% American477 9.3% English286 5.6% German186 3.6% French105 2.0% Irish78 1.5% European78 1.5% Italian66 1.3% Scottish34 0.7% Scotch-Irish33 0.6% Jamaican30 0.6% French Canadian28 0.5% British26 0.5% Dutch23 0.4% Norwegian17 0.3% African16 0.3% Czechoslovakian16 0.3% Polish14 0.3% Greek13 0.3% Welsh12 0.2% Syrian11 0.2% Russian9 0.2% Trinidadian and Tobagonian6 0.1% Celtic4 0.08% Guyanese4 0.08% Nigerian4 0.08% South African3 0.06% Cajun3 0.06% Ukrainian2 0.04% Danish2 0.04% Swedish2 0.04% Belizean1 0.02% Scandinavian
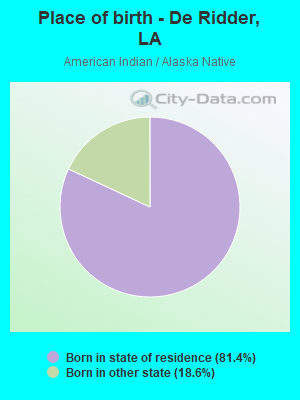
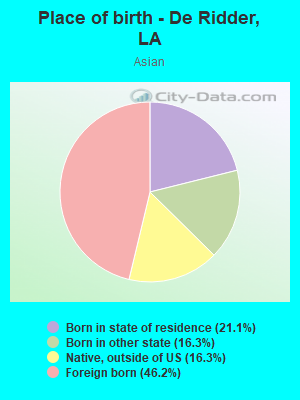
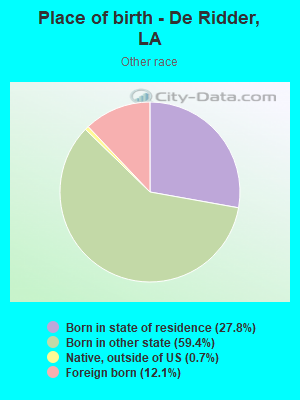
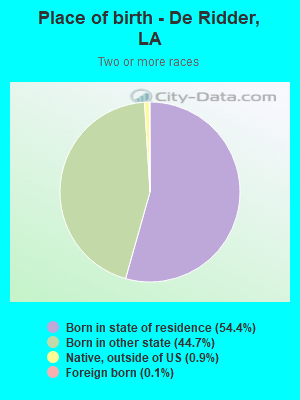
Children Nativity (place of birth) in De Ridder
Children under 6 years - Living with two parents Both parents native 266 100.0% NativeBoth parents foreign-born 6 100.0% NativeOne native, one foreign-born parent 9 100.0% NativeChildren under 6 years - Living with one parent Native parent 299 100.0% NativeChildren 6 to 17 years - Living with two parents Both parents native 522 100.0% NativeBoth parents foreign-born 21 78.3% Native6 21.7% Foreign-bornOne native, one foreign-born parent 24 100.0% NativeChildren 6 to 17 years - Living with one parent Native parent 926 100.0% NativeForeign-born parent 5 50.6% Native4 49.4% Foreign-born
Grandparents responsible for own grandchildren in De Ridder
Grandparents (30 to 59 years) White / Caucasian 15 66.0% Responsible for grandchildren8 34.0% Not responsible for grandchildrenBlack or African American 15 100.0% Responsible for grandchildrenOther race 3 100.0% Responsible for grandchildrenTwo or more races 53 100.0% Responsible for grandchildrenWhite alone, not Hispanic / Latino 16 65.4% Responsible for grandchildren8 34.6% Not responsible for grandchildrenHispanic or Latino 2 100.0% Responsible for grandchildrenGrandparents (60 years and over) White / Caucasian 17 17.5% Responsible for grandchildren81 82.5% Not responsible for grandchildrenBlack or African American 21 39.1% Responsible for grandchildren33 60.9% Not responsible for grandchildrenTwo or more races 60 100.0% Responsible for grandchildrenWhite alone, not Hispanic / Latino 17 17.4% Responsible for grandchildren83 82.6% Not responsible for grandchildren