Races in Dearborn, Michigan (MI) Detailed Stats
Data:
Races - White alone (%)
Races - White alone (% change since 2000)
Races - Black alone (%)
Races - Black alone (% change since 2000)
Races - American Indian alone (%)
Races - American Indian alone (% change since 2000)
Races - Asian alone (%)
Races - Asian alone (% change since 2000)
Races - Hispanic (%)
Races - Hispanic (% change since 2000)
Races - Native Hawaiian and Other Pacific Islander alone (%)
Races - Native Hawaiian and Other Pacific Islander alone (% change since 2000)
Races - Two or more races(%)
Races - Two or more races(% change since 2000)
Races - Other race alone (%)
Races - Other race alone (% change since 2000)
Racial diversity
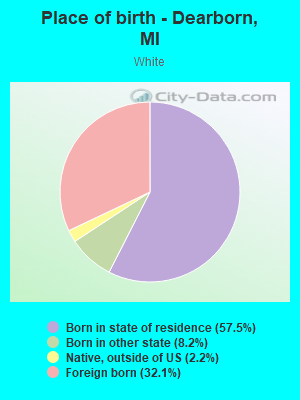
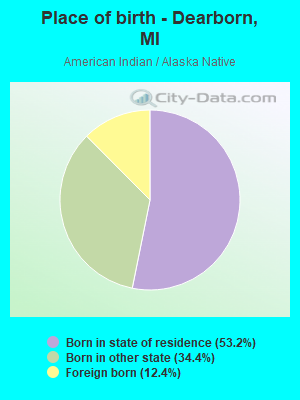
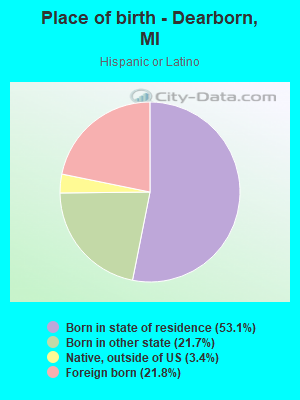
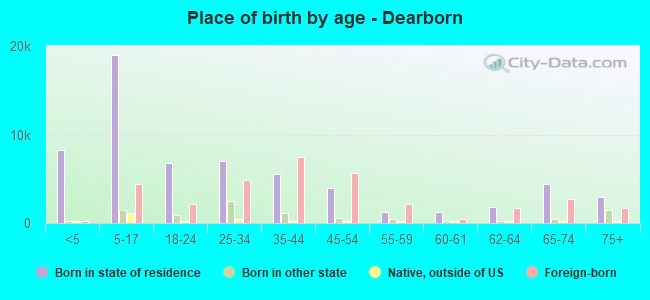
Place of birth - Born in state of residence (%)
Place of birth - Born in state of residence (%) - White
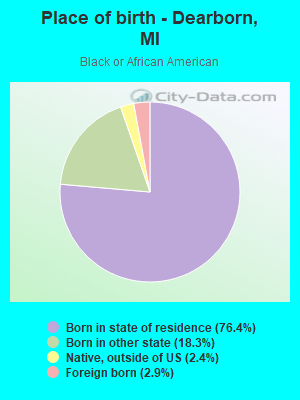
Place of birth - Born in state of residence (%) - Black or African American
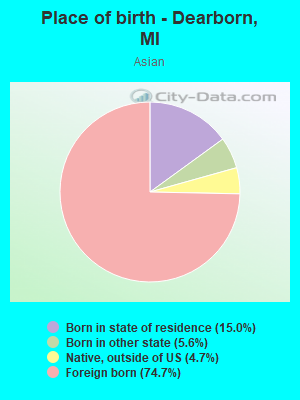
Place of birth - Born in state of residence (%) - Asian
Place of birth - Born in state of residence (%) - Hispanic or Latino
Place of birth - Born in state of residence (%) - American Indian and Alaska Native
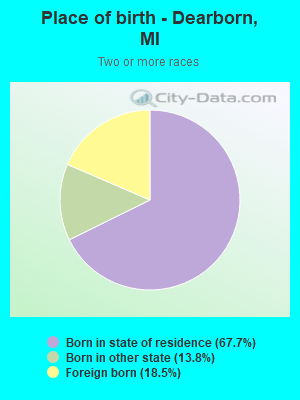
Place of birth - Born in state of residence (%) - Multirace
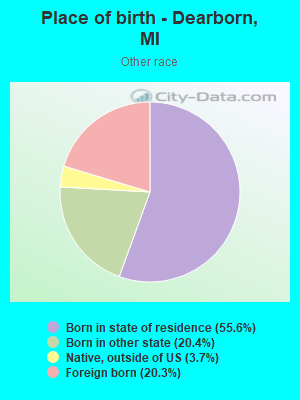
Place of birth - Born in state of residence (%) - Other Race
Place of birth - Born in other state (%)
Place of birth - Born in other state (%) - White
Place of birth - Born in other state (%) - Black or African American
Place of birth - Born in other state (%) - Asian
Place of birth - Born in other state (%) - Hispanic or Latino
Place of birth - Born in other state (%) - American Indian and Alaska Native
Place of birth - Born in other state (%) - Multirace
Place of birth - Born in other state (%) - Other Race
Place of birth - Native, outside of US (%)
Place of birth - Native, outside of US (%) - White
Place of birth - Native, outside of US (%) - Black or African American
Place of birth - Native, outside of US (%) - Asian
Place of birth - Native, outside of US (%) - Hispanic or Latino
Place of birth - Native, outside of US (%) - American Indian and Alaska Native
Place of birth - Native, outside of US (%) - Multirace
Place of birth - Native, outside of US (%) - Other Race
Place of birth - Foreign born (%)
Place of birth - Foreign born (%) - White
Place of birth - Foreign born (%) - Black or African American
Place of birth - Foreign born (%) - Asian
Place of birth - Foreign born (%) - Hispanic or Latino
Place of birth - Foreign born (%) - American Indian and Alaska Native
Place of birth - Foreign born (%) - Multirace
Place of birth - Foreign born (%) - Other Race
Residents speaking English at home (%)
Residents speaking English at home - Born in the United States (%)
Residents speaking English at home - Native, born elsewhere (%)
Residents speaking English at home - Foreign born (%)
Residents speaking Spanish at home (%)
Residents speaking Spanish at home - Born in the United States (%)
Residents speaking Spanish at home - Native, born elsewhere (%)
Residents speaking Spanish at home - Foreign born (%)
Residents speaking other language at home (%)
Residents speaking other language at home - Born in the United States (%)
Residents speaking other language at home - Native, born elsewhere (%)
Residents speaking other language at home - Foreign born (%)
Marital status - Never married (%)
Marital status - Now married (%)
Marital status - Separated (%)
Marital status - Widowed (%)
Marital status - Divorced (%)
Ancestries Reported - Arab (%)
Ancestries Reported - Czech (%)
Ancestries Reported - Danish (%)
Ancestries Reported - Dutch (%)
Ancestries Reported - English (%)
Ancestries Reported - French (%)
Ancestries Reported - French Canadian (%)
Ancestries Reported - German (%)
Ancestries Reported - Greek (%)
Ancestries Reported - Hungarian (%)
Ancestries Reported - Irish (%)
Ancestries Reported - Italian (%)
Ancestries Reported - Lithuanian (%)
Ancestries Reported - Norwegian (%)
Ancestries Reported - Polish (%)
Ancestries Reported - Portuguese (%)
Ancestries Reported - Russian (%)
Ancestries Reported - Scotch-Irish (%)
Ancestries Reported - Scottish (%)
Ancestries Reported - Slovak (%)
Ancestries Reported - Subsaharan African (%)
Ancestries Reported - Swedish (%)
Ancestries Reported - Swiss (%)
Ancestries Reported - Ukrainian (%)
Ancestries Reported - United States (%)
Ancestries Reported - Welsh (%)
Ancestries Reported - West Indian (%)
Ancestries Reported - Other (%)
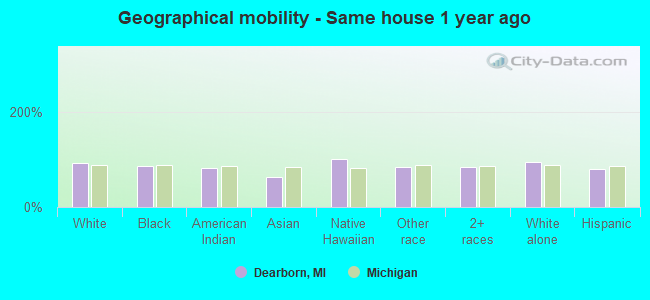
Geographical mobility - Same house 1 year ago (%)
Geographical mobility - Same house 1 year ago (%) - White
Geographical mobility - Same house 1 year ago (%) - Black or African American
Geographical mobility - Same house 1 year ago (%) - Asian
Geographical mobility - Same house 1 year ago (%) - Hispanic or Latino
Geographical mobility - Same house 1 year ago (%) - American Indian and Alaska Native
Geographical mobility - Same house 1 year ago (%) - Multirace
Geographical mobility - Same house 1 year ago (%) - Other Race
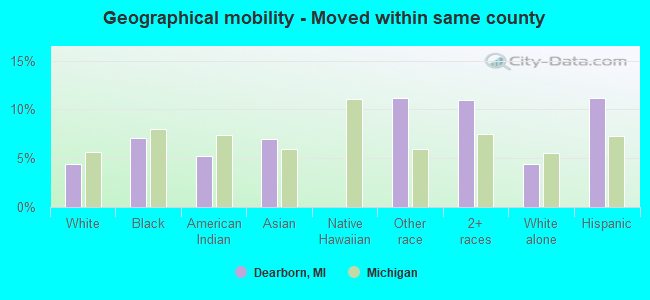
Geographical mobility - Moved within same county (%)
Geographical mobility - Moved within same county (%) - White
Geographical mobility - Moved within same county (%) - Black or African American
Geographical mobility - Moved within same county (%) - Asian
Geographical mobility - Moved within same county (%) - Hispanic or Latino
Geographical mobility - Moved within same county (%) - American Indian and Alaska Native
Geographical mobility - Moved within same county (%) - Multirace
Geographical mobility - Moved within same county (%) - Other Race
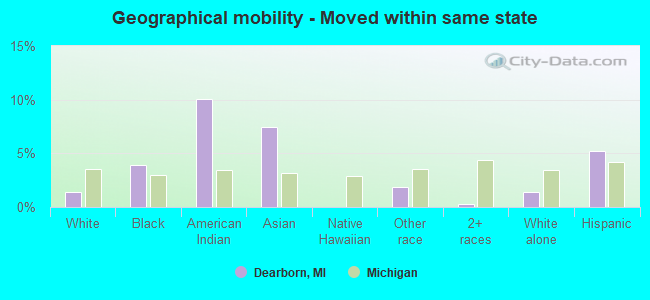
Geographical mobility - Moved from different county within same state (%)
Geographical mobility - Moved from different county within same state (%) - White
Geographical mobility - Moved from different county within same state (%) - Black or African American
Geographical mobility - Moved from different county within same state (%) - Asian
Geographical mobility - Moved from different county within same state (%) - Hispanic or Latino
Geographical mobility - Moved from different county within same state (%) - American Indian and Alaska Native
Geographical mobility - Moved from different county within same state (%) - Multirace
Geographical mobility - Moved from different county within same state (%) - Other Race
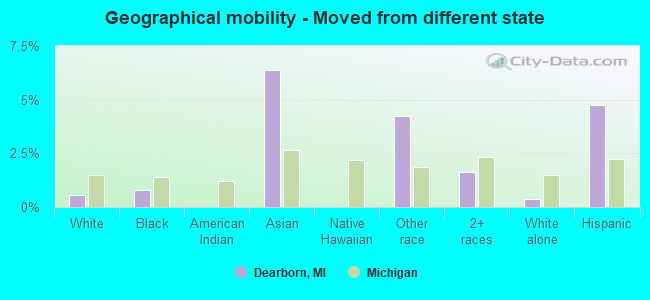
Geographical mobility - Moved from different state (%)
Geographical mobility - Moved from different state (%) - White
Geographical mobility - Moved from different state (%) - Black or African American
Geographical mobility - Moved from different state (%) - Asian
Geographical mobility - Moved from different state (%) - Hispanic or Latino
Geographical mobility - Moved from different state (%) - American Indian and Alaska Native
Geographical mobility - Moved from different state (%) - Multirace
Geographical mobility - Moved from different state (%) - Other Race
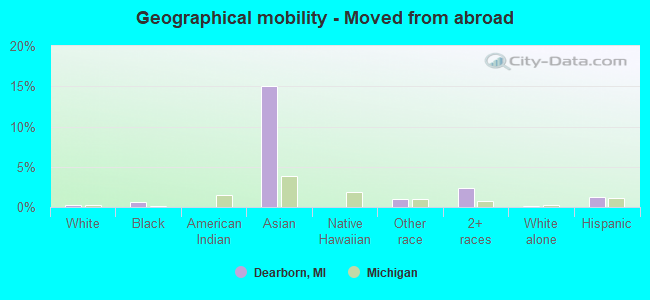
Geographical mobility - Moved from abroad (%)
Geographical mobility - Moved from abroad (%) - White
Geographical mobility - Moved from abroad (%) - Black or African American
Geographical mobility - Moved from abroad (%) - Asian
Geographical mobility - Moved from abroad (%) - Hispanic or Latino
Geographical mobility - Moved from abroad (%) - American Indian and Alaska Native
Geographical mobility - Moved from abroad (%) - Multirace
Geographical mobility - Moved from abroad (%) - Other Race
Place of birth for the foreign-born population - Ireland (%)
Place of birth for the foreign-born population - Denmark (%)
Place of birth for the foreign-born population - Norway (%)
Place of birth for the foreign-born population - Sweden (%)
Place of birth for the foreign-born population - United Kingdom (%)
Place of birth for the foreign-born population - England (%)
Place of birth for the foreign-born population - Scotland (%)
Place of birth for the foreign-born population - Other Northern Europe (%)
Place of birth for the foreign-born population - Austria (%)
Place of birth for the foreign-born population - Belgium (%)
Place of birth for the foreign-born population - France (%)
Place of birth for the foreign-born population - Germany (%)
Place of birth for the foreign-born population - Netherlands (%)
Place of birth for the foreign-born population - Switzerland (%)
Place of birth for the foreign-born population - Other Western Europe (%)
Place of birth for the foreign-born population - Greece (%)
Place of birth for the foreign-born population - Italy (%)
Place of birth for the foreign-born population - Portugal (%)
Place of birth for the foreign-born population - Spain (%)
Place of birth for the foreign-born population - Other Southern Europe (%)
Place of birth for the foreign-born population - Albania (%)
Place of birth for the foreign-born population - Belarus (%)
Place of birth for the foreign-born population - Bosnia and Herzegovina (%)
Place of birth for the foreign-born population - Bulgaria (%)
Place of birth for the foreign-born population - Croatia (%)
Place of birth for the foreign-born population - Czechoslovakia (%)
Place of birth for the foreign-born population - Hungary (%)
Place of birth for the foreign-born population - Latvia (%)
Place of birth for the foreign-born population - Lithuania (%)
Place of birth for the foreign-born population - North Macedonia (Macedonia) (%)
Place of birth for the foreign-born population - Moldova (%)
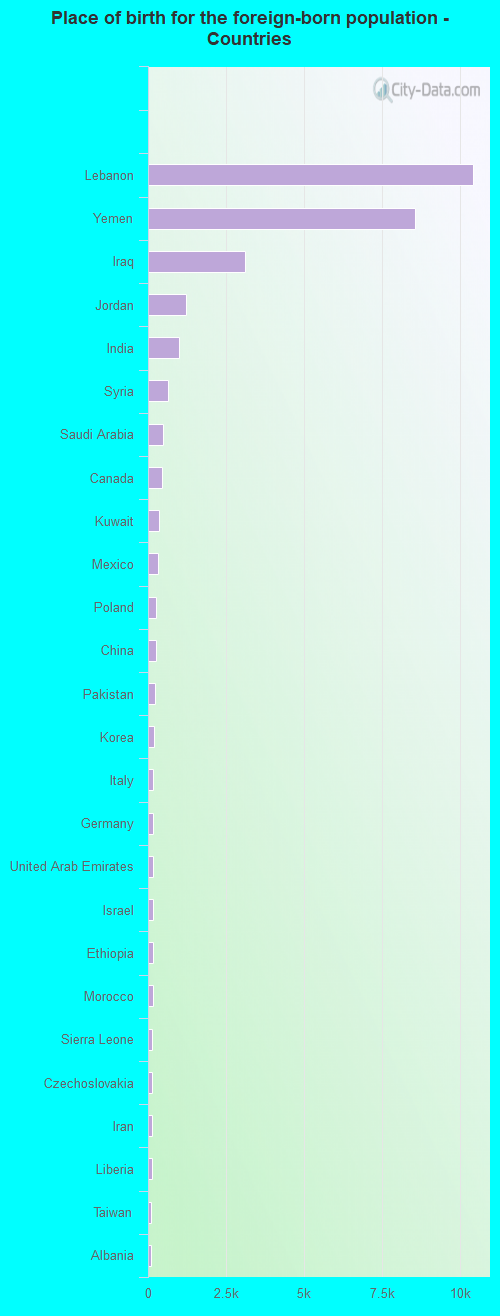
Place of birth for the foreign-born population - Poland (%)
Place of birth for the foreign-born population - Romania (%)
Place of birth for the foreign-born population - Russia (%)
Place of birth for the foreign-born population - Serbia (%)
Place of birth for the foreign-born population - Ukraine (%)
Place of birth for the foreign-born population - Other Eastern Europe (%)
Place of birth for the foreign-born population - China (%)
Place of birth for the foreign-born population - Hong Kong (%)
Place of birth for the foreign-born population - Taiwan (%)
Place of birth for the foreign-born population - Japan (%)
Place of birth for the foreign-born population - Korea (%)
Place of birth for the foreign-born population - Other Eastern Asia (%)
Place of birth for the foreign-born population - Afghanistan (%)
Place of birth for the foreign-born population - Bangladesh (%)
Place of birth for the foreign-born population - India (%)
Place of birth for the foreign-born population - Iran (%)
Place of birth for the foreign-born population - Kazakhstan (%)
Place of birth for the foreign-born population - Nepal (%)
Place of birth for the foreign-born population - Pakistan (%)
Place of birth for the foreign-born population - Sri Lanka (%)
Place of birth for the foreign-born population - Uzbekistan (%)
Place of birth for the foreign-born population - Other South Central Asia (%)
Place of birth for the foreign-born population - Burma (%)
Place of birth for the foreign-born population - Cambodia (%)
Place of birth for the foreign-born population - Indonesia (%)
Place of birth for the foreign-born population - Laos (%)
Place of birth for the foreign-born population - Malaysia (%)
Place of birth for the foreign-born population - Philippines (%)
Place of birth for the foreign-born population - Singapore (%)
Place of birth for the foreign-born population - Thailand (%)
Place of birth for the foreign-born population - Vietnam (%)
Place of birth for the foreign-born population - Other South Eastern Asia (%)
Place of birth for the foreign-born population - Armenia (%)
Place of birth for the foreign-born population - Iraq (%)
Place of birth for the foreign-born population - Israel (%)
Place of birth for the foreign-born population - Jordan (%)
Place of birth for the foreign-born population - Kuwait (%)
Place of birth for the foreign-born population - Lebanon (%)
Place of birth for the foreign-born population - Saudi Arabia (%)
Place of birth for the foreign-born population - Syria (%)
Place of birth for the foreign-born population - Turkey (%)
Place of birth for the foreign-born population - Yemen (%)
Place of birth for the foreign-born population - Other Western Asia (%)
Place of birth for the foreign-born population - Eritrea (%)
Place of birth for the foreign-born population - Ethiopia (%)
Place of birth for the foreign-born population - Kenya (%)
Place of birth for the foreign-born population - Somalia (%)
Place of birth for the foreign-born population - Uganda (%)
Place of birth for the foreign-born population - Zimbabwe (%)
Place of birth for the foreign-born population - Other Eastern Africa (%)
Place of birth for the foreign-born population - Cameroon (%)
Place of birth for the foreign-born population - Congo (%)
Place of birth for the foreign-born population - Democratic Republic of Congo (Zaire) (%)
Place of birth for the foreign-born population - Other Middle Africa (%)
Place of birth for the foreign-born population - Egypt (%)
Place of birth for the foreign-born population - Morocco (%)
Place of birth for the foreign-born population - Sudan (%)
Place of birth for the foreign-born population - Other Northern Africa (%)
Place of birth for the foreign-born population - South Africa (%)
Place of birth for the foreign-born population - Other Southern Africa (%)
Place of birth for the foreign-born population - Cabo Verde (%)
Place of birth for the foreign-born population - Ghana (%)
Place of birth for the foreign-born population - Liberia (%)
Place of birth for the foreign-born population - Nigeria (%)
Place of birth for the foreign-born population - Senegal (%)
Place of birth for the foreign-born population - Sierra Leone (%)
Place of birth for the foreign-born population - Other Western Africa (%)
Place of birth for the foreign-born population - Australia (%)
Place of birth for the foreign-born population - New Zealand (%)
Place of birth for the foreign-born population - Fiji (%)
Place of birth for the foreign-born population - Micronesia (%)
Place of birth for the foreign-born population - Bahamas (%)
Place of birth for the foreign-born population - Barbados (%)
Place of birth for the foreign-born population - Cuba (%)
Place of birth for the foreign-born population - Dominica (%)
Place of birth for the foreign-born population - Dominican Republic (%)
Place of birth for the foreign-born population - Grenada (%)
Place of birth for the foreign-born population - Haiti (%)
Place of birth for the foreign-born population - Jamaica (%)
Place of birth for the foreign-born population - St. Vincent and the Grenadines (%)
Place of birth for the foreign-born population - Trinidad and Tobago (%)
Place of birth for the foreign-born population - West Indies (%)
Place of birth for the foreign-born population - Other Caribbean (%)
Place of birth for the foreign-born population - Belize (%)
Place of birth for the foreign-born population - Costa Rica (%)
Place of birth for the foreign-born population - El Salvador (%)
Place of birth for the foreign-born population - Guatemala (%)
Place of birth for the foreign-born population - Honduras (%)
Place of birth for the foreign-born population - Mexico (%)
Place of birth for the foreign-born population - Nicaragua (%)
Place of birth for the foreign-born population - Panama (%)
Place of birth for the foreign-born population - Other Central America (%)
Place of birth for the foreign-born population - Argentina (%)
Place of birth for the foreign-born population - Bolivia (%)
Place of birth for the foreign-born population - Brazil (%)
Place of birth for the foreign-born population - Chile (%)
Place of birth for the foreign-born population - Colombia (%)
Place of birth for the foreign-born population - Ecuador (%)
Place of birth for the foreign-born population - Guyana (%)
Place of birth for the foreign-born population - Peru (%)
Place of birth for the foreign-born population - Uruguay (%)
Place of birth for the foreign-born population - Venezuela (%)
Place of birth for the foreign-born population - Other South America (%)
Place of birth for the foreign-born population - Canada (%)
Place of birth for the foreign-born population - Other Northern America (%)
Place of birth for the foreign-born population - Other (%)
Latest news about races in Dearborn, MI collected exclusively by city-data.com from local newspapers, TV, and radio stations
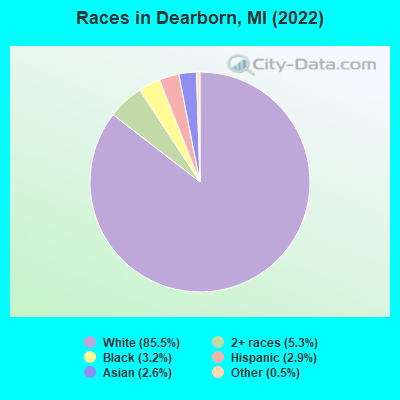
According to 2022 data, the most numerous races in Dearborn, MI are White alone (91,465 residents), Black alone (3,397 residents), and Hispanic (3,133 residents). 47.6% of Dearborn residents speak English at home. 29.3% of Dearborn, MI residents are foreign-born (25.7% born in Asia), which is 79.5% greater than the foreign-born rate of 6.0% across the entire state of Michigan.
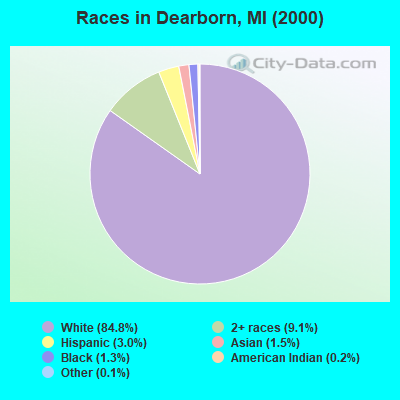
Race distribution in Dearborn
2000 2022
82,893 84.8% White alone 8,944 9.1% Two or more races 2,931 3.0% Hispanic 1,431 1.5% Asian alone 1,225 1.3% Black alone 214 0.2% American Indian alone 124 0.1% Other race alone 13 0.01% Native Hawaiian and Other
91,465 85.5% White alone 5,663 5.3% Two or more races 3,397 3.2% Black alone 3,133 2.9% Hispanic 2,737 2.6% Asian alone 549 0.5% Other race alone 65 0.06% American Indian alone
2000 2022
7,806,691 78.6% White alone 1,402,047 14.1% Black alone 323,877 3.3% Hispanic 175,311 1.8% Asian alone 163,487 1.6% Two or more races 53,421 0.5% American Indian alone 11,465 0.1% Other race alone 2,145 0.02% Native Hawaiian and Other
7,289,051 72.6% White alone 1,310,464 13.1% Black alone 572,405 5.7% Hispanic 450,031 4.5% Two or more races 335,732 3.3% Asian alone 45,217 0.5% Other race alone 29,011 0.3% American Indian alone 2,207 0.02% Native Hawaiian and Other
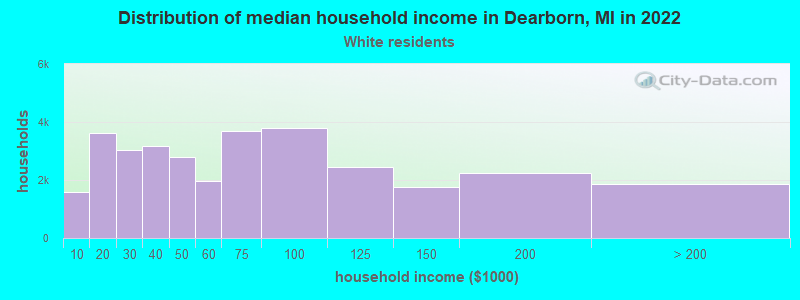
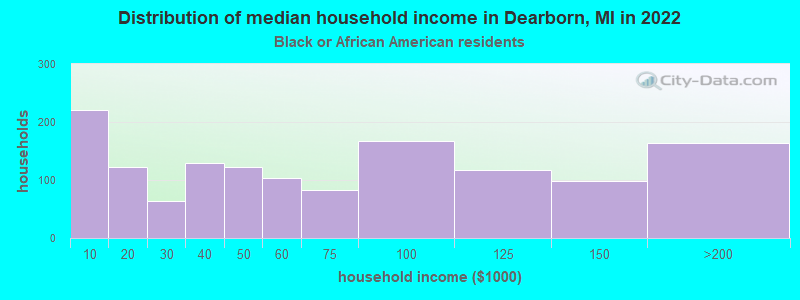
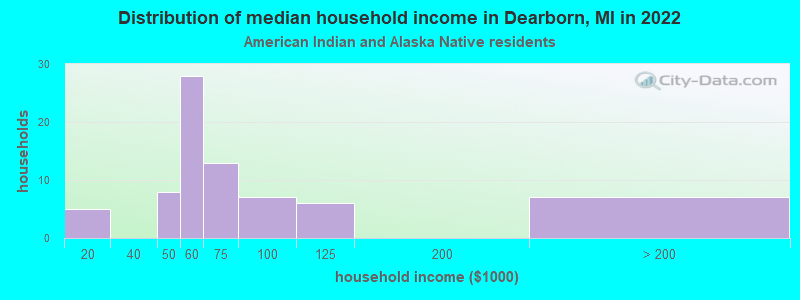
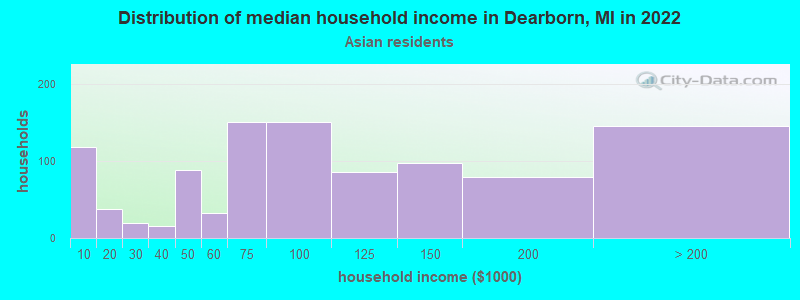
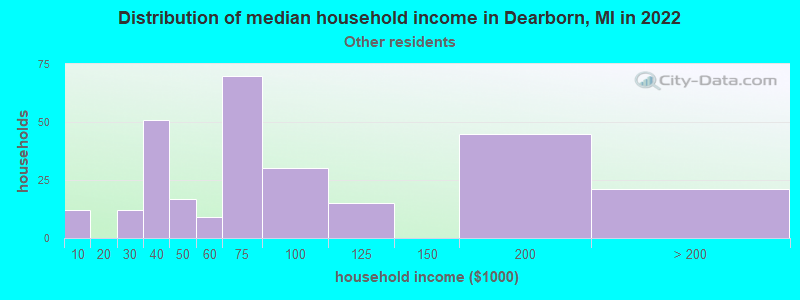
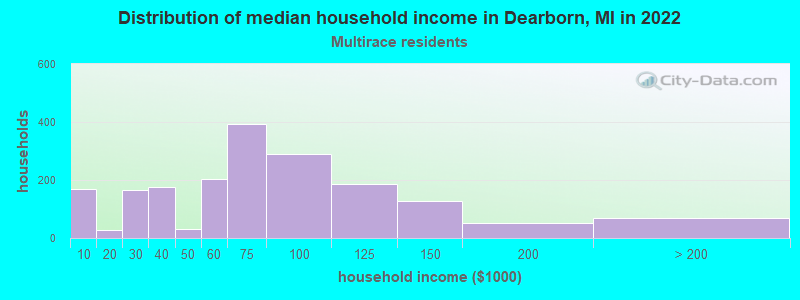
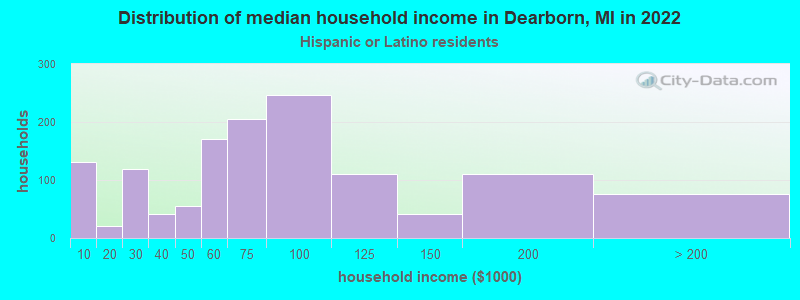
Income and house value in Dearborn Median household income in 2022 $58,076 White non-Hispanic householders$53,589 Black householders$84,540 Asian householders$38,085 Some other race householders$66,105 Two or more races householders$56,786 Hispanic or Latino race householdersMedian 2022 house value $215,266 White Non-Hispanic householders$265,672 Black or African American householders$184,323 American Indian or Alaska Native householders $232,068 Asian householders$113,622 Native Hawaiian and other Pacific Islander householders$180,331 Some other race householders$218,260 Two or more races householders$197,466 Hispanic or Latino householders
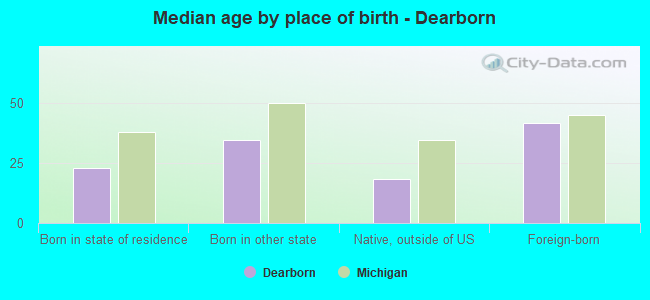
Median age by race in Dearborn
30.9 Median age for White residents30.7 31.5 33.4 Median age for Black or African American residents33.7 26.9 41.3 Median age for American Indian / Alaska Native residents44.6 31.6 30.3 Median age for Asian residents30.6 29.4 -666,666,666.0 Median age for Native Hawaiian / Pacific Islander residents-666,666,666.0 -666,666,666.0 63.9 Median age for Other race residents-666,666,666.0 63.7 21.1 Median age for Two or more races residents21.8 21.0 30.9 Median age for White alone residents30.8 31.3 36.3 Median age for Hispanic or Latino residents39.0 36.3
Owner/renter occupied households by race in Dearborn
House owners and renters - White residents 23,198 72.4% Owner occupied8,825 27.6% Renter occupiedHouse owners and renters - Black or African American residents 744 41.7% Owner occupied1,042 58.3% Renter occupiedHouse owners and renters - American Indian / Alaska Native residents 35 47.8% Owner occupied38 52.2% Renter occupiedHouse owners and renters - Asian residents 695 83.7% Owner occupied135 16.3% Renter occupiedHouse owners and renters - Other race residents 152 58.7% Owner occupied107 41.3% Renter occupiedHouse owners and renters - Two or more races residents 1,219 68.9% Owner occupied550 31.1% Renter occupiedHouse owners and renters - White alone residents 23,135 72.9% Owner occupied8,620 27.1% Renter occupiedHouse owners and renters - Hispanic or Latino residents 729 60.2% Owner occupied481 39.8% Renter occupied
Language usage in Dearborn
English speakers - Total 47.6% of residents of Dearborn speak English at home.
1.2% of residents speak Spanish at home 1,180 97.8% Speak English very well26 2.2% Speak English less than very well51.1% of residents speak other language at home 24,444 48.3% Speak English very well26,212 51.7% Speak English less than very well
English speakers - Born in the United States 76.8% of residents of Dearborn speak English at home.
2.1% of residents speak Spanish at home 173 86.9% Speak English very well26 13.1% Speak English less than very well21.1% of residents speak other language at home 1,689 85.4% Speak English very well289 14.6% Speak English less than very well
English speakers - Native, born elsewhere 57.3% of residents of Dearborn speak English at home.
3.1% of residents speak Spanish at home 79 100.0% Speak English very well39.6% of residents speak other language at home 527 51.4% Speak English very well498 48.6% Speak English less than very well
English speakers - Foreign-born 4.1% of residents of Dearborn speak English at home.
1.4% of residents speak Spanish at home 465 100.0% Speak English very well94.5% of residents speak other language at home 9,121 29.1% Speak English very well22,229 70.9% Speak English less than very well
White (Caucasian) - Speak only English Native:
66.2% (37,277)Foreign-born:
4.2% (1,276)
White (Caucasian) - Speak another language Native:
33.8% (19,014)Foreign-born:
95.8% (29,058)
Black or African American - Speak only English Native:
93.4% (3,016)Foreign-born:
29.5% (29)
Black or African American - Speak another language Native:
4.6% (148)Foreign-born:
69.6% (68)
American Indian / Alaska Native - Speak only English Native:
59.8% (74)Foreign-born:
24.8% (5)
Asian - Speak only English Native:
55.1% (370)Foreign-born:
14.3% (290)
Asian - Speak another language Native:
43.5% (293)Foreign-born:
85.8% (1,733)
Other race - Speak another language Native:
70.8% (552)Foreign-born:
100.0% (218)
Two or more races - Speak another language Native:
16.8% (645)Foreign-born:
100.0% (895)
White alone - Speak only English Native:
66.3% (37,046)Foreign-born:
4.2% (1,276)
White alone - Speak another language Native:
33.7% (18,841)Foreign-born:
95.8% (28,911)
Hispanic or Latino - Speak only English Native:
66.7% (1,759)Foreign-born:
3.1% (13)
Hispanic or Latino - Speak another language Native:
32.8% (865)Foreign-born:
97.6% (417)
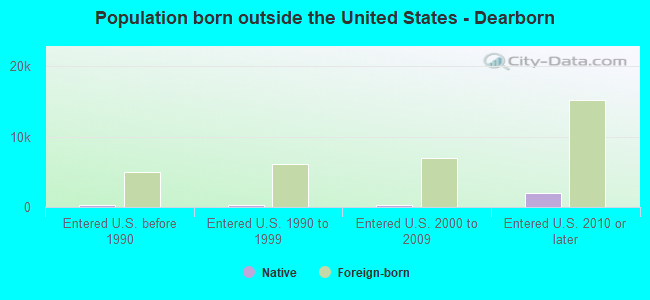
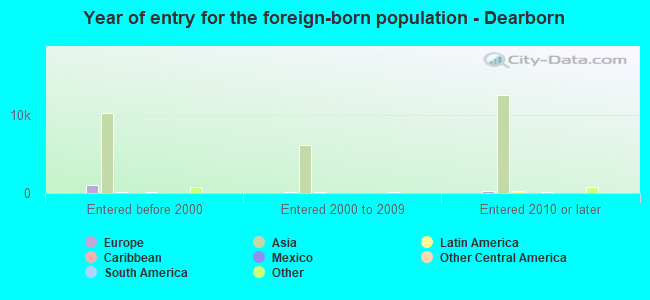
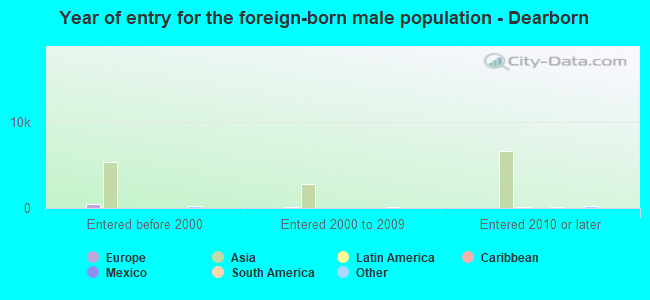
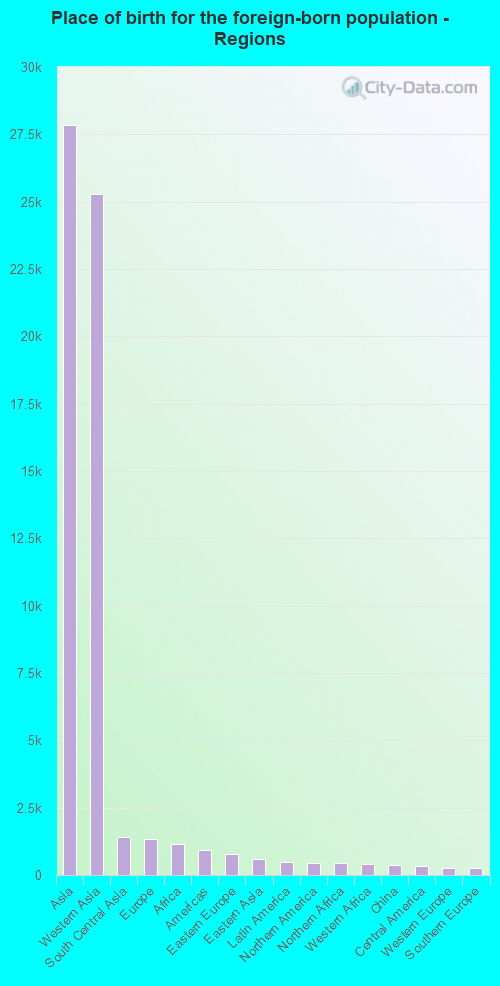
Foreign-born residents in Dearborn 31,327 residents are foreign born (25.7% Asia ).
This city:
29.3%Michigan:
6.9%
Marital status for residents in Dearborn Marital status - White (Caucasian) population 15 years and over
Males 35.9% Never married55.4% Now married1.4% Separated1.5% Widowed5.8% DivorcedFemales 30.1% Never married50.8% Now married0.4% Separated9.7% Widowed9.0% DivorcedWomen who gave birth in the past 12 months Now married:
90.8% (1,959)Unmarried:
9.2% (198)
Women who did not give birth in the past 12 months Now married:
47.9% (10,286)Unmarried:
52.1% (11,172)
Marital status - Black or African American population 15 years and over
Males 44.8% Never married45.5% Now married0.0% Separated0.2% Widowed9.5% DivorcedFemales 41.7% Never married22.7% Now married1.9% Separated8.7% Widowed25.0% DivorcedWomen who gave birth in the past 12 months Now married:
88.1% (70)Unmarried:
11.9% (9)
Women who did not give birth in the past 12 months Now married:
19.0% (156)Unmarried:
81.0% (665)
Marital status - American Indian / Alaska Native population 15 years and over
Males 36.8% Never married5.7% Now married0.0% Separated0.0% Widowed57.5% DivorcedFemales 25.4% Never married28.8% Now married0.0% Separated23.7% Widowed22.0% DivorcedWomen who did not give birth in the past 12 months Now married:
30.3% (10)Unmarried:
69.7% (24)
Marital status - Asian population 15 years and over
Males 41.2% Never married46.8% Now married9.0% Separated0.6% Widowed2.4% DivorcedFemales 25.6% Never married61.1% Now married0.0% Separated1.5% Widowed11.8% DivorcedWomen who gave birth in the past 12 months Now married:
100.0% (37)Unmarried:
0.0% (0)
Women who did not give birth in the past 12 months Now married:
53.6% (369)Unmarried:
46.4% (320)
Marital status - Other race population 15 years and over
Males 40.6% Never married55.9% Now married0.0% Separated3.4% Widowed0.0% DivorcedFemales 50.7% Never married39.2% Now married0.0% Separated0.0% Widowed10.1% DivorcedWomen who gave birth in the past 12 months Now married:
100.0% (29)Unmarried:
0.0% (0)
Women who did not give birth in the past 12 months Now married:
30.8% (87)Unmarried:
69.2% (196)
Marital status - Two or more races population 15 years and over
Males 42.7% Never married52.4% Now married1.2% Separated0.0% Widowed3.7% DivorcedFemales 38.7% Never married51.4% Now married0.7% Separated0.9% Widowed8.2% DivorcedWomen who gave birth in the past 12 months Now married:
100.0% (80)Unmarried:
0.0% (0)
Women who did not give birth in the past 12 months Now married:
49.2% (913)Unmarried:
50.8% (944)
Marital status - White alone, not Hispanic / Latino population 15 years and over
Males 36.0% Never married55.3% Now married1.4% Separated1.5% Widowed5.8% DivorcedFemales 30.3% Never married51.0% Now married0.4% Separated9.6% Widowed8.7% DivorcedWomen who gave birth in the past 12 months Now married:
90.8% (1,959)Unmarried:
9.2% (198)
Women who did not give birth in the past 12 months Now married:
48.1% (10,176)Unmarried:
51.9% (10,967)
Marital status - Hispanic or Latino population 15 years and over
Males 44.0% Never married46.4% Now married0.0% Separated1.3% Widowed8.3% DivorcedFemales 35.1% Never married41.0% Now married0.0% Separated7.9% Widowed16.1% DivorcedWomen who did not give birth in the past 12 months Now married:
46.2% (423)Unmarried:
53.8% (492)
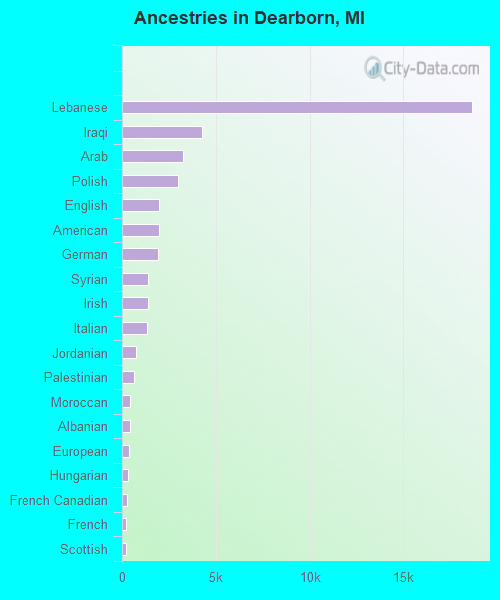
Ancestries in Dearborn
18,636 29.3% Lebanese4,259 6.7% Iraqi3,265 5.1% Arab2,965 4.7% Polish1,998 3.1% English1,957 3.1% American1,908 3.0% German1,410 2.2% Syrian1,377 2.2% Irish1,316 2.1% Italian731 1.1% Jordanian627 1.0% Palestinian439 0.7% Moroccan431 0.7% Albanian366 0.6% European320 0.5% Hungarian250 0.4% French Canadian233 0.4% French229 0.4% Scottish155 0.2% Ukrainian149 0.2% Iranian132 0.2% Nigerian114 0.2% Ethiopian114 0.2% African103 0.2% Greek99 0.2% Scotch-Irish94 0.1% Swedish86 0.1% Dutch81 0.1% Norwegian81 0.1% Czech77 0.1% Northern European74 0.1% Afghan74 0.1% Canadian72 0.1% Armenian68 0.1% British67 0.1% Eastern European67 0.1% Maltese65 0.1% Macedonian44 0.07% Lithuanian37 0.06% Finnish35 0.06% Slovak33 0.05% Romanian31 0.05% Yugoslavian30 0.05% Slavic30 0.05% Egyptian26 0.04% Czechoslovakian26 0.04% Scandinavian26 0.04% Serbian25 0.04% Belgian23 0.04% Assyrian20 0.03% Danish18 0.03% Israeli18 0.03% Celtic17 0.03% Russian16 0.03% Welsh15 0.02% Ghanaian11 0.02% Portuguese10 0.02% Jamaican9 0.01% Bulgarian9 0.01% Brazilian9 0.01% Haitian8 0.01% Sudanese5 0.01% Turkish
Geographical mobility in Dearborn Same house 1 year ago 86,571 93.3% White (Caucasian)2,978 86.5% Black or African American130 81.1% American Indian / Alaska Native1,695 61.7% Asian5 100.0% Native Hawaiian / Pacific Islander868 83.4% Other race6,111 83.2% Two or more races86,337 93.7% White alone, not Hispanic / Latino2,475 78.8% Hispanic or LatinoMoved within same county 4,074 4.4% White / Caucasian244 7.1% Black or African American8 5.2% American Indian / Alaska Native193 7.0% Asian116 11.1% Other race809 11.0% Two or more races4,016 4.4% White alone, not Hispanic / Latino349 11.1% Hispanic or LatinoMoved within same state 1,314 1.4% White / Caucasian134 3.9% Black or African American16 10.1% American Indian / Alaska Native206 7.5% Asian19 1.9% Other race21 0.3% Two or more races1,314 1.4% White alone, not Hispanic / Latino164 5.2% Hispanic or LatinoMoved from different state 498 0.5% White / Caucasian27 0.8% Black or African American176 6.4% Asian44 4.3% Other race121 1.6% Two or more races351 0.4% White alone, not Hispanic / Latino149 4.7% Hispanic or LatinoMoved from abroad 283 0.3% White21 0.6% Black or African American414 15.1% Asian11 1.1% Other race170 2.3% Two or more races110 0.1% White alone, not Hispanic / Latino39 1.3% Hispanic or Latino
Children Nativity (place of birth) in Dearborn
Children under 6 years - Living with two parents Both parents native 3,499 100.0% NativeBoth parents foreign-born 4,680 97.4% Native124 2.6% Foreign-bornOne native, one foreign-born parent 1,677 97.1% Native50 2.9% Foreign-bornChildren under 6 years - Living with one parent Native parent 327 100.0% NativeChildren 6 to 17 years - Living with two parents Both parents native 5,136 100.0% NativeBoth parents foreign-born 10,096 72.3% Native3,859 27.7% Foreign-bornOne native, one foreign-born parent 1,418 100.0% NativeChildren 6 to 17 years - Living with one parent Native parent 1,450 100.0% NativeForeign-born parent 1,361 61.4% Native855 38.6% Foreign-born
Grandparents responsible for own grandchildren in Dearborn
Grandparents (30 to 59 years) White / Caucasian 188 53.5% Responsible for grandchildren163 46.5% Not responsible for grandchildrenTwo or more races 22 100.0% Not responsible for grandchildrenWhite alone, not Hispanic / Latino 188 52.1% Responsible for grandchildren173 47.9% Not responsible for grandchildrenGrandparents (60 years and over) White / Caucasian 201 23.0% Responsible for grandchildren672 77.0% Not responsible for grandchildrenTwo or more races 3 100.0% Not responsible for grandchildrenWhite alone, not Hispanic / Latino 168 19.4% Responsible for grandchildren698 80.6% Not responsible for grandchildren