Races in Decatur, Georgia (GA) Detailed Stats
Data:
Races - White alone (%)
Races - White alone (% change since 2000)
Races - Black alone (%)
Races - Black alone (% change since 2000)
Races - American Indian alone (%)
Races - American Indian alone (% change since 2000)
Races - Asian alone (%)
Races - Asian alone (% change since 2000)
Races - Hispanic (%)
Races - Hispanic (% change since 2000)
Races - Native Hawaiian and Other Pacific Islander alone (%)
Races - Native Hawaiian and Other Pacific Islander alone (% change since 2000)
Races - Two or more races(%)
Races - Two or more races(% change since 2000)
Races - Other race alone (%)
Races - Other race alone (% change since 2000)
Racial diversity
Place of birth - Born in state of residence (%)
Place of birth - Born in state of residence (%) - White
Place of birth - Born in state of residence (%) - Black or African American
Place of birth - Born in state of residence (%) - Asian
Place of birth - Born in state of residence (%) - Hispanic or Latino
Place of birth - Born in state of residence (%) - American Indian and Alaska Native
Place of birth - Born in state of residence (%) - Multirace
Place of birth - Born in state of residence (%) - Other Race
Place of birth - Born in other state (%)
Place of birth - Born in other state (%) - White
Place of birth - Born in other state (%) - Black or African American
Place of birth - Born in other state (%) - Asian
Place of birth - Born in other state (%) - Hispanic or Latino
Place of birth - Born in other state (%) - American Indian and Alaska Native
Place of birth - Born in other state (%) - Multirace
Place of birth - Born in other state (%) - Other Race
Place of birth - Native, outside of US (%)
Place of birth - Native, outside of US (%) - White
Place of birth - Native, outside of US (%) - Black or African American
Place of birth - Native, outside of US (%) - Asian
Place of birth - Native, outside of US (%) - Hispanic or Latino
Place of birth - Native, outside of US (%) - American Indian and Alaska Native
Place of birth - Native, outside of US (%) - Multirace
Place of birth - Native, outside of US (%) - Other Race
Place of birth - Foreign born (%)
Place of birth - Foreign born (%) - White
Place of birth - Foreign born (%) - Black or African American
Place of birth - Foreign born (%) - Asian
Place of birth - Foreign born (%) - Hispanic or Latino
Place of birth - Foreign born (%) - American Indian and Alaska Native
Place of birth - Foreign born (%) - Multirace
Place of birth - Foreign born (%) - Other Race
Residents speaking English at home (%)
Residents speaking English at home - Born in the United States (%)
Residents speaking English at home - Native, born elsewhere (%)
Residents speaking English at home - Foreign born (%)
Residents speaking Spanish at home (%)
Residents speaking Spanish at home - Born in the United States (%)
Residents speaking Spanish at home - Native, born elsewhere (%)
Residents speaking Spanish at home - Foreign born (%)
Residents speaking other language at home (%)
Residents speaking other language at home - Born in the United States (%)
Residents speaking other language at home - Native, born elsewhere (%)
Residents speaking other language at home - Foreign born (%)
Marital status - Never married (%)
Marital status - Now married (%)
Marital status - Separated (%)
Marital status - Widowed (%)
Marital status - Divorced (%)
Ancestries Reported - Arab (%)
Ancestries Reported - Czech (%)
Ancestries Reported - Danish (%)
Ancestries Reported - Dutch (%)
Ancestries Reported - English (%)
Ancestries Reported - French (%)
Ancestries Reported - French Canadian (%)
Ancestries Reported - German (%)
Ancestries Reported - Greek (%)
Ancestries Reported - Hungarian (%)
Ancestries Reported - Irish (%)
Ancestries Reported - Italian (%)
Ancestries Reported - Lithuanian (%)
Ancestries Reported - Norwegian (%)
Ancestries Reported - Polish (%)
Ancestries Reported - Portuguese (%)
Ancestries Reported - Russian (%)
Ancestries Reported - Scotch-Irish (%)
Ancestries Reported - Scottish (%)
Ancestries Reported - Slovak (%)
Ancestries Reported - Subsaharan African (%)
Ancestries Reported - Swedish (%)
Ancestries Reported - Swiss (%)
Ancestries Reported - Ukrainian (%)
Ancestries Reported - United States (%)
Ancestries Reported - Welsh (%)
Ancestries Reported - West Indian (%)
Ancestries Reported - Other (%)
Geographical mobility - Same house 1 year ago (%)
Geographical mobility - Same house 1 year ago (%) - White
Geographical mobility - Same house 1 year ago (%) - Black or African American
Geographical mobility - Same house 1 year ago (%) - Asian
Geographical mobility - Same house 1 year ago (%) - Hispanic or Latino
Geographical mobility - Same house 1 year ago (%) - American Indian and Alaska Native
Geographical mobility - Same house 1 year ago (%) - Multirace
Geographical mobility - Same house 1 year ago (%) - Other Race
Geographical mobility - Moved within same county (%)
Geographical mobility - Moved within same county (%) - White
Geographical mobility - Moved within same county (%) - Black or African American
Geographical mobility - Moved within same county (%) - Asian
Geographical mobility - Moved within same county (%) - Hispanic or Latino
Geographical mobility - Moved within same county (%) - American Indian and Alaska Native
Geographical mobility - Moved within same county (%) - Multirace
Geographical mobility - Moved within same county (%) - Other Race
Geographical mobility - Moved from different county within same state (%)
Geographical mobility - Moved from different county within same state (%) - White
Geographical mobility - Moved from different county within same state (%) - Black or African American
Geographical mobility - Moved from different county within same state (%) - Asian
Geographical mobility - Moved from different county within same state (%) - Hispanic or Latino
Geographical mobility - Moved from different county within same state (%) - American Indian and Alaska Native
Geographical mobility - Moved from different county within same state (%) - Multirace
Geographical mobility - Moved from different county within same state (%) - Other Race
Geographical mobility - Moved from different state (%)
Geographical mobility - Moved from different state (%) - White
Geographical mobility - Moved from different state (%) - Black or African American
Geographical mobility - Moved from different state (%) - Asian
Geographical mobility - Moved from different state (%) - Hispanic or Latino
Geographical mobility - Moved from different state (%) - American Indian and Alaska Native
Geographical mobility - Moved from different state (%) - Multirace
Geographical mobility - Moved from different state (%) - Other Race
Geographical mobility - Moved from abroad (%)
Geographical mobility - Moved from abroad (%) - White
Geographical mobility - Moved from abroad (%) - Black or African American
Geographical mobility - Moved from abroad (%) - Asian
Geographical mobility - Moved from abroad (%) - Hispanic or Latino
Geographical mobility - Moved from abroad (%) - American Indian and Alaska Native
Geographical mobility - Moved from abroad (%) - Multirace
Geographical mobility - Moved from abroad (%) - Other Race
Place of birth for the foreign-born population - Ireland (%)
Place of birth for the foreign-born population - Denmark (%)
Place of birth for the foreign-born population - Norway (%)
Place of birth for the foreign-born population - Sweden (%)
Place of birth for the foreign-born population - United Kingdom (%)
Place of birth for the foreign-born population - England (%)
Place of birth for the foreign-born population - Scotland (%)
Place of birth for the foreign-born population - Other Northern Europe (%)
Place of birth for the foreign-born population - Austria (%)
Place of birth for the foreign-born population - Belgium (%)
Place of birth for the foreign-born population - France (%)
Place of birth for the foreign-born population - Germany (%)
Place of birth for the foreign-born population - Netherlands (%)
Place of birth for the foreign-born population - Switzerland (%)
Place of birth for the foreign-born population - Other Western Europe (%)
Place of birth for the foreign-born population - Greece (%)
Place of birth for the foreign-born population - Italy (%)
Place of birth for the foreign-born population - Portugal (%)
Place of birth for the foreign-born population - Spain (%)
Place of birth for the foreign-born population - Other Southern Europe (%)
Place of birth for the foreign-born population - Albania (%)
Place of birth for the foreign-born population - Belarus (%)
Place of birth for the foreign-born population - Bosnia and Herzegovina (%)
Place of birth for the foreign-born population - Bulgaria (%)
Place of birth for the foreign-born population - Croatia (%)
Place of birth for the foreign-born population - Czechoslovakia (%)
Place of birth for the foreign-born population - Hungary (%)
Place of birth for the foreign-born population - Latvia (%)
Place of birth for the foreign-born population - Lithuania (%)
Place of birth for the foreign-born population - North Macedonia (Macedonia) (%)
Place of birth for the foreign-born population - Moldova (%)
Place of birth for the foreign-born population - Poland (%)
Place of birth for the foreign-born population - Romania (%)
Place of birth for the foreign-born population - Russia (%)
Place of birth for the foreign-born population - Serbia (%)
Place of birth for the foreign-born population - Ukraine (%)
Place of birth for the foreign-born population - Other Eastern Europe (%)
Place of birth for the foreign-born population - China (%)
Place of birth for the foreign-born population - Hong Kong (%)
Place of birth for the foreign-born population - Taiwan (%)
Place of birth for the foreign-born population - Japan (%)
Place of birth for the foreign-born population - Korea (%)
Place of birth for the foreign-born population - Other Eastern Asia (%)
Place of birth for the foreign-born population - Afghanistan (%)
Place of birth for the foreign-born population - Bangladesh (%)
Place of birth for the foreign-born population - India (%)
Place of birth for the foreign-born population - Iran (%)
Place of birth for the foreign-born population - Kazakhstan (%)
Place of birth for the foreign-born population - Nepal (%)
Place of birth for the foreign-born population - Pakistan (%)
Place of birth for the foreign-born population - Sri Lanka (%)
Place of birth for the foreign-born population - Uzbekistan (%)
Place of birth for the foreign-born population - Other South Central Asia (%)
Place of birth for the foreign-born population - Burma (%)
Place of birth for the foreign-born population - Cambodia (%)
Place of birth for the foreign-born population - Indonesia (%)
Place of birth for the foreign-born population - Laos (%)
Place of birth for the foreign-born population - Malaysia (%)
Place of birth for the foreign-born population - Philippines (%)
Place of birth for the foreign-born population - Singapore (%)
Place of birth for the foreign-born population - Thailand (%)
Place of birth for the foreign-born population - Vietnam (%)
Place of birth for the foreign-born population - Other South Eastern Asia (%)
Place of birth for the foreign-born population - Armenia (%)
Place of birth for the foreign-born population - Iraq (%)
Place of birth for the foreign-born population - Israel (%)
Place of birth for the foreign-born population - Jordan (%)
Place of birth for the foreign-born population - Kuwait (%)
Place of birth for the foreign-born population - Lebanon (%)
Place of birth for the foreign-born population - Saudi Arabia (%)
Place of birth for the foreign-born population - Syria (%)
Place of birth for the foreign-born population - Turkey (%)
Place of birth for the foreign-born population - Yemen (%)
Place of birth for the foreign-born population - Other Western Asia (%)
Place of birth for the foreign-born population - Eritrea (%)
Place of birth for the foreign-born population - Ethiopia (%)
Place of birth for the foreign-born population - Kenya (%)
Place of birth for the foreign-born population - Somalia (%)
Place of birth for the foreign-born population - Uganda (%)
Place of birth for the foreign-born population - Zimbabwe (%)
Place of birth for the foreign-born population - Other Eastern Africa (%)
Place of birth for the foreign-born population - Cameroon (%)
Place of birth for the foreign-born population - Congo (%)
Place of birth for the foreign-born population - Democratic Republic of Congo (Zaire) (%)
Place of birth for the foreign-born population - Other Middle Africa (%)
Place of birth for the foreign-born population - Egypt (%)
Place of birth for the foreign-born population - Morocco (%)
Place of birth for the foreign-born population - Sudan (%)
Place of birth for the foreign-born population - Other Northern Africa (%)
Place of birth for the foreign-born population - South Africa (%)
Place of birth for the foreign-born population - Other Southern Africa (%)
Place of birth for the foreign-born population - Cabo Verde (%)
Place of birth for the foreign-born population - Ghana (%)
Place of birth for the foreign-born population - Liberia (%)
Place of birth for the foreign-born population - Nigeria (%)
Place of birth for the foreign-born population - Senegal (%)
Place of birth for the foreign-born population - Sierra Leone (%)
Place of birth for the foreign-born population - Other Western Africa (%)
Place of birth for the foreign-born population - Australia (%)
Place of birth for the foreign-born population - New Zealand (%)
Place of birth for the foreign-born population - Fiji (%)
Place of birth for the foreign-born population - Micronesia (%)
Place of birth for the foreign-born population - Bahamas (%)
Place of birth for the foreign-born population - Barbados (%)
Place of birth for the foreign-born population - Cuba (%)
Place of birth for the foreign-born population - Dominica (%)
Place of birth for the foreign-born population - Dominican Republic (%)
Place of birth for the foreign-born population - Grenada (%)
Place of birth for the foreign-born population - Haiti (%)
Place of birth for the foreign-born population - Jamaica (%)
Place of birth for the foreign-born population - St. Vincent and the Grenadines (%)
Place of birth for the foreign-born population - Trinidad and Tobago (%)
Place of birth for the foreign-born population - West Indies (%)
Place of birth for the foreign-born population - Other Caribbean (%)
Place of birth for the foreign-born population - Belize (%)
Place of birth for the foreign-born population - Costa Rica (%)
Place of birth for the foreign-born population - El Salvador (%)
Place of birth for the foreign-born population - Guatemala (%)
Place of birth for the foreign-born population - Honduras (%)
Place of birth for the foreign-born population - Mexico (%)
Place of birth for the foreign-born population - Nicaragua (%)
Place of birth for the foreign-born population - Panama (%)
Place of birth for the foreign-born population - Other Central America (%)
Place of birth for the foreign-born population - Argentina (%)
Place of birth for the foreign-born population - Bolivia (%)
Place of birth for the foreign-born population - Brazil (%)
Place of birth for the foreign-born population - Chile (%)
Place of birth for the foreign-born population - Colombia (%)
Place of birth for the foreign-born population - Ecuador (%)
Place of birth for the foreign-born population - Guyana (%)
Place of birth for the foreign-born population - Peru (%)
Place of birth for the foreign-born population - Uruguay (%)
Place of birth for the foreign-born population - Venezuela (%)
Place of birth for the foreign-born population - Other South America (%)
Place of birth for the foreign-born population - Canada (%)
Place of birth for the foreign-born population - Other Northern America (%)
Place of birth for the foreign-born population - Other (%)
Latest news about races in Decatur, GA collected exclusively by city-data.com from local newspapers, TV, and radio stations
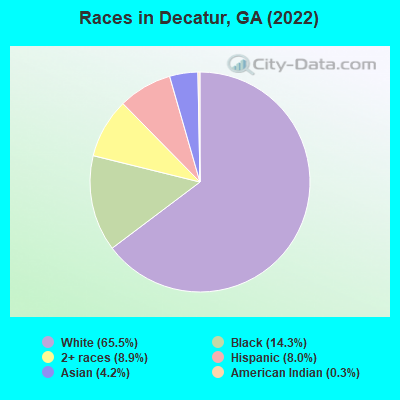
According to 2022 data, the most numerous races in Decatur, GA are White alone (16,019 residents), Black alone (3,509 residents), and Hispanic (1,954 residents). 87.2% of Decatur residents speak English at home. 9.3% of Decatur, GA residents are foreign-born (4.0% born in Asia, 1.9% born in Europe, 1.4% born in Africa, 1.2% born in Latin America), which is 7.8% less than the foreign-born rate of 10.0% across the entire state of Georgia.
Race distribution in Decatur
2000 2022
5,128,661 62.6% White alone 2,331,465 28.5% Black alone 435,227 5.3% Hispanic 171,513 2.1% Asian alone 87,364 1.1% Two or more races 17,670 0.2% American Indian alone 11,275 0.1% Other race alone 3,278 0.04% Native Hawaiian and Other
5,415,657 49.6% White alone 3,349,240 30.7% Black alone 1,132,604 10.4% Hispanic 479,156 4.4% Asian alone 462,923 4.2% Two or more races 54,416 0.5% Other race alone 11,923 0.1% American Indian alone 6,957 0.06% Native Hawaiian and Other
Income and house value in Decatur Median household income in 2022 $159,784 White non-Hispanic householders$30,834 Black householders$135,319 Asian householders$121,681 Two or more races householders$102,190 Hispanic or Latino race householdersMedian 2022 house value $849,002 White Non-Hispanic householders$414,147 Black or African American householders over $1,000,000 Asian householders$803,303 Some other race householders$752,963 Two or more races householders$638,358 Hispanic or Latino householders
Median age by race in Decatur
44.2 Median age for White residents43.1 45.7 34.4 Median age for Black or African American residents29.4 37.2 17.5 Median age for American Indian / Alaska Native residents-658,914,728.0 12.6 37.2 Median age for Asian residents36.4 38.0 -657,243,815.6 Median age for Native Hawaiian / Pacific Islander residents-693,227,090.9 -776,776,776.0 30.6 Median age for Other race residents31.8 20.7 12.6 Median age for Two or more races residents10.8 14.5 44.0 Median age for White alone residents43.4 45.0 17.8 Median age for Hispanic or Latino residents13.8 25.4
Owner/renter occupied households by race in Decatur
House owners and renters - White residents 4,888 75.7% Owner occupied1,565 24.3% Renter occupiedHouse owners and renters - Black or African American residents 356 27.7% Owner occupied929 72.3% Renter occupiedHouse owners and renters - American Indian / Alaska Native residents 56 100.0% Owner occupiedHouse owners and renters - Asian residents 235 54.4% Owner occupied197 45.6% Renter occupiedHouse owners and renters - Other race residents 60 100.0% Renter occupiedHouse owners and renters - Two or more races residents 311 53.3% Owner occupied273 46.7% Renter occupiedHouse owners and renters - White alone residents 4,789 75.2% Owner occupied1,579 24.8% Renter occupiedHouse owners and renters - Hispanic or Latino residents 254 48.7% Owner occupied268 51.3% Renter occupied
Language usage in Decatur
English speakers - Total 87.2% of residents of Decatur speak English at home.
4.6% of residents speak Spanish at home 851 80.1% Speak English very well211 19.9% Speak English less than very well8.8% of residents speak other language at home 1,675 82.9% Speak English very well345 17.1% Speak English less than very well
English speakers - Born in the United States 90.7% of residents of Decatur speak English at home.
5.2% of residents speak Spanish at home 411 70.9% Speak English very well169 29.1% Speak English less than very well4.0% of residents speak other language at home 413 93.9% Speak English very well27 6.1% Speak English less than very well
English speakers - Native, born elsewhere 61.8% of residents of Decatur speak English at home.
18.9% of residents speak Spanish at home 127 100.0% Speak English very well13.7% of residents speak other language at home 92 100.0% Speak English very well
English speakers - Foreign-born 29.4% of residents of Decatur speak English at home.
13.1% of residents speak Spanish at home 242 90.0% Speak English very well27 10.0% Speak English less than very well63.9% of residents speak other language at home 1,005 76.6% Speak English very well307 23.4% Speak English less than very well
White (Caucasian) - Speak only English Native:
96.3% (14,653)Foreign-born:
45.4% (203)
White (Caucasian) - Speak another language Native:
3.8% (576)Foreign-born:
59.7% (266)
Black or African American - Speak only English Native:
97.8% (3,120)Foreign-born:
39.4% (86)
Black or African American - Speak another language Native:
2.0% (64)Foreign-born:
60.6% (132)
Asian - Speak only English Native:
43.3% (177)Foreign-born:
28.6% (166)
Asian - Speak another language Native:
56.9% (232)Foreign-born:
65.9% (382)
Other race - Speak only English Native:
49.4% (35)Foreign-born:
4.3% (4)
Other race - Speak another language Native:
37.6% (27)Foreign-born:
96.8% (88)
Two or more races - Speak only English Native:
88.2% (1,842)Foreign-born:
3.0% (11)
Two or more races - Speak another language Native:
14.4% (300)Foreign-born:
94.0% (337)
White alone - Speak only English Native:
95.2% (14,192)Foreign-born:
34.0% (204)
White alone - Speak another language Native:
4.2% (631)Foreign-born:
66.0% (396)
Hispanic or Latino - Speak only English Native:
89.6% (1,301)Foreign-born:
4.4% (11)
Hispanic or Latino - Speak another language Native:
25.5% (370)Foreign-born:
95.1% (230)
Foreign-born residents in Decatur 2,271 residents are foreign born (4.0% Asia , 1.9% Europe , 1.4% Africa , 1.2% Latin America ).
This city:
9.3%Georgia:
10.4%
Marital status for residents in Decatur Marital status - White (Caucasian) population 15 years and over
Males 21.6% Never married68.7% Now married1.7% Separated0.9% Widowed7.1% DivorcedFemales 20.4% Never married60.4% Now married0.5% Separated6.6% Widowed12.1% DivorcedWomen who gave birth in the past 12 months Now married:
94.4% (158)Unmarried:
5.6% (9)
Women who did not give birth in the past 12 months Now married:
62.2% (2,198)Unmarried:
37.8% (1,337)
Marital status - Black or African American population 15 years and over
Males 54.9% Never married30.6% Now married1.0% Separated12.6% Widowed0.9% DivorcedFemales 57.3% Never married15.5% Now married5.0% Separated5.3% Widowed17.0% DivorcedWomen who gave birth in the past 12 months Now married:
0.0% (0)Unmarried:
100.0% (37)
Women who did not give birth in the past 12 months Now married:
13.6% (128)Unmarried:
86.4% (818)
Marital status - American Indian / Alaska Native population 15 years and over
Males 0.0% Never married100.0% Now married0.0% Separated0.0% Widowed0.0% DivorcedFemales 100.0% Never married0.0% Now married0.0% Separated0.0% Widowed0.0% DivorcedWomen who did not give birth in the past 12 months Now married:
0.0% (0)Unmarried:
100.0% (14)
Marital status - Asian population 15 years and over
Males 21.6% Never married65.9% Now married0.0% Separated0.0% Widowed12.6% DivorcedFemales 34.2% Never married54.1% Now married0.0% Separated0.0% Widowed11.7% DivorcedWomen who gave birth in the past 12 months Now married:
100.0% (32)Unmarried:
0.0% (0)
Women who did not give birth in the past 12 months Now married:
46.9% (176)Unmarried:
53.1% (199)
Marital status - Other race population 15 years and over
Males 66.7% Never married33.3% Now married0.0% Separated0.0% Widowed0.0% DivorcedFemales 65.0% Never married35.0% Now married0.0% Separated0.0% Widowed0.0% DivorcedWomen who gave birth in the past 12 months Now married:
100.0% (4)Unmarried:
0.0% (0)
Women who did not give birth in the past 12 months Now married:
10.3% (4)Unmarried:
89.7% (39)
Marital status - Two or more races population 15 years and over
Males 52.1% Never married46.4% Now married0.0% Separated0.0% Widowed1.5% DivorcedFemales 26.6% Never married49.1% Now married0.0% Separated12.0% Widowed12.3% DivorcedWomen who gave birth in the past 12 months Now married:
100.0% (5)Unmarried:
0.0% (0)
Women who did not give birth in the past 12 months Now married:
55.4% (257)Unmarried:
44.6% (207)
Marital status - White alone, not Hispanic / Latino population 15 years and over
Males 21.0% Never married69.2% Now married1.6% Separated0.9% Widowed7.3% DivorcedFemales 20.2% Never married60.0% Now married0.6% Separated6.7% Widowed12.5% DivorcedWomen who gave birth in the past 12 months Now married:
94.4% (166)Unmarried:
5.6% (10)
Women who did not give birth in the past 12 months Now married:
61.8% (2,157)Unmarried:
38.2% (1,334)
Marital status - Hispanic or Latino population 15 years and over
Males 56.4% Never married41.9% Now married1.7% Separated0.0% Widowed0.0% DivorcedFemales 30.8% Never married51.0% Now married0.0% Separated15.8% Widowed2.5% DivorcedWomen who gave birth in the past 12 months Now married:
100.0% (5)Unmarried:
0.0% (0)
Women who did not give birth in the past 12 months Now married:
61.2% (229)Unmarried:
38.8% (145)
Ancestries in Decatur
1,192 10.9% English1,000 9.1% European870 8.0% American805 7.4% German576 5.3% Irish402 3.7% Ethiopian354 3.2% Scottish228 2.1% Scotch-Irish199 1.8% Italian133 1.2% Russian115 1.1% Eastern European99 0.9% Afghan95 0.9% British94 0.9% Turkish87 0.8% French80 0.7% Jordanian66 0.6% Swiss63 0.6% Yugoslavian55 0.5% African53 0.5% Dutch53 0.5% Danish51 0.5% Polish45 0.4% Nigerian35 0.3% Swedish34 0.3% Norwegian30 0.3% Sudanese27 0.2% Lebanese24 0.2% Cape Verdean20 0.2% Armenian19 0.2% South African19 0.2% Czech15 0.1% Canadian15 0.1% Czechoslovakian14 0.1% Latvian13 0.1% Austrian13 0.1% Romanian13 0.1% Ukrainian12 0.1% Guyanese11 0.1% Portuguese11 0.1% Welsh10 0.09% Palestinian9 0.08% Israeli7 0.06% Haitian5 0.05% Lithuanian4 0.04% Moroccan
Geographical mobility in Decatur Same house 1 year ago 13,464 85.7% White (Caucasian)2,804 79.6% Black or African American37 55.8% American Indian / Alaska Native764 74.8% Asian120 73.6% Other race2,905 93.1% Two or more races13,646 85.7% White alone, not Hispanic / Latino1,614 83.1% Hispanic or LatinoMoved within same county 912 5.8% White / Caucasian284 8.1% Black or African American12 18.8% American Indian / Alaska Native92 9.0% Asian2 1.1% Other race56 1.8% Two or more races993 6.2% White alone, not Hispanic / Latino40 2.1% Hispanic or LatinoMoved within same state 448 2.9% White / Caucasian145 4.1% Black or African American13 19.9% American Indian / Alaska Native61 6.0% Asian8 4.6% Other race42 1.3% Two or more races462 2.9% White alone, not Hispanic / Latino86 4.4% Hispanic or LatinoMoved from different state 800 5.1% White / Caucasian216 6.1% Black or African American40 4.0% Asian10 6.2% Other race8 0.3% Two or more races716 4.5% White alone, not Hispanic / Latino127 6.5% Hispanic or LatinoMoved from abroad 119 0.8% White37 1.0% Black or African American21 2.0% Asian10 6.4% Other race200 6.4% Two or more races149 0.9% White alone, not Hispanic / Latino42 2.1% Hispanic or Latino
Children Nativity (place of birth) in Decatur
Children under 6 years - Living with two parents Both parents native 1,446 99.3% Native11 0.7% Foreign-bornBoth parents foreign-born 212 76.0% Native67 24.0% Foreign-bornOne native, one foreign-born parent 201 100.0% NativeChildren under 6 years - Living with one parent Native parent 196 100.0% NativeChildren 6 to 17 years - Living with two parents Both parents native 3,318 99.3% Native23 0.7% Foreign-bornBoth parents foreign-born 276 60.4% Native181 39.6% Foreign-bornOne native, one foreign-born parent 265 95.9% Native11 4.1% Foreign-bornChildren 6 to 17 years - Living with one parent Native parent 1,262 100.0% NativeForeign-born parent 20 46.0% Native23 54.0% Foreign-born
Grandparents responsible for own grandchildren in Decatur
Grandparents (30 to 59 years) Black or African American 21 100.0% Not responsible for grandchildren
Grandparents (60 years and over) Black or African American 34 100.0% Not responsible for grandchildren