Races in Deep River, Connecticut (CT) Detailed Stats
Ancestries, Foreign-born residents, place of birth

Recent posts about races in Deep River, Connecticut on our local forum with over 2,400,000 registered users:
 | 2024 Connecticut Town Tournament VI (Celebrating the 10-Year Anniversary & Dazzleman's Memorial) (1069 replies) |
| Connecticut TOWN TOURNAMENT V (2022) (831 replies) |
| Anywhere in CT fit this description? (54 replies) |
| Connecticut's Best Coffee Shops (29 replies) |
| Easton vs Weston (89 replies) |
| Connecticut TOWN TOURNAMENT IV (2020) (849 replies) |
1.5% of Deep River, CT residents are foreign-born , which is 873.9% less than the foreign-born rate of 15.0% across the entire state of Connecticut.
Race distribution in Deep River

- 4,28993.0%White alone
- 1363.0%Hispanic
- 992.1%Black alone
- 420.9%Two or more races
- 370.8%Asian alone
- 30.07%Native Hawaiian and Other
Pacific Islander alone - 20.04%Other race alone
- 20.04%American Indian alone

2000
2022
-
- 2,638,84577.5%White alone
- 320,3239.4%Hispanic
- 295,5718.7%Black alone
- 81,5642.4%Asian alone
- 52,8961.6%Two or more races
- 8,1410.2%Other race alone
- 7,2670.2%American Indian alone
- 9580.03%Native Hawaiian and Other
Pacific Islander alone

-
- 2,246,91362.0%White alone
- 658,97818.2%Hispanic
- 353,9739.8%Black alone
- 172,9294.8%Asian alone
- 159,6314.4%Two or more races
- 29,7610.8%Other race alone
- 3,4280.09%American Indian alone
- 5920.02%Native Hawaiian and Other
Pacific Islander alone

Income and house value in Deep River
- Median household income in 2022
- $86,945White non-Hispanic householders
- $22,233Black householders
- $40,259Native Hawaiian and other Pacific Islander householders
- $167,059Some other race householders
- $141,403Hispanic or Latino race householders
- Median 2022 house value
- $350,226White Non-Hispanic householders
- $397,572Hispanic or Latino householders
Household income for White non-Hispanic householders

Household income for Black householders

Household income for Native Hawaiian and other Pacific Islander householders

Household income for Hispanic or Latino race householders

Foreign-born residents in Deep River
71 residents are foreign born
| This city: | 1.5% |
| Connecticut: | 10.9% |
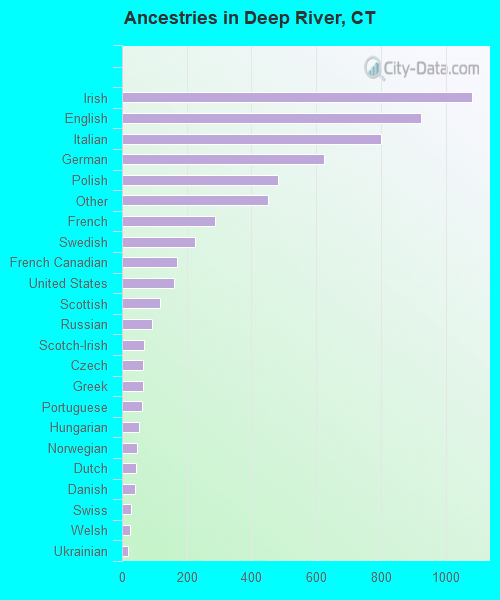
Ancestries in Deep River

- 1,08018.2%Irish
- 92315.5%English
- 80013.5%Italian
- 62310.5%German
- 4828.1%Polish
- 4527.6%Other
- 2864.8%French
- 2253.8%Swedish
- 1692.8%French Canadian
- 1602.7%United States
- 1172.0%Scottish
- 921.5%Russian
- 681.1%Scotch-Irish
- 661.1%Czech
- 651.1%Greek
- 631.1%Portuguese
- 530.9%Hungarian
- 460.8%Norwegian
- 430.7%Dutch
- 410.7%Danish
- 290.5%Swiss
- 240.4%Welsh
- 200.3%Ukrainian
- 70.1%Lithuanian
- 70.1%Slovak
Zip codes: 06417.