Races in Deer Park, Texas (TX) Detailed Stats
Data:
Races - White alone (%)
Races - White alone (% change since 2000)
Races - Black alone (%)
Races - Black alone (% change since 2000)
Races - American Indian alone (%)
Races - American Indian alone (% change since 2000)
Races - Asian alone (%)
Races - Asian alone (% change since 2000)
Races - Hispanic (%)
Races - Hispanic (% change since 2000)
Races - Native Hawaiian and Other Pacific Islander alone (%)
Races - Native Hawaiian and Other Pacific Islander alone (% change since 2000)
Races - Two or more races(%)
Races - Two or more races(% change since 2000)
Races - Other race alone (%)
Races - Other race alone (% change since 2000)
Racial diversity
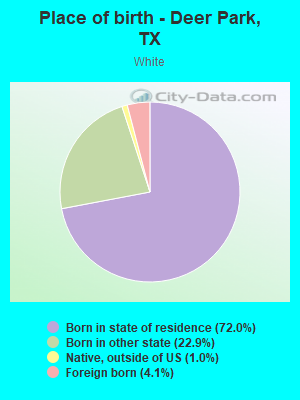
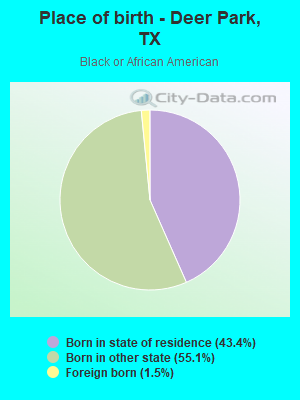
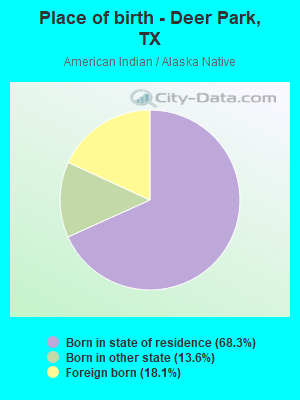
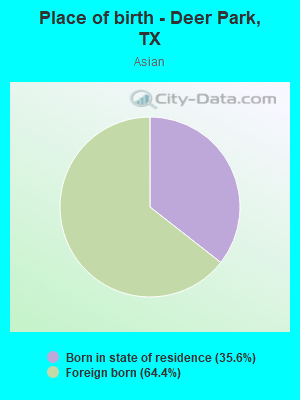
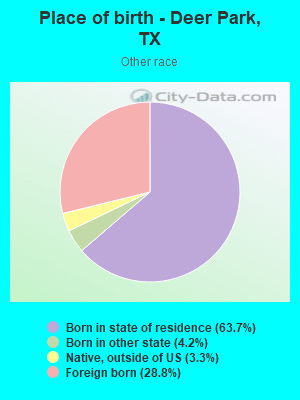
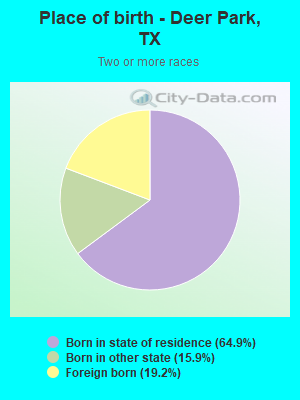
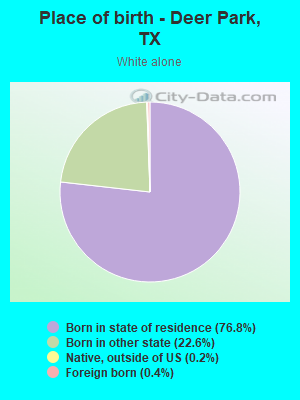
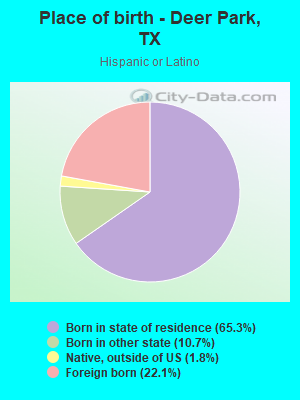
Place of birth - Born in state of residence (%)
Place of birth - Born in state of residence (%) - White
Place of birth - Born in state of residence (%) - Black or African American
Place of birth - Born in state of residence (%) - Asian
Place of birth - Born in state of residence (%) - Hispanic or Latino
Place of birth - Born in state of residence (%) - American Indian and Alaska Native
Place of birth - Born in state of residence (%) - Multirace
Place of birth - Born in state of residence (%) - Other Race
Place of birth - Born in other state (%)
Place of birth - Born in other state (%) - White
Place of birth - Born in other state (%) - Black or African American
Place of birth - Born in other state (%) - Asian
Place of birth - Born in other state (%) - Hispanic or Latino
Place of birth - Born in other state (%) - American Indian and Alaska Native
Place of birth - Born in other state (%) - Multirace
Place of birth - Born in other state (%) - Other Race
Place of birth - Native, outside of US (%)
Place of birth - Native, outside of US (%) - White
Place of birth - Native, outside of US (%) - Black or African American
Place of birth - Native, outside of US (%) - Asian
Place of birth - Native, outside of US (%) - Hispanic or Latino
Place of birth - Native, outside of US (%) - American Indian and Alaska Native
Place of birth - Native, outside of US (%) - Multirace
Place of birth - Native, outside of US (%) - Other Race
Place of birth - Foreign born (%)
Place of birth - Foreign born (%) - White
Place of birth - Foreign born (%) - Black or African American
Place of birth - Foreign born (%) - Asian
Place of birth - Foreign born (%) - Hispanic or Latino
Place of birth - Foreign born (%) - American Indian and Alaska Native
Place of birth - Foreign born (%) - Multirace
Place of birth - Foreign born (%) - Other Race
Residents speaking English at home (%)
Residents speaking English at home - Born in the United States (%)
Residents speaking English at home - Native, born elsewhere (%)
Residents speaking English at home - Foreign born (%)
Residents speaking Spanish at home (%)
Residents speaking Spanish at home - Born in the United States (%)
Residents speaking Spanish at home - Native, born elsewhere (%)
Residents speaking Spanish at home - Foreign born (%)
Residents speaking other language at home (%)
Residents speaking other language at home - Born in the United States (%)
Residents speaking other language at home - Native, born elsewhere (%)
Residents speaking other language at home - Foreign born (%)
Marital status - Never married (%)
Marital status - Now married (%)
Marital status - Separated (%)
Marital status - Widowed (%)
Marital status - Divorced (%)
Ancestries Reported - Arab (%)
Ancestries Reported - Czech (%)
Ancestries Reported - Danish (%)
Ancestries Reported - Dutch (%)
Ancestries Reported - English (%)
Ancestries Reported - French (%)
Ancestries Reported - French Canadian (%)
Ancestries Reported - German (%)
Ancestries Reported - Greek (%)
Ancestries Reported - Hungarian (%)
Ancestries Reported - Irish (%)
Ancestries Reported - Italian (%)
Ancestries Reported - Lithuanian (%)
Ancestries Reported - Norwegian (%)
Ancestries Reported - Polish (%)
Ancestries Reported - Portuguese (%)
Ancestries Reported - Russian (%)
Ancestries Reported - Scotch-Irish (%)
Ancestries Reported - Scottish (%)
Ancestries Reported - Slovak (%)
Ancestries Reported - Subsaharan African (%)
Ancestries Reported - Swedish (%)
Ancestries Reported - Swiss (%)
Ancestries Reported - Ukrainian (%)
Ancestries Reported - United States (%)
Ancestries Reported - Welsh (%)
Ancestries Reported - West Indian (%)
Ancestries Reported - Other (%)
Geographical mobility - Same house 1 year ago (%)
Geographical mobility - Same house 1 year ago (%) - White
Geographical mobility - Same house 1 year ago (%) - Black or African American
Geographical mobility - Same house 1 year ago (%) - Asian
Geographical mobility - Same house 1 year ago (%) - Hispanic or Latino
Geographical mobility - Same house 1 year ago (%) - American Indian and Alaska Native
Geographical mobility - Same house 1 year ago (%) - Multirace
Geographical mobility - Same house 1 year ago (%) - Other Race
Geographical mobility - Moved within same county (%)
Geographical mobility - Moved within same county (%) - White
Geographical mobility - Moved within same county (%) - Black or African American
Geographical mobility - Moved within same county (%) - Asian
Geographical mobility - Moved within same county (%) - Hispanic or Latino
Geographical mobility - Moved within same county (%) - American Indian and Alaska Native
Geographical mobility - Moved within same county (%) - Multirace
Geographical mobility - Moved within same county (%) - Other Race
Geographical mobility - Moved from different county within same state (%)
Geographical mobility - Moved from different county within same state (%) - White
Geographical mobility - Moved from different county within same state (%) - Black or African American
Geographical mobility - Moved from different county within same state (%) - Asian
Geographical mobility - Moved from different county within same state (%) - Hispanic or Latino
Geographical mobility - Moved from different county within same state (%) - American Indian and Alaska Native
Geographical mobility - Moved from different county within same state (%) - Multirace
Geographical mobility - Moved from different county within same state (%) - Other Race
Geographical mobility - Moved from different state (%)
Geographical mobility - Moved from different state (%) - White
Geographical mobility - Moved from different state (%) - Black or African American
Geographical mobility - Moved from different state (%) - Asian
Geographical mobility - Moved from different state (%) - Hispanic or Latino
Geographical mobility - Moved from different state (%) - American Indian and Alaska Native
Geographical mobility - Moved from different state (%) - Multirace
Geographical mobility - Moved from different state (%) - Other Race
Geographical mobility - Moved from abroad (%)
Geographical mobility - Moved from abroad (%) - White
Geographical mobility - Moved from abroad (%) - Black or African American
Geographical mobility - Moved from abroad (%) - Asian
Geographical mobility - Moved from abroad (%) - Hispanic or Latino
Geographical mobility - Moved from abroad (%) - American Indian and Alaska Native
Geographical mobility - Moved from abroad (%) - Multirace
Geographical mobility - Moved from abroad (%) - Other Race
Place of birth for the foreign-born population - Ireland (%)
Place of birth for the foreign-born population - Denmark (%)
Place of birth for the foreign-born population - Norway (%)
Place of birth for the foreign-born population - Sweden (%)
Place of birth for the foreign-born population - United Kingdom (%)
Place of birth for the foreign-born population - England (%)
Place of birth for the foreign-born population - Scotland (%)
Place of birth for the foreign-born population - Other Northern Europe (%)
Place of birth for the foreign-born population - Austria (%)
Place of birth for the foreign-born population - Belgium (%)
Place of birth for the foreign-born population - France (%)
Place of birth for the foreign-born population - Germany (%)
Place of birth for the foreign-born population - Netherlands (%)
Place of birth for the foreign-born population - Switzerland (%)
Place of birth for the foreign-born population - Other Western Europe (%)
Place of birth for the foreign-born population - Greece (%)
Place of birth for the foreign-born population - Italy (%)
Place of birth for the foreign-born population - Portugal (%)
Place of birth for the foreign-born population - Spain (%)
Place of birth for the foreign-born population - Other Southern Europe (%)
Place of birth for the foreign-born population - Albania (%)
Place of birth for the foreign-born population - Belarus (%)
Place of birth for the foreign-born population - Bosnia and Herzegovina (%)
Place of birth for the foreign-born population - Bulgaria (%)
Place of birth for the foreign-born population - Croatia (%)
Place of birth for the foreign-born population - Czechoslovakia (%)
Place of birth for the foreign-born population - Hungary (%)
Place of birth for the foreign-born population - Latvia (%)
Place of birth for the foreign-born population - Lithuania (%)
Place of birth for the foreign-born population - North Macedonia (Macedonia) (%)
Place of birth for the foreign-born population - Moldova (%)
Place of birth for the foreign-born population - Poland (%)
Place of birth for the foreign-born population - Romania (%)
Place of birth for the foreign-born population - Russia (%)
Place of birth for the foreign-born population - Serbia (%)
Place of birth for the foreign-born population - Ukraine (%)
Place of birth for the foreign-born population - Other Eastern Europe (%)
Place of birth for the foreign-born population - China (%)
Place of birth for the foreign-born population - Hong Kong (%)
Place of birth for the foreign-born population - Taiwan (%)
Place of birth for the foreign-born population - Japan (%)
Place of birth for the foreign-born population - Korea (%)
Place of birth for the foreign-born population - Other Eastern Asia (%)
Place of birth for the foreign-born population - Afghanistan (%)
Place of birth for the foreign-born population - Bangladesh (%)
Place of birth for the foreign-born population - India (%)
Place of birth for the foreign-born population - Iran (%)
Place of birth for the foreign-born population - Kazakhstan (%)
Place of birth for the foreign-born population - Nepal (%)
Place of birth for the foreign-born population - Pakistan (%)
Place of birth for the foreign-born population - Sri Lanka (%)
Place of birth for the foreign-born population - Uzbekistan (%)
Place of birth for the foreign-born population - Other South Central Asia (%)
Place of birth for the foreign-born population - Burma (%)
Place of birth for the foreign-born population - Cambodia (%)
Place of birth for the foreign-born population - Indonesia (%)
Place of birth for the foreign-born population - Laos (%)
Place of birth for the foreign-born population - Malaysia (%)
Place of birth for the foreign-born population - Philippines (%)
Place of birth for the foreign-born population - Singapore (%)
Place of birth for the foreign-born population - Thailand (%)
Place of birth for the foreign-born population - Vietnam (%)
Place of birth for the foreign-born population - Other South Eastern Asia (%)
Place of birth for the foreign-born population - Armenia (%)
Place of birth for the foreign-born population - Iraq (%)
Place of birth for the foreign-born population - Israel (%)
Place of birth for the foreign-born population - Jordan (%)
Place of birth for the foreign-born population - Kuwait (%)
Place of birth for the foreign-born population - Lebanon (%)
Place of birth for the foreign-born population - Saudi Arabia (%)
Place of birth for the foreign-born population - Syria (%)
Place of birth for the foreign-born population - Turkey (%)
Place of birth for the foreign-born population - Yemen (%)
Place of birth for the foreign-born population - Other Western Asia (%)
Place of birth for the foreign-born population - Eritrea (%)
Place of birth for the foreign-born population - Ethiopia (%)
Place of birth for the foreign-born population - Kenya (%)
Place of birth for the foreign-born population - Somalia (%)
Place of birth for the foreign-born population - Uganda (%)
Place of birth for the foreign-born population - Zimbabwe (%)
Place of birth for the foreign-born population - Other Eastern Africa (%)
Place of birth for the foreign-born population - Cameroon (%)
Place of birth for the foreign-born population - Congo (%)
Place of birth for the foreign-born population - Democratic Republic of Congo (Zaire) (%)
Place of birth for the foreign-born population - Other Middle Africa (%)
Place of birth for the foreign-born population - Egypt (%)
Place of birth for the foreign-born population - Morocco (%)
Place of birth for the foreign-born population - Sudan (%)
Place of birth for the foreign-born population - Other Northern Africa (%)
Place of birth for the foreign-born population - South Africa (%)
Place of birth for the foreign-born population - Other Southern Africa (%)
Place of birth for the foreign-born population - Cabo Verde (%)
Place of birth for the foreign-born population - Ghana (%)
Place of birth for the foreign-born population - Liberia (%)
Place of birth for the foreign-born population - Nigeria (%)
Place of birth for the foreign-born population - Senegal (%)
Place of birth for the foreign-born population - Sierra Leone (%)
Place of birth for the foreign-born population - Other Western Africa (%)
Place of birth for the foreign-born population - Australia (%)
Place of birth for the foreign-born population - New Zealand (%)
Place of birth for the foreign-born population - Fiji (%)
Place of birth for the foreign-born population - Micronesia (%)
Place of birth for the foreign-born population - Bahamas (%)
Place of birth for the foreign-born population - Barbados (%)
Place of birth for the foreign-born population - Cuba (%)
Place of birth for the foreign-born population - Dominica (%)
Place of birth for the foreign-born population - Dominican Republic (%)
Place of birth for the foreign-born population - Grenada (%)
Place of birth for the foreign-born population - Haiti (%)
Place of birth for the foreign-born population - Jamaica (%)
Place of birth for the foreign-born population - St. Vincent and the Grenadines (%)
Place of birth for the foreign-born population - Trinidad and Tobago (%)
Place of birth for the foreign-born population - West Indies (%)
Place of birth for the foreign-born population - Other Caribbean (%)
Place of birth for the foreign-born population - Belize (%)
Place of birth for the foreign-born population - Costa Rica (%)
Place of birth for the foreign-born population - El Salvador (%)
Place of birth for the foreign-born population - Guatemala (%)
Place of birth for the foreign-born population - Honduras (%)
Place of birth for the foreign-born population - Mexico (%)
Place of birth for the foreign-born population - Nicaragua (%)
Place of birth for the foreign-born population - Panama (%)
Place of birth for the foreign-born population - Other Central America (%)
Place of birth for the foreign-born population - Argentina (%)
Place of birth for the foreign-born population - Bolivia (%)
Place of birth for the foreign-born population - Brazil (%)
Place of birth for the foreign-born population - Chile (%)
Place of birth for the foreign-born population - Colombia (%)
Place of birth for the foreign-born population - Ecuador (%)
Place of birth for the foreign-born population - Guyana (%)
Place of birth for the foreign-born population - Peru (%)
Place of birth for the foreign-born population - Uruguay (%)
Place of birth for the foreign-born population - Venezuela (%)
Place of birth for the foreign-born population - Other South America (%)
Place of birth for the foreign-born population - Canada (%)
Place of birth for the foreign-born population - Other Northern America (%)
Place of birth for the foreign-born population - Other (%)
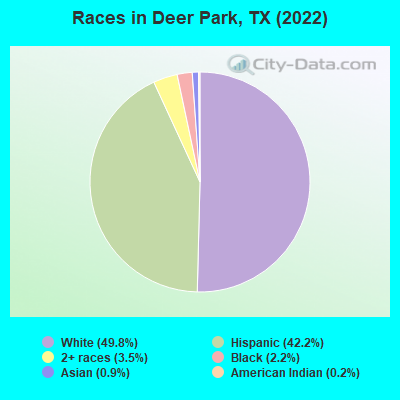
According to 2022 data, the most numerous races in Deer Park, TX are Hispanic (14,539 residents), White alone (17,166 residents), and Black alone (742 residents). 76.5% of Deer Park residents speak English at home. 10.5% of Deer Park, TX residents are foreign-born (9.3% born in Latin America), which is 61.8% less than the foreign-born rate of 17.0% across the entire state of Texas.
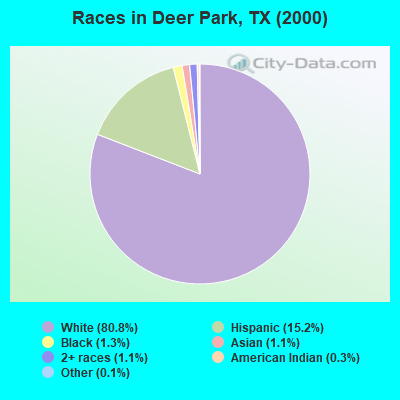
Race distribution in Deer Park
2000 2022
10,933,313 52.4% White alone 6,669,666 32.0% Hispanic 2,364,255 11.3% Black alone 554,445 2.7% Asian alone 230,567 1.1% Two or more races 68,859 0.3% American Indian alone 19,958 0.10% Other race alone 10,757 0.05% Native Hawaiian and Other
12,070,642 40.2% Hispanic 11,683,430 38.9% White alone 3,508,706 11.7% Black alone 1,608,173 5.4% Asian alone 956,560 3.2% Two or more races 125,763 0.4% Other race alone 47,023 0.2% American Indian alone 29,275 0.10% Native Hawaiian and Other
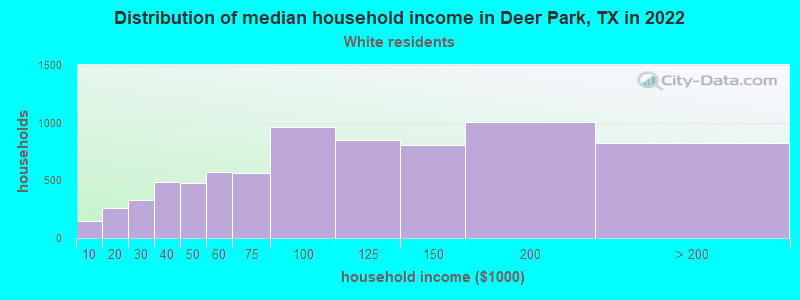
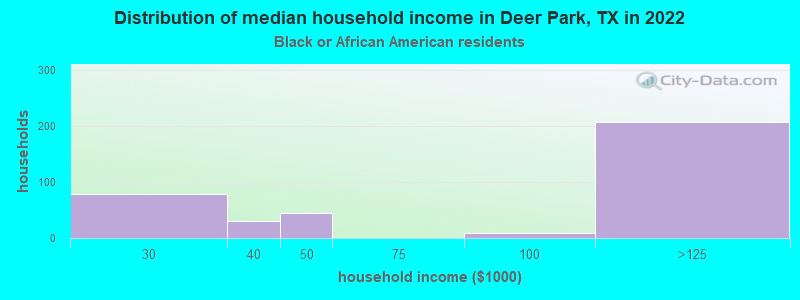
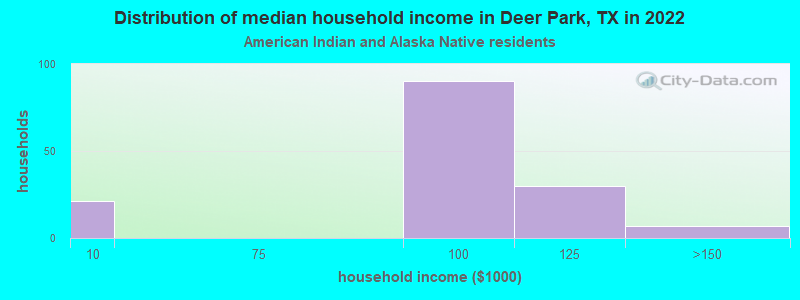
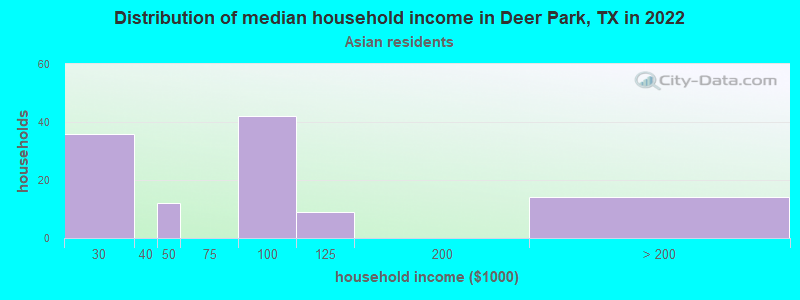
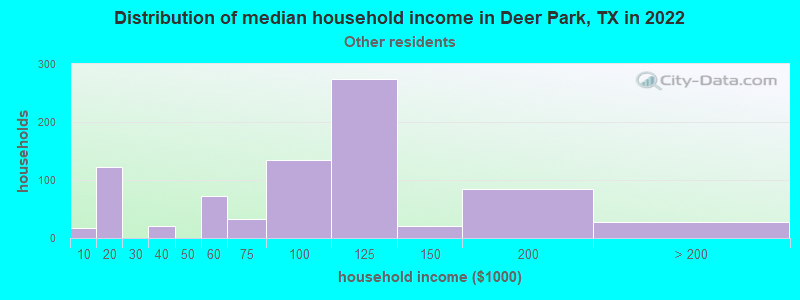
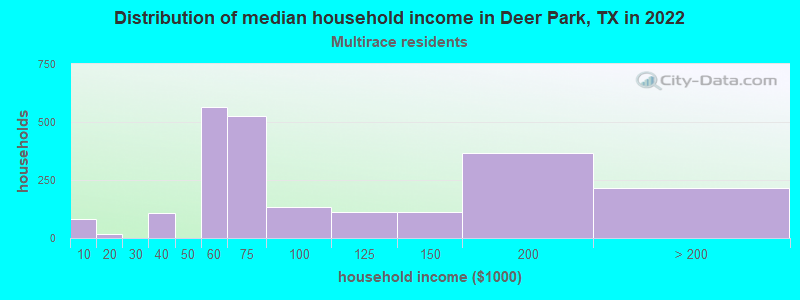
Income and house value in Deer Park Median household income in 2022 $86,785 White non-Hispanic householders$90,849 American Indian and Alaska Native householders$80,139 Asian householders$101,569 Some other race householders$67,246 Two or more races householders$85,181 Hispanic or Latino race householdersMedian 2022 house value $256,565 White Non-Hispanic householders$158,122 Black or African American householders$216,128 American Indian or Alaska Native householders $260,470 Asian householders$226,168 Some other race householders$247,084 Two or more races householders$226,447 Hispanic or Latino householders
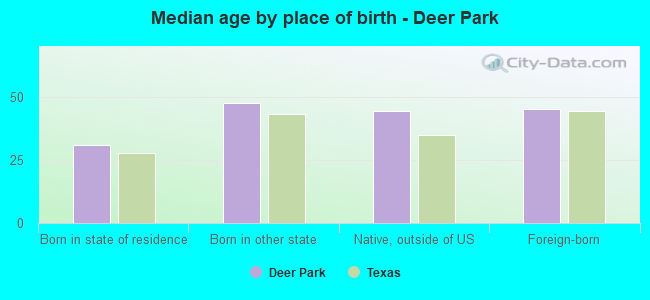
Median age by race in Deer Park
40.7 Median age for White residents39.1 43.0 31.3 Median age for Black or African American residents82.9 24.2 28.6 Median age for American Indian / Alaska Native residents28.7 15.6 39.1 Median age for Asian residents16.2 39.6 -782,795,698.1 Median age for Native Hawaiian / Pacific Islander residents-633,771,929.2 -816,367,264.7 35.3 Median age for Other race residents32.8 40.5 33.7 Median age for Two or more races residents35.1 29.2 45.6 Median age for White alone residents43.2 47.0 29.4 Median age for Hispanic or Latino residents30.0 27.7
Owner/renter occupied households by race in Deer Park
House owners and renters - White residents 5,743 77.6% Owner occupied1,657 22.4% Renter occupiedHouse owners and renters - Black or African American residents 265 69.3% Owner occupied118 30.7% Renter occupiedHouse owners and renters - American Indian / Alaska Native residents 198 100.0% Owner occupiedHouse owners and renters - Asian residents 75 72.1% Owner occupied29 27.9% Renter occupiedHouse owners and renters - Other race residents 512 60.9% Owner occupied329 39.1% Renter occupiedHouse owners and renters - Two or more races residents 1,817 82.8% Owner occupied376 17.2% Renter occupiedHouse owners and renters - White alone residents 5,822 83.4% Owner occupied1,160 16.6% Renter occupiedHouse owners and renters - Hispanic or Latino residents 2,602 63.9% Owner occupied1,468 36.1% Renter occupied
Language usage in Deer Park
English speakers - Total 76.5% of residents of Deer Park speak English at home.
21.8% of residents speak Spanish at home 4,607 65.4% Speak English very well2,437 34.6% Speak English less than very well1.1% of residents speak other language at home 208 60.1% Speak English very well138 39.9% Speak English less than very well
English speakers - Born in the United States 93.5% of residents of Deer Park speak English at home.
5.9% of residents speak Spanish at home 312 85.2% Speak English very well54 14.8% Speak English less than very well0.2% of residents speak other language at home 14 100.0% Speak English less than very well
English speakers - Native, born elsewhere 38.4% of residents of Deer Park speak English at home.
56.4% of residents speak Spanish at home 105 60.7% Speak English very well68 39.3% Speak English less than very well2.3% of residents speak other language at home 7 100.0% Speak English very well
English speakers - Foreign-born 12.0% of residents of Deer Park speak English at home.
82.2% of residents speak Spanish at home 857 30.5% Speak English very well1,957 69.5% Speak English less than very well6.9% of residents speak other language at home 115 48.5% Speak English very well122 51.5% Speak English less than very well
White (Caucasian) - Speak only English Native:
100.0% (18,336)Foreign-born:
16.9% (118)
White (Caucasian) - Speak another language Native:
5.3% (969)Foreign-born:
79.3% (553)
American Indian / Alaska Native - Speak another language Native:
94.4% (454)Foreign-born:
98.9% (133)
Asian - Speak only English Native:
57.5% (71)Foreign-born:
21.0% (46)
Asian - Speak another language Native:
42.7% (53)Foreign-born:
79.1% (174)
Other race - Speak only English Native:
37.9% (689)Foreign-born:
13.2% (107)
Other race - Speak another language Native:
63.0% (1,146)Foreign-born:
86.0% (697)
Two or more races - Speak only English Native:
62.5% (3,538)Foreign-born:
14.3% (209)
Two or more races - Speak another language Native:
34.6% (1,958)Foreign-born:
85.6% (1,252)
White alone - Speak only English Native:
98.4% (16,143)Foreign-born:
74.2% (50)
White alone - Speak another language Native:
1.5% (248)Foreign-born:
28.0% (19)
Hispanic or Latino - Speak only English Native:
59.7% (6,154)Foreign-born:
6.6% (198)
Hispanic or Latino - Speak another language Native:
39.4% (4,068)Foreign-born:
93.5% (2,796)
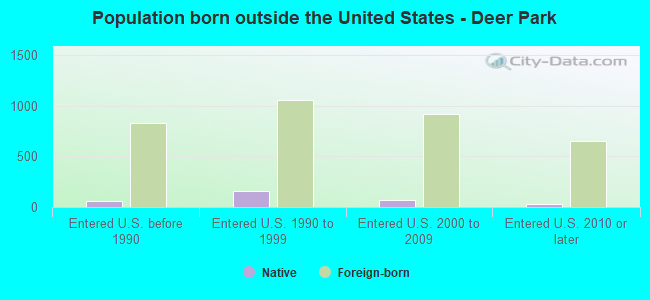
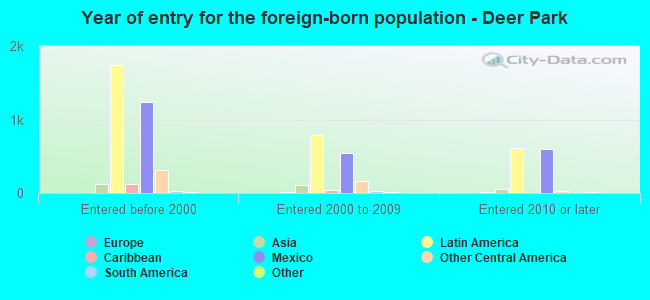
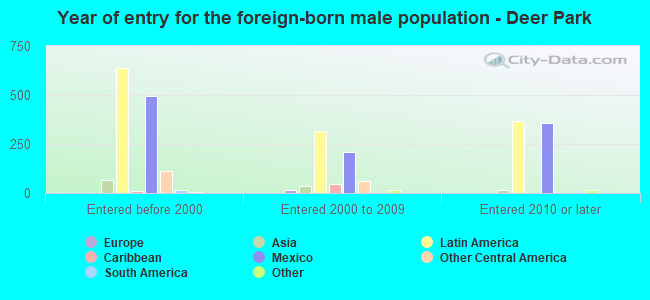
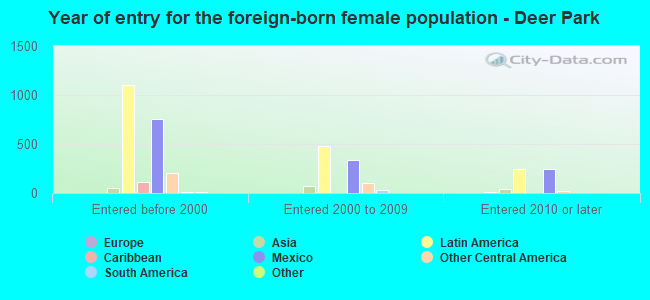
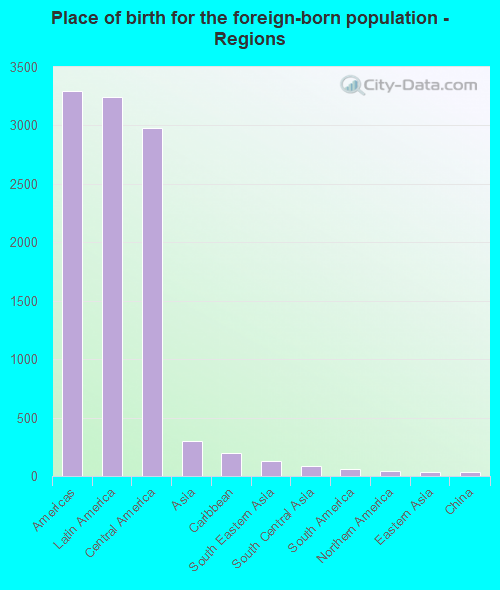
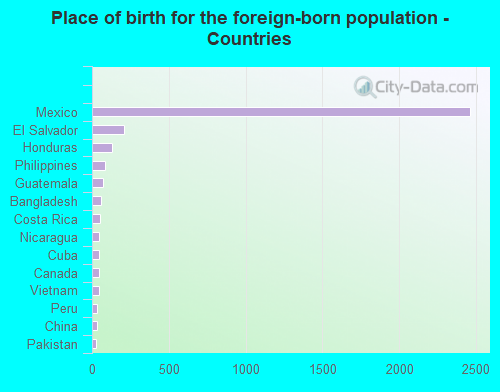
Foreign-born residents in Deer Park 3,619 residents are foreign born (9.3% Latin America ).
This city:
10.5%Texas:
17.1%
Marital status for residents in Deer Park Marital status - White (Caucasian) population 15 years and over
Males 28.0% Never married60.3% Now married0.9% Separated3.1% Widowed7.7% DivorcedFemales 26.6% Never married48.9% Now married2.9% Separated9.3% Widowed12.4% DivorcedWomen who gave birth in the past 12 months Now married:
64.6% (66)Unmarried:
35.4% (36)
Women who did not give birth in the past 12 months Now married:
47.8% (2,096)Unmarried:
52.2% (2,286)
Marital status - Black or African American population 15 years and over
Males 17.6% Never married82.4% Now married0.0% Separated0.0% Widowed0.0% DivorcedFemales 20.9% Never married64.0% Now married0.0% Separated15.1% Widowed0.0% DivorcedWomen who did not give birth in the past 12 months Now married:
79.3% (235)Unmarried:
20.7% (61)
Marital status - American Indian / Alaska Native population 15 years and over
Males 30.6% Never married37.1% Now married4.7% Separated0.0% Widowed27.6% DivorcedFemales 14.1% Never married63.6% Now married22.2% Separated0.0% Widowed0.0% DivorcedWomen who did not give birth in the past 12 months Now married:
85.9% (156)Unmarried:
14.1% (26)
Marital status - Asian population 15 years and over
Males 31.7% Never married68.3% Now married0.0% Separated0.0% Widowed0.0% DivorcedFemales 16.0% Never married69.3% Now married9.3% Separated0.0% Widowed5.3% DivorcedWomen who did not give birth in the past 12 months Now married:
72.7% (65)Unmarried:
27.3% (24)
Marital status - Other race population 15 years and over
Males 25.7% Never married70.3% Now married0.3% Separated0.0% Widowed3.8% DivorcedFemales 39.0% Never married50.9% Now married1.7% Separated4.3% Widowed4.1% DivorcedWomen who gave birth in the past 12 months Now married:
22.8% (26)Unmarried:
77.2% (88)
Women who did not give birth in the past 12 months Now married:
56.3% (414)Unmarried:
43.7% (322)
Marital status - Two or more races population 15 years and over
Males 30.7% Never married48.0% Now married9.5% Separated11.2% Widowed0.6% DivorcedFemales 30.4% Never married61.3% Now married1.6% Separated1.0% Widowed5.7% DivorcedWomen who gave birth in the past 12 months Now married:
100.0% (74)Unmarried:
0.0% (0)
Women who did not give birth in the past 12 months Now married:
48.2% (802)Unmarried:
51.8% (863)
Marital status - White alone, not Hispanic / Latino population 15 years and over
Males 28.2% Never married58.1% Now married0.7% Separated3.9% Widowed9.0% DivorcedFemales 23.8% Never married47.1% Now married2.4% Separated11.6% Widowed15.2% DivorcedWomen who gave birth in the past 12 months Now married:
64.6% (89)Unmarried:
35.4% (49)
Women who did not give birth in the past 12 months Now married:
43.0% (1,657)Unmarried:
57.0% (2,195)
Marital status - Hispanic or Latino population 15 years and over
Males 27.5% Never married60.6% Now married4.8% Separated5.0% Widowed2.1% DivorcedFemales 34.6% Never married55.4% Now married3.6% Separated2.0% Widowed4.4% DivorcedWomen who gave birth in the past 12 months Now married:
52.7% (70)Unmarried:
47.3% (63)
Women who did not give birth in the past 12 months Now married:
54.8% (2,142)Unmarried:
45.2% (1,766)
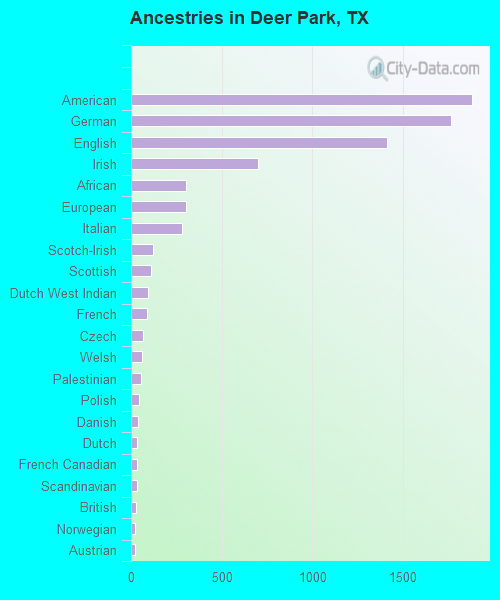
Ancestries in Deer Park
1,881 9.8% American1,763 9.2% German1,414 7.4% English698 3.7% Irish305 1.6% African304 1.6% European280 1.5% Italian121 0.6% Scotch-Irish110 0.6% Scottish93 0.5% Dutch West Indian90 0.5% French64 0.3% Czech60 0.3% Welsh55 0.3% Palestinian44 0.2% Polish41 0.2% Danish31 0.2% Dutch31 0.2% French Canadian31 0.2% Scandinavian29 0.2% British24 0.1% Norwegian22 0.1% Austrian14 0.07% Hungarian8 0.04% Cajun8 0.04% Czechoslovakian7 0.04% Canadian
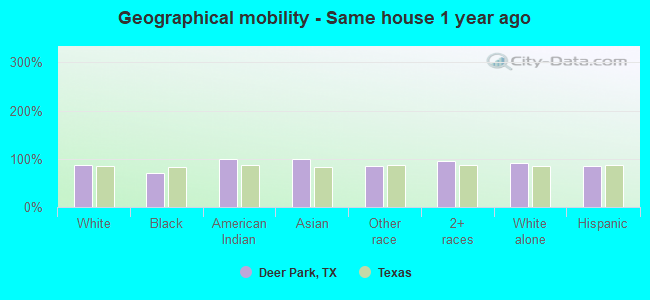
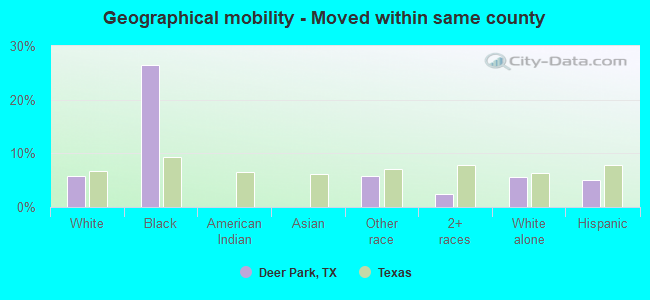
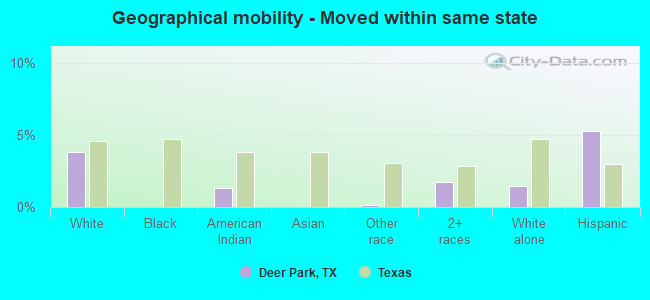
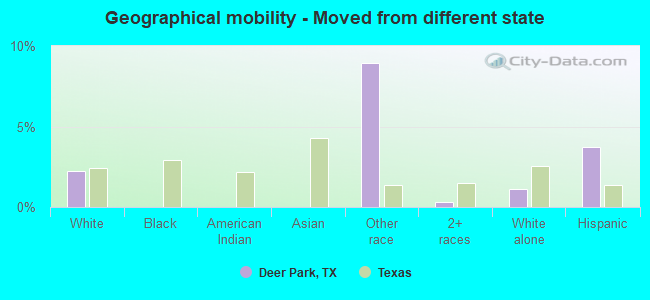
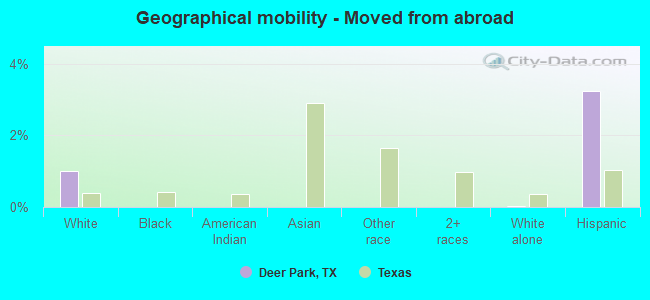
Geographical mobility in Deer Park Same house 1 year ago 16,256 87.5% White (Caucasian)521 70.1% Black or African American829 99.7% American Indian / Alaska Native338 99.0% Asian2,317 84.8% Other race7,274 96.3% Two or more races15,719 91.9% White alone, not Hispanic / Latino12,204 84.9% Hispanic or LatinoMoved within same county 1,071 5.8% White / Caucasian197 26.5% Black or African American159 5.8% Other race178 2.4% Two or more races967 5.7% White alone, not Hispanic / Latino718 5.0% Hispanic or LatinoMoved within same state 708 3.8% White / Caucasian11 1.3% American Indian / Alaska Native3 0.1% Other race129 1.7% Two or more races251 1.5% White alone, not Hispanic / Latino759 5.3% Hispanic or LatinoMoved from different state 415 2.2% White / Caucasian244 8.9% Other race25 0.3% Two or more races195 1.1% White alone, not Hispanic / Latino533 3.7% Hispanic or LatinoMoved from abroad 187 1.0% White5 0.0% White alone, not Hispanic / Latino467 3.2% Hispanic or Latino
Children Nativity (place of birth) in Deer Park
Children under 6 years - Living with two parents Both parents native 1,171 100.0% NativeBoth parents foreign-born 98 100.0% NativeOne native, one foreign-born parent 139 100.0% NativeChildren under 6 years - Living with one parent Native parent 725 99.2% Native6 0.8% Foreign-bornForeign-born parent 90 32.3% Native189 67.7% Foreign-bornChildren 6 to 17 years - Living with two parents Both parents native 2,874 99.0% Native28 1.0% Foreign-bornBoth parents foreign-born 726 99.0% Native7 1.0% Foreign-bornOne native, one foreign-born parent 359 100.0% NativeChildren 6 to 17 years - Living with one parent Native parent 1,007 100.0% NativeForeign-born parent 549 53.9% Native470 46.1% Foreign-born
Grandparents responsible for own grandchildren in Deer Park
Grandparents (30 to 59 years) White / Caucasian 171 66.0% Responsible for grandchildren88 34.0% Not responsible for grandchildrenOther race 27 100.0% Responsible for grandchildrenTwo or more races 129 100.0% Not responsible for grandchildrenWhite alone, not Hispanic / Latino 140 55.5% Responsible for grandchildren112 44.5% Not responsible for grandchildrenHispanic or Latino 160 51.3% Responsible for grandchildren152 48.7% Not responsible for grandchildrenGrandparents (60 years and over) White / Caucasian 79 27.4% Responsible for grandchildren208 72.6% Not responsible for grandchildrenOther race 23 100.0% Not responsible for grandchildrenTwo or more races 44 100.0% Not responsible for grandchildrenWhite alone, not Hispanic / Latino 90 19.8% Responsible for grandchildren362 80.2% Not responsible for grandchildrenHispanic or Latino 25 37.9% Responsible for grandchildren41 62.1% Not responsible for grandchildren