Races in Deerpark, New York (NY) Detailed Stats
Ancestries, Foreign-born residents, place of birth
3.0% of Deerpark, NY residents are foreign-born (1.6% born in Europe, 1.1% born in Latin America), which is 638.8% less than the foreign-born rate of 22.0% across the entire state of New York.
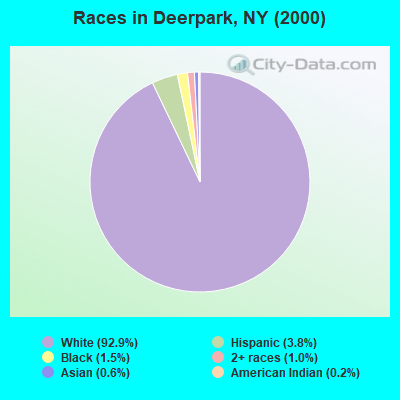
Race distribution in Deerpark

- 7,29792.9%White alone
- 3003.8%Hispanic
- 1171.5%Black alone
- 761.0%Two or more races
- 450.6%Asian alone
- 180.2%American Indian alone
- 50.06%Other race alone
2000
2022
-
- 11,760,98162.0%White alone
- 2,867,58315.1%Hispanic
- 2,812,62314.8%Black alone
- 1,035,9265.5%Asian alone
- 366,1161.9%Two or more races
- 75,4990.4%Other race alone
- 52,4990.3%American Indian alone
- 5,2300.03%Native Hawaiian and Other
Pacific Islander alone

-
- 10,408,93352.9%White alone
- 3,867,29919.7%Hispanic
- 2,633,84013.4%Black alone
- 1,776,2869.0%Asian alone
- 732,6703.7%Two or more races
- 216,1101.1%Other race alone
- 35,0820.2%American Indian alone
- 6,9310.04%Native Hawaiian and Other
Pacific Islander alone

Income and house value in Deerpark
- Median household income in 2022
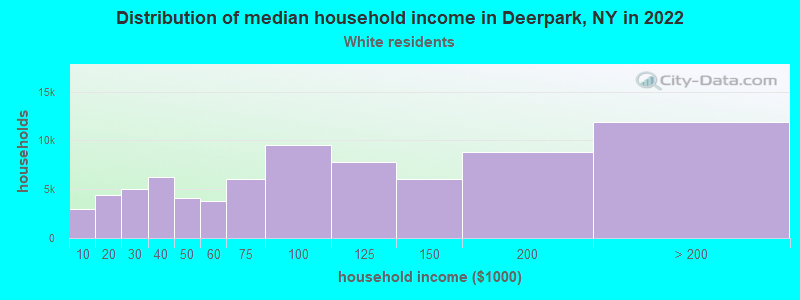
- $73,288White non-Hispanic householders
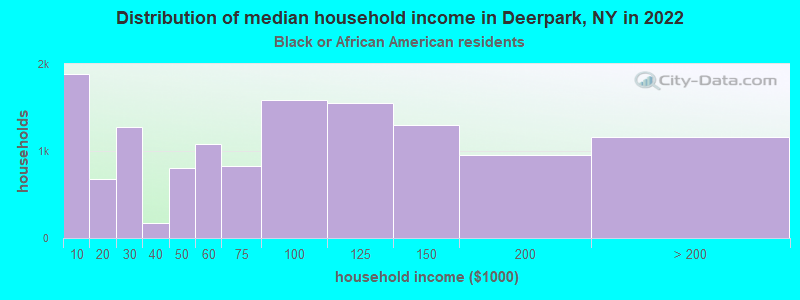
- $58,045Black householders
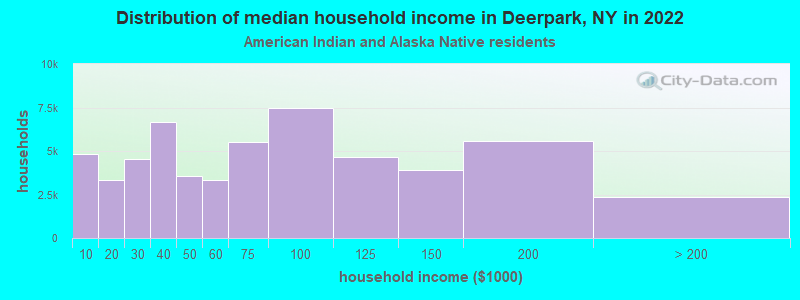
- over $200,000American Indian and Alaska Native householders
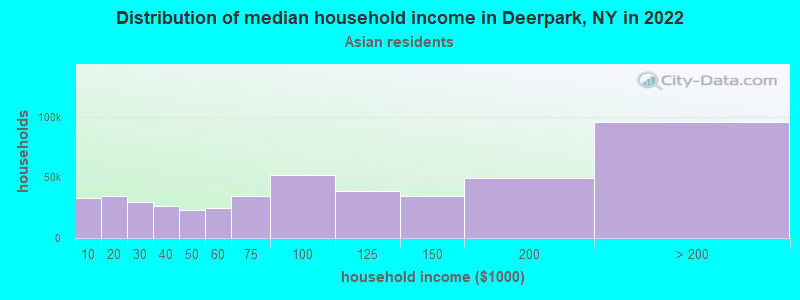
- $101,894Asian householders
- $91,571Some other race householders
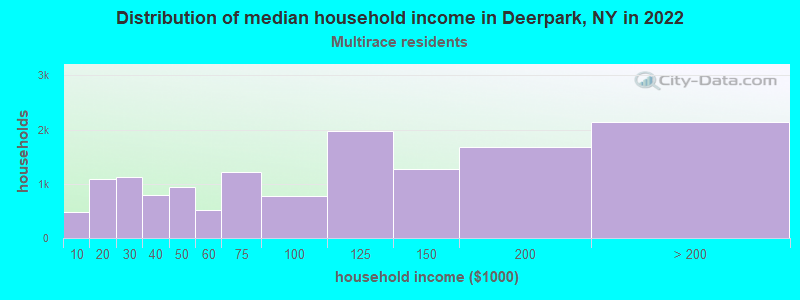
- $102,297Two or more races householders
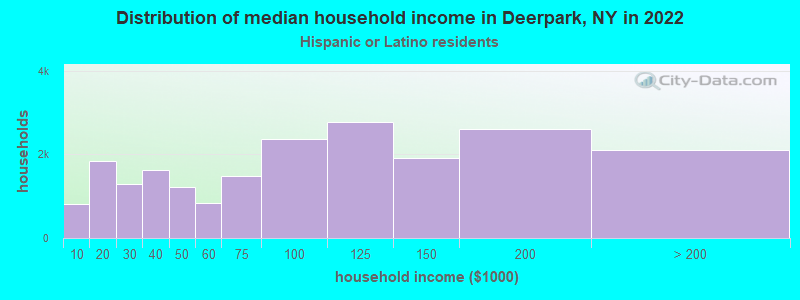
- $75,038Hispanic or Latino race householders
- Median 2022 house value
- $273,119White Non-Hispanic householders
- $295,441Black or African American householders
- $249,484American Indian or Alaska Native householders
- $295,441Asian householders
- $189,345Some other race householders
- $150,478Two or more races householders
- $226,899Hispanic or Latino householders
Household income for White non-Hispanic householders
Household income for Black householders
Household income for American Indian and Alaska Native householders
Household income for Asian householders
Household income for Two or more races householders
Household income for Hispanic or Latino race householders
Foreign-born residents in Deerpark
234 residents are foreign born (1.6% Europe, 1.1% Latin America).
| This city: | 3.0% |
| New York: | 20.4% |
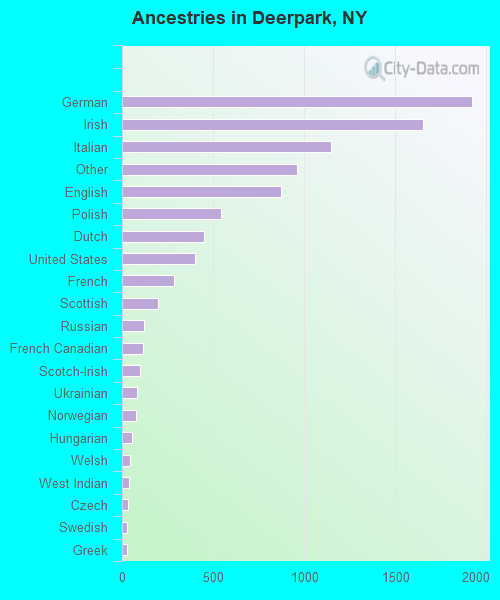
Ancestries in Deerpark

- 1,91920.9%German
- 1,65218.0%Irish
- 1,14912.5%Italian
- 95910.4%Other
- 8749.5%English
- 5425.9%Polish
- 4494.9%Dutch
- 4034.4%United States
- 2863.1%French
- 1972.1%Scottish
- 1191.3%Russian
- 1151.3%French Canadian
- 971.1%Scotch-Irish
- 830.9%Ukrainian
- 760.8%Norwegian
- 570.6%Hungarian
- 420.5%Welsh
- 410.4%West Indian
- 320.3%Czech
- 270.3%Swedish
- 250.3%Greek
- 160.2%Swiss
- 150.2%Portuguese
- 90.10%Lithuanian
Zip codes: 12746.