Races in Delray Beach, Florida (FL) Detailed Stats
Data:
Races - White alone (%)
Races - White alone (% change since 2000)
Races - Black alone (%)
Races - Black alone (% change since 2000)
Races - American Indian alone (%)
Races - American Indian alone (% change since 2000)
Races - Asian alone (%)
Races - Asian alone (% change since 2000)
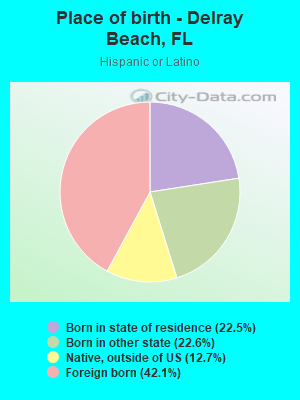
Races - Hispanic (%)
Races - Hispanic (% change since 2000)
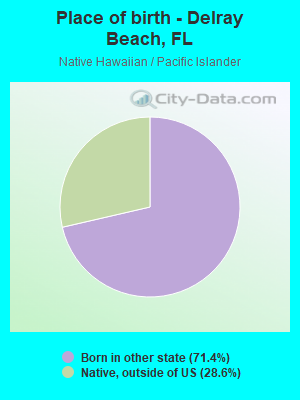
Races - Native Hawaiian and Other Pacific Islander alone (%)
Races - Native Hawaiian and Other Pacific Islander alone (% change since 2000)
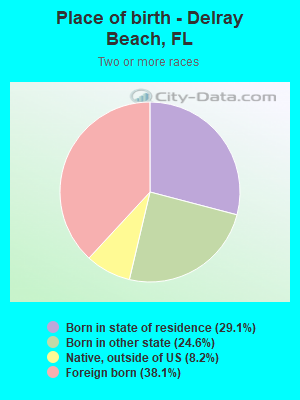
Races - Two or more races(%)
Races - Two or more races(% change since 2000)
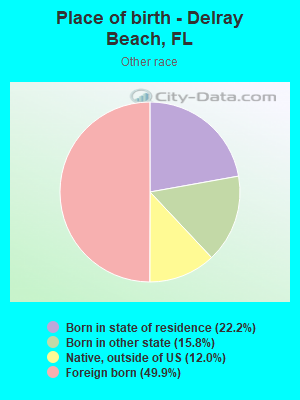
Races - Other race alone (%)
Races - Other race alone (% change since 2000)
Racial diversity
Place of birth - Born in state of residence (%)
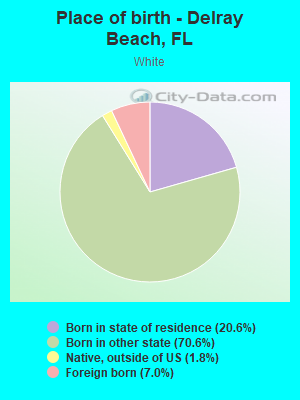
Place of birth - Born in state of residence (%) - White
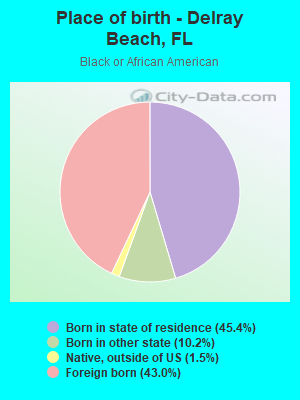
Place of birth - Born in state of residence (%) - Black or African American
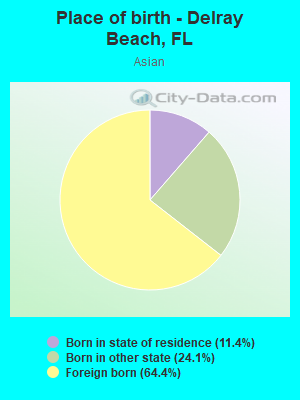
Place of birth - Born in state of residence (%) - Asian
Place of birth - Born in state of residence (%) - Hispanic or Latino
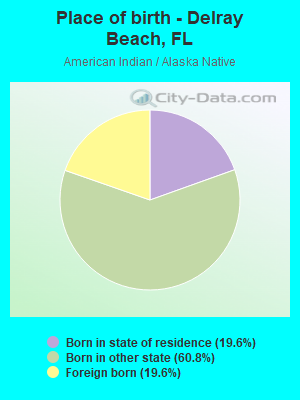
Place of birth - Born in state of residence (%) - American Indian and Alaska Native
Place of birth - Born in state of residence (%) - Multirace
Place of birth - Born in state of residence (%) - Other Race
Place of birth - Born in other state (%)
Place of birth - Born in other state (%) - White
Place of birth - Born in other state (%) - Black or African American
Place of birth - Born in other state (%) - Asian
Place of birth - Born in other state (%) - Hispanic or Latino
Place of birth - Born in other state (%) - American Indian and Alaska Native
Place of birth - Born in other state (%) - Multirace
Place of birth - Born in other state (%) - Other Race
Place of birth - Native, outside of US (%)
Place of birth - Native, outside of US (%) - White
Place of birth - Native, outside of US (%) - Black or African American
Place of birth - Native, outside of US (%) - Asian
Place of birth - Native, outside of US (%) - Hispanic or Latino
Place of birth - Native, outside of US (%) - American Indian and Alaska Native
Place of birth - Native, outside of US (%) - Multirace
Place of birth - Native, outside of US (%) - Other Race
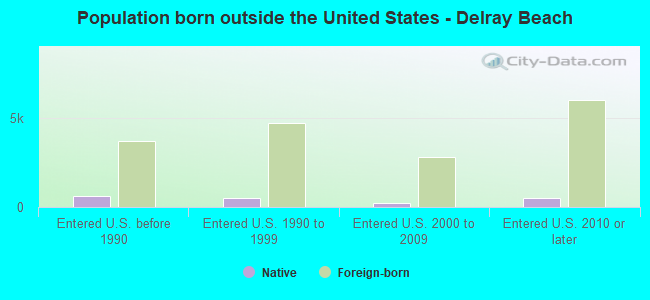
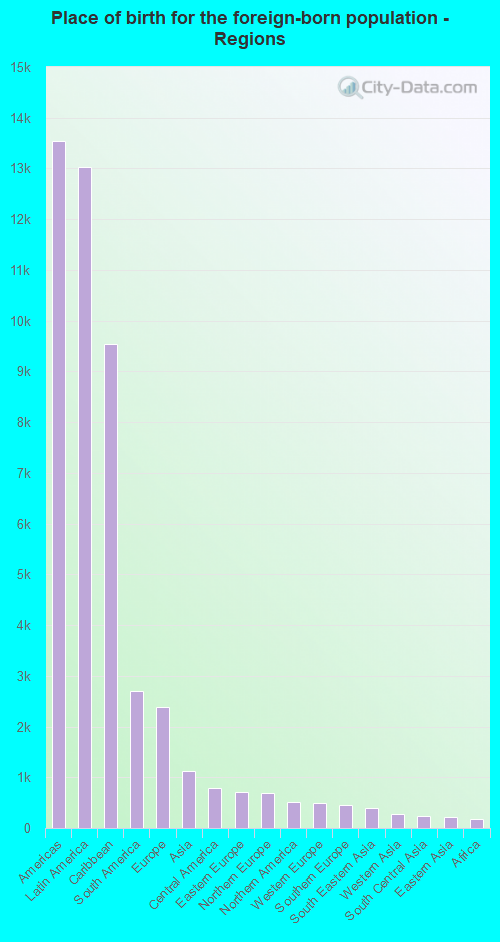
Place of birth - Foreign born (%)
Place of birth - Foreign born (%) - White
Place of birth - Foreign born (%) - Black or African American
Place of birth - Foreign born (%) - Asian
Place of birth - Foreign born (%) - Hispanic or Latino
Place of birth - Foreign born (%) - American Indian and Alaska Native
Place of birth - Foreign born (%) - Multirace
Place of birth - Foreign born (%) - Other Race
Residents speaking English at home (%)
Residents speaking English at home - Born in the United States (%)
Residents speaking English at home - Native, born elsewhere (%)
Residents speaking English at home - Foreign born (%)
Residents speaking Spanish at home (%)
Residents speaking Spanish at home - Born in the United States (%)
Residents speaking Spanish at home - Native, born elsewhere (%)
Residents speaking Spanish at home - Foreign born (%)
Residents speaking other language at home (%)
Residents speaking other language at home - Born in the United States (%)
Residents speaking other language at home - Native, born elsewhere (%)
Residents speaking other language at home - Foreign born (%)
Marital status - Never married (%)
Marital status - Now married (%)
Marital status - Separated (%)
Marital status - Widowed (%)
Marital status - Divorced (%)
Ancestries Reported - Arab (%)
Ancestries Reported - Czech (%)
Ancestries Reported - Danish (%)
Ancestries Reported - Dutch (%)
Ancestries Reported - English (%)
Ancestries Reported - French (%)
Ancestries Reported - French Canadian (%)
Ancestries Reported - German (%)
Ancestries Reported - Greek (%)
Ancestries Reported - Hungarian (%)
Ancestries Reported - Irish (%)
Ancestries Reported - Italian (%)
Ancestries Reported - Lithuanian (%)
Ancestries Reported - Norwegian (%)
Ancestries Reported - Polish (%)
Ancestries Reported - Portuguese (%)
Ancestries Reported - Russian (%)
Ancestries Reported - Scotch-Irish (%)
Ancestries Reported - Scottish (%)
Ancestries Reported - Slovak (%)
Ancestries Reported - Subsaharan African (%)
Ancestries Reported - Swedish (%)
Ancestries Reported - Swiss (%)
Ancestries Reported - Ukrainian (%)
Ancestries Reported - United States (%)
Ancestries Reported - Welsh (%)
Ancestries Reported - West Indian (%)
Ancestries Reported - Other (%)
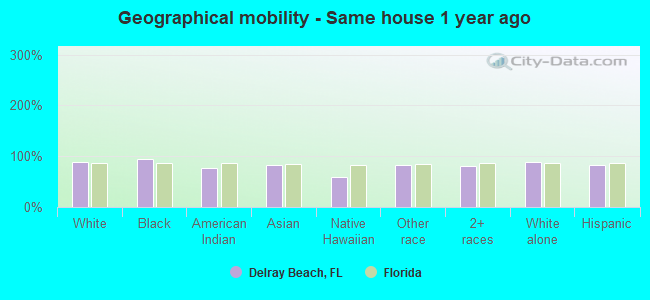
Geographical mobility - Same house 1 year ago (%)
Geographical mobility - Same house 1 year ago (%) - White
Geographical mobility - Same house 1 year ago (%) - Black or African American
Geographical mobility - Same house 1 year ago (%) - Asian
Geographical mobility - Same house 1 year ago (%) - Hispanic or Latino
Geographical mobility - Same house 1 year ago (%) - American Indian and Alaska Native
Geographical mobility - Same house 1 year ago (%) - Multirace
Geographical mobility - Same house 1 year ago (%) - Other Race
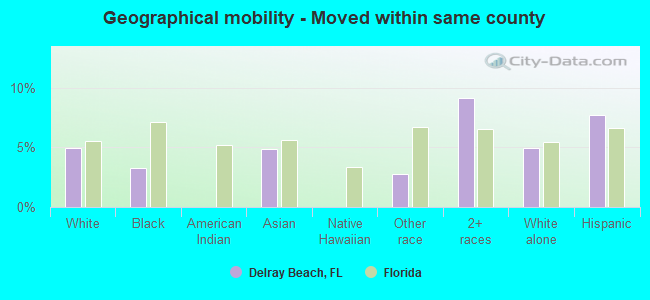
Geographical mobility - Moved within same county (%)
Geographical mobility - Moved within same county (%) - White
Geographical mobility - Moved within same county (%) - Black or African American
Geographical mobility - Moved within same county (%) - Asian
Geographical mobility - Moved within same county (%) - Hispanic or Latino
Geographical mobility - Moved within same county (%) - American Indian and Alaska Native
Geographical mobility - Moved within same county (%) - Multirace
Geographical mobility - Moved within same county (%) - Other Race
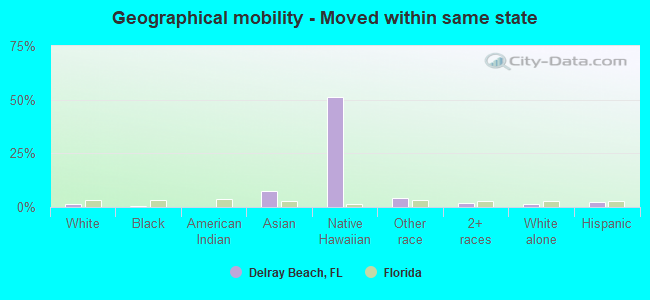
Geographical mobility - Moved from different county within same state (%)
Geographical mobility - Moved from different county within same state (%) - White
Geographical mobility - Moved from different county within same state (%) - Black or African American
Geographical mobility - Moved from different county within same state (%) - Asian
Geographical mobility - Moved from different county within same state (%) - Hispanic or Latino
Geographical mobility - Moved from different county within same state (%) - American Indian and Alaska Native
Geographical mobility - Moved from different county within same state (%) - Multirace
Geographical mobility - Moved from different county within same state (%) - Other Race
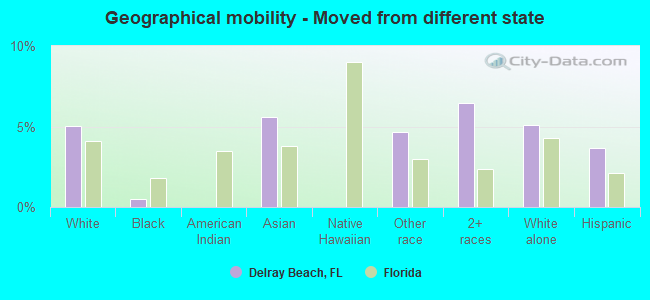
Geographical mobility - Moved from different state (%)
Geographical mobility - Moved from different state (%) - White
Geographical mobility - Moved from different state (%) - Black or African American
Geographical mobility - Moved from different state (%) - Asian
Geographical mobility - Moved from different state (%) - Hispanic or Latino
Geographical mobility - Moved from different state (%) - American Indian and Alaska Native
Geographical mobility - Moved from different state (%) - Multirace
Geographical mobility - Moved from different state (%) - Other Race
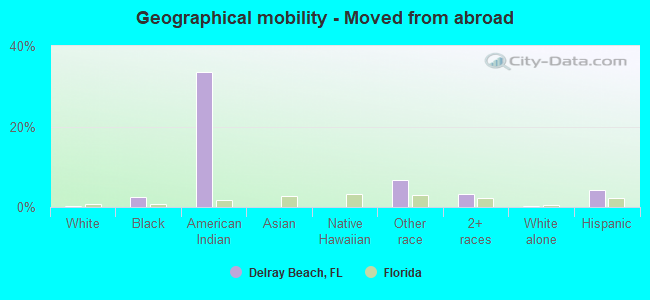
Geographical mobility - Moved from abroad (%)
Geographical mobility - Moved from abroad (%) - White
Geographical mobility - Moved from abroad (%) - Black or African American
Geographical mobility - Moved from abroad (%) - Asian
Geographical mobility - Moved from abroad (%) - Hispanic or Latino
Geographical mobility - Moved from abroad (%) - American Indian and Alaska Native
Geographical mobility - Moved from abroad (%) - Multirace
Geographical mobility - Moved from abroad (%) - Other Race
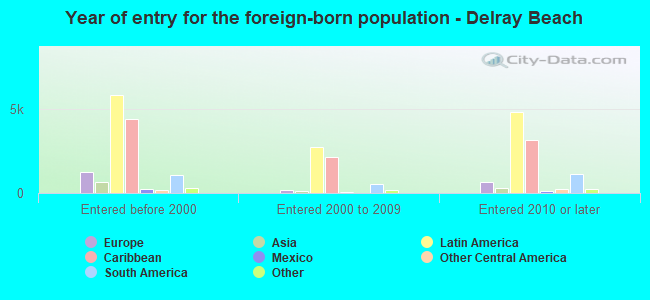
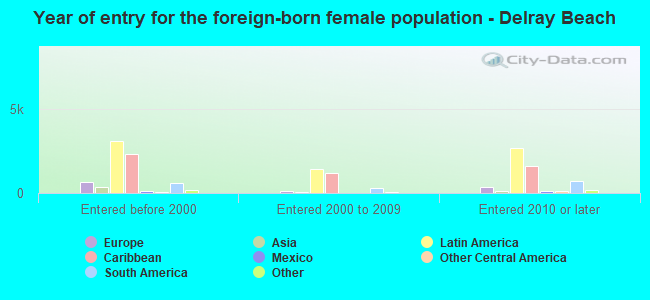
Place of birth for the foreign-born population - Ireland (%)
Place of birth for the foreign-born population - Denmark (%)
Place of birth for the foreign-born population - Norway (%)
Place of birth for the foreign-born population - Sweden (%)
Place of birth for the foreign-born population - United Kingdom (%)
Place of birth for the foreign-born population - England (%)
Place of birth for the foreign-born population - Scotland (%)
Place of birth for the foreign-born population - Other Northern Europe (%)
Place of birth for the foreign-born population - Austria (%)
Place of birth for the foreign-born population - Belgium (%)
Place of birth for the foreign-born population - France (%)
Place of birth for the foreign-born population - Germany (%)
Place of birth for the foreign-born population - Netherlands (%)
Place of birth for the foreign-born population - Switzerland (%)
Place of birth for the foreign-born population - Other Western Europe (%)
Place of birth for the foreign-born population - Greece (%)
Place of birth for the foreign-born population - Italy (%)
Place of birth for the foreign-born population - Portugal (%)
Place of birth for the foreign-born population - Spain (%)
Place of birth for the foreign-born population - Other Southern Europe (%)
Place of birth for the foreign-born population - Albania (%)
Place of birth for the foreign-born population - Belarus (%)
Place of birth for the foreign-born population - Bosnia and Herzegovina (%)
Place of birth for the foreign-born population - Bulgaria (%)
Place of birth for the foreign-born population - Croatia (%)
Place of birth for the foreign-born population - Czechoslovakia (%)
Place of birth for the foreign-born population - Hungary (%)
Place of birth for the foreign-born population - Latvia (%)
Place of birth for the foreign-born population - Lithuania (%)
Place of birth for the foreign-born population - North Macedonia (Macedonia) (%)
Place of birth for the foreign-born population - Moldova (%)
Place of birth for the foreign-born population - Poland (%)
Place of birth for the foreign-born population - Romania (%)
Place of birth for the foreign-born population - Russia (%)
Place of birth for the foreign-born population - Serbia (%)
Place of birth for the foreign-born population - Ukraine (%)
Place of birth for the foreign-born population - Other Eastern Europe (%)
Place of birth for the foreign-born population - China (%)
Place of birth for the foreign-born population - Hong Kong (%)
Place of birth for the foreign-born population - Taiwan (%)
Place of birth for the foreign-born population - Japan (%)
Place of birth for the foreign-born population - Korea (%)
Place of birth for the foreign-born population - Other Eastern Asia (%)
Place of birth for the foreign-born population - Afghanistan (%)
Place of birth for the foreign-born population - Bangladesh (%)
Place of birth for the foreign-born population - India (%)
Place of birth for the foreign-born population - Iran (%)
Place of birth for the foreign-born population - Kazakhstan (%)
Place of birth for the foreign-born population - Nepal (%)
Place of birth for the foreign-born population - Pakistan (%)
Place of birth for the foreign-born population - Sri Lanka (%)
Place of birth for the foreign-born population - Uzbekistan (%)
Place of birth for the foreign-born population - Other South Central Asia (%)
Place of birth for the foreign-born population - Burma (%)
Place of birth for the foreign-born population - Cambodia (%)
Place of birth for the foreign-born population - Indonesia (%)
Place of birth for the foreign-born population - Laos (%)
Place of birth for the foreign-born population - Malaysia (%)
Place of birth for the foreign-born population - Philippines (%)
Place of birth for the foreign-born population - Singapore (%)
Place of birth for the foreign-born population - Thailand (%)
Place of birth for the foreign-born population - Vietnam (%)
Place of birth for the foreign-born population - Other South Eastern Asia (%)
Place of birth for the foreign-born population - Armenia (%)
Place of birth for the foreign-born population - Iraq (%)
Place of birth for the foreign-born population - Israel (%)
Place of birth for the foreign-born population - Jordan (%)
Place of birth for the foreign-born population - Kuwait (%)
Place of birth for the foreign-born population - Lebanon (%)
Place of birth for the foreign-born population - Saudi Arabia (%)
Place of birth for the foreign-born population - Syria (%)
Place of birth for the foreign-born population - Turkey (%)
Place of birth for the foreign-born population - Yemen (%)
Place of birth for the foreign-born population - Other Western Asia (%)
Place of birth for the foreign-born population - Eritrea (%)
Place of birth for the foreign-born population - Ethiopia (%)
Place of birth for the foreign-born population - Kenya (%)
Place of birth for the foreign-born population - Somalia (%)
Place of birth for the foreign-born population - Uganda (%)
Place of birth for the foreign-born population - Zimbabwe (%)
Place of birth for the foreign-born population - Other Eastern Africa (%)
Place of birth for the foreign-born population - Cameroon (%)
Place of birth for the foreign-born population - Congo (%)
Place of birth for the foreign-born population - Democratic Republic of Congo (Zaire) (%)
Place of birth for the foreign-born population - Other Middle Africa (%)
Place of birth for the foreign-born population - Egypt (%)
Place of birth for the foreign-born population - Morocco (%)
Place of birth for the foreign-born population - Sudan (%)
Place of birth for the foreign-born population - Other Northern Africa (%)
Place of birth for the foreign-born population - South Africa (%)
Place of birth for the foreign-born population - Other Southern Africa (%)
Place of birth for the foreign-born population - Cabo Verde (%)
Place of birth for the foreign-born population - Ghana (%)
Place of birth for the foreign-born population - Liberia (%)
Place of birth for the foreign-born population - Nigeria (%)
Place of birth for the foreign-born population - Senegal (%)
Place of birth for the foreign-born population - Sierra Leone (%)
Place of birth for the foreign-born population - Other Western Africa (%)
Place of birth for the foreign-born population - Australia (%)
Place of birth for the foreign-born population - New Zealand (%)
Place of birth for the foreign-born population - Fiji (%)
Place of birth for the foreign-born population - Micronesia (%)
Place of birth for the foreign-born population - Bahamas (%)
Place of birth for the foreign-born population - Barbados (%)
Place of birth for the foreign-born population - Cuba (%)
Place of birth for the foreign-born population - Dominica (%)
Place of birth for the foreign-born population - Dominican Republic (%)
Place of birth for the foreign-born population - Grenada (%)
Place of birth for the foreign-born population - Haiti (%)
Place of birth for the foreign-born population - Jamaica (%)
Place of birth for the foreign-born population - St. Vincent and the Grenadines (%)
Place of birth for the foreign-born population - Trinidad and Tobago (%)
Place of birth for the foreign-born population - West Indies (%)
Place of birth for the foreign-born population - Other Caribbean (%)
Place of birth for the foreign-born population - Belize (%)
Place of birth for the foreign-born population - Costa Rica (%)
Place of birth for the foreign-born population - El Salvador (%)
Place of birth for the foreign-born population - Guatemala (%)
Place of birth for the foreign-born population - Honduras (%)
Place of birth for the foreign-born population - Mexico (%)
Place of birth for the foreign-born population - Nicaragua (%)
Place of birth for the foreign-born population - Panama (%)
Place of birth for the foreign-born population - Other Central America (%)
Place of birth for the foreign-born population - Argentina (%)
Place of birth for the foreign-born population - Bolivia (%)
Place of birth for the foreign-born population - Brazil (%)
Place of birth for the foreign-born population - Chile (%)
Place of birth for the foreign-born population - Colombia (%)
Place of birth for the foreign-born population - Ecuador (%)
Place of birth for the foreign-born population - Guyana (%)
Place of birth for the foreign-born population - Peru (%)
Place of birth for the foreign-born population - Uruguay (%)
Place of birth for the foreign-born population - Venezuela (%)
Place of birth for the foreign-born population - Other South America (%)
Place of birth for the foreign-born population - Canada (%)
Place of birth for the foreign-born population - Other Northern America (%)
Place of birth for the foreign-born population - Other (%)
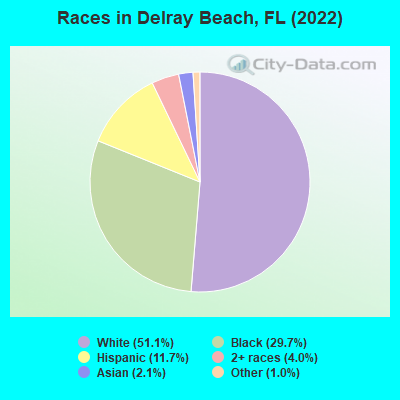
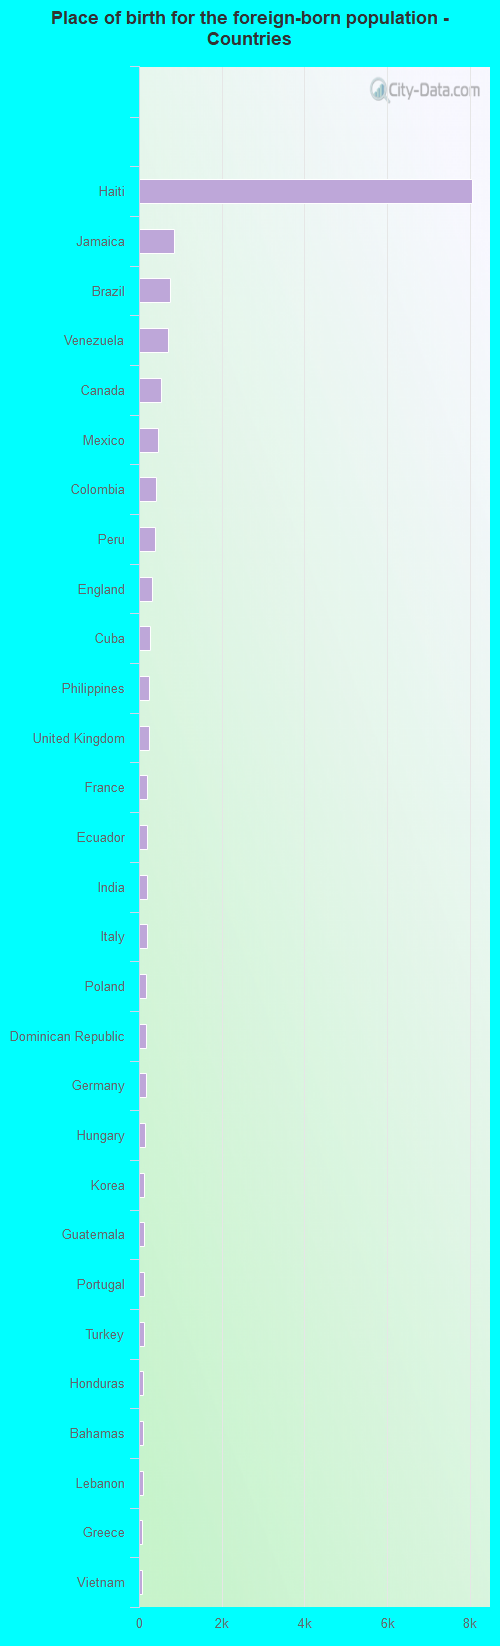
According to 2022 data, the most numerous races in Delray Beach, FL are White alone (34,593 residents), Hispanic (7,888 residents), and Black alone (20,084 residents). 66.4% of Delray Beach residents speak English at home. 25.5% of Delray Beach, FL residents are foreign-born (18.9% born in Latin America, 3.5% born in Europe), which is 17.8% greater than the foreign-born rate of 21.0% across the entire state of Florida.
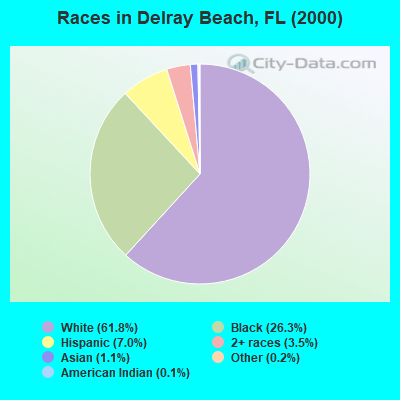
Race distribution in Delray Beach
2000 2022
10,458,509 65.4% White alone 2,682,715 16.8% Hispanic 2,264,268 14.2% Black alone 261,693 1.6% Asian alone 236,954 1.5% Two or more races 42,358 0.3% American Indian alone 28,994 0.2% Other race alone 6,887 0.04% Native Hawaiian and Other
11,309,403 50.8% White alone 6,025,039 27.1% Hispanic 3,241,015 14.6% Black alone 861,630 3.9% Two or more races 623,692 2.8% Asian alone 152,054 0.7% Other race alone 22,504 0.1% American Indian alone 9,486 0.04% Native Hawaiian and Other
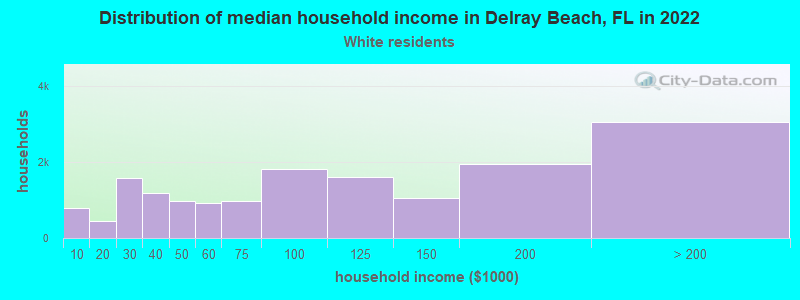
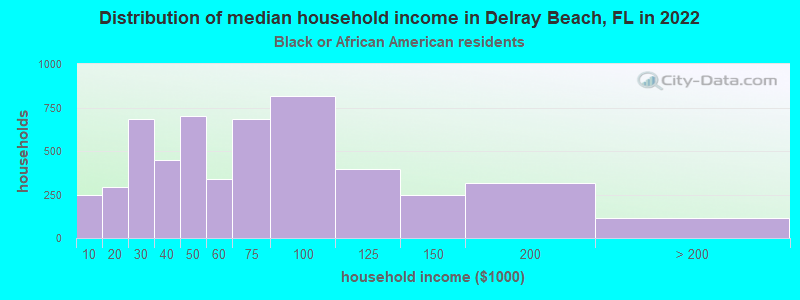
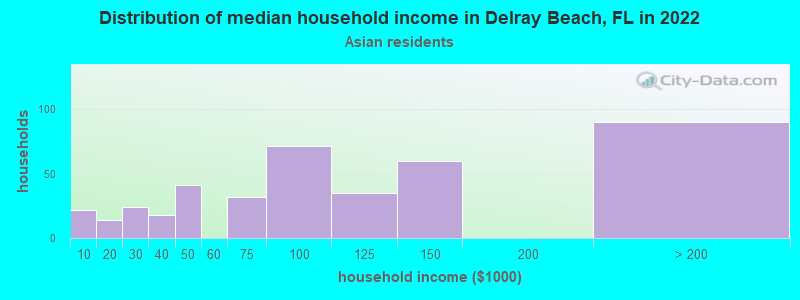
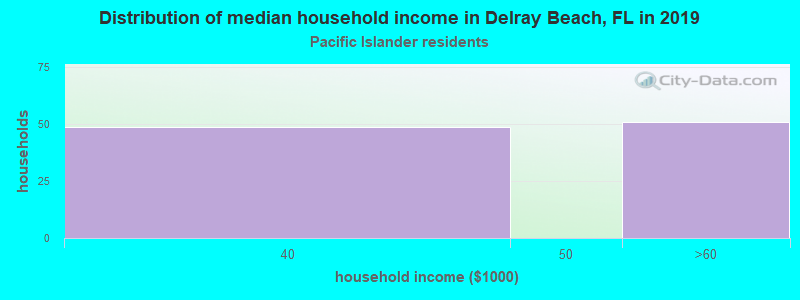
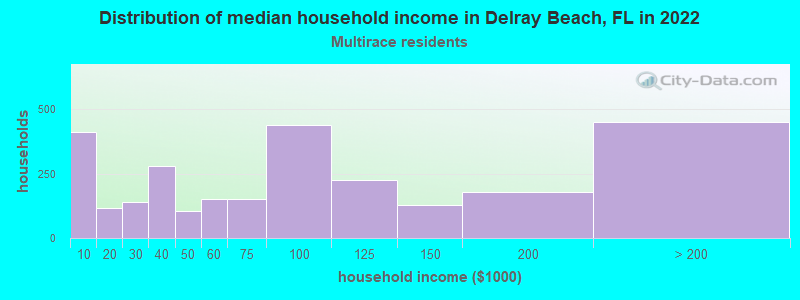
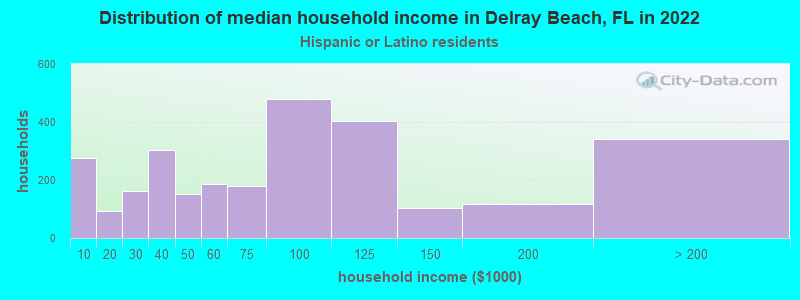
Income and house value in Delray Beach Median household income in 2022 $90,884 White non-Hispanic householders$58,036 Black householders$97,612 Asian householders$66,519 Some other race householders$83,722 Two or more races householders$79,852 Hispanic or Latino race householdersMedian 2022 house value $682,604 White Non-Hispanic householders$364,919 Black or African American householders$150,506 American Indian or Alaska Native householders $578,870 Asian householders$364,919 Some other race householders$420,954 Two or more races householders$449,203 Hispanic or Latino householders
Median age by race in Delray Beach
58.7 Median age for White residents58.5 58.9 36.7 Median age for Black or African American residents40.6 32.5 -666,666,666.0 Median age for American Indian / Alaska Native residents-666,666,666.0 -666,666,666.0 87.1 Median age for Asian residents57.9 88.2 -666,666,666.0 Median age for Native Hawaiian / Pacific Islander residents-666,666,666.0 -666,666,666.0 35.7 Median age for Other race residents28.8 36.5 39.6 Median age for Two or more races residents39.1 39.8 58.7 Median age for White alone residents58.3 58.9 45.6 Median age for Hispanic or Latino residents45.7 45.5
Owner/renter occupied households by race in Delray Beach
House owners and renters - White residents 12,021 73.7% Owner occupied4,281 26.3% Renter occupiedHouse owners and renters - Black or African American residents 2,796 46.6% Owner occupied3,206 53.4% Renter occupiedHouse owners and renters - American Indian / Alaska Native residents 2 100.0% Owner occupiedHouse owners and renters - Asian residents 329 66.0% Owner occupied169 34.0% Renter occupiedHouse owners and renters - Native Hawaiian / Pacific Islander residents 74 100.0% Renter occupiedHouse owners and renters - Other race residents 623 67.4% Owner occupied301 32.6% Renter occupiedHouse owners and renters - Two or more races residents 1,522 46.0% Owner occupied1,787 54.0% Renter occupiedHouse owners and renters - White alone residents 11,855 73.6% Owner occupied4,242 26.4% Renter occupiedHouse owners and renters - Hispanic or Latino residents 1,211 42.3% Owner occupied1,654 57.7% Renter occupied
Language usage in Delray Beach
English speakers - Total 66.4% of residents of Delray Beach speak English at home.
9.6% of residents speak Spanish at home 3,867 62.9% Speak English very well2,277 37.1% Speak English less than very well24.0% of residents speak other language at home 5,958 38.6% Speak English very well9,495 61.4% Speak English less than very well
English speakers - Born in the United States 90.1% of residents of Delray Beach speak English at home.
5.9% of residents speak Spanish at home 1,312 81.8% Speak English very well291 18.2% Speak English less than very well4.0% of residents speak other language at home 919 84.7% Speak English very well166 15.3% Speak English less than very well
English speakers - Native, born elsewhere 49.9% of residents of Delray Beach speak English at home.
37.9% of residents speak Spanish at home 533 76.8% Speak English very well161 23.2% Speak English less than very well12.2% of residents speak other language at home 118 52.7% Speak English very well106 47.3% Speak English less than very well
English speakers - Foreign-born 14.7% of residents of Delray Beach speak English at home.
15.6% of residents speak Spanish at home 1,123 42.9% Speak English very well1,497 57.1% Speak English less than very well69.7% of residents speak other language at home 3,707 31.6% Speak English very well8,014 68.4% Speak English less than very well
White (Caucasian) - Speak only English Native:
95.4% (26,288)Foreign-born:
62.9% (1,368)
White (Caucasian) - Speak another language Native:
4.6% (1,259)Foreign-born:
37.1% (806)
Black or African American - Speak only English Native:
74.5% (10,016)Foreign-born:
4.8% (494)
Black or African American - Speak another language Native:
25.5% (3,424)Foreign-born:
95.2% (9,811)
American Indian / Alaska Native - Speak another language Native:
67.0% (52)Foreign-born:
100.0% (21)
Asian - Speak only English Native:
66.2% (309)Foreign-born:
31.8% (305)
Asian - Speak another language Native:
34.6% (162)Foreign-born:
68.4% (655)
Other race - Speak only English Native:
52.7% (686)Foreign-born:
7.8% (111)
Other race - Speak another language Native:
48.3% (629)Foreign-born:
92.1% (1,302)
Two or more races - Speak only English Native:
57.7% (2,854)Foreign-born:
10.9% (327)
Two or more races - Speak another language Native:
42.3% (2,091)Foreign-born:
89.1% (2,670)
White alone - Speak only English Native:
95.7% (26,112)Foreign-born:
69.5% (1,368)
White alone - Speak another language Native:
4.3% (1,178)Foreign-born:
30.5% (600)
Hispanic or Latino - Speak only English Native:
34.9% (1,395)Foreign-born:
10.2% (288)
Hispanic or Latino - Speak another language Native:
65.1% (2,598)Foreign-born:
89.8% (2,543)
Foreign-born residents in Delray Beach 17,289 residents are foreign born (18.9% Latin America , 3.5% Europe ).
This city:
25.5%Florida:
21.1%
Marital status for residents in Delray Beach Marital status - White (Caucasian) population 15 years and over
Males 22.5% Never married61.3% Now married0.2% Separated3.8% Widowed12.3% DivorcedFemales 23.9% Never married45.8% Now married1.3% Separated12.0% Widowed16.9% DivorcedWomen who gave birth in the past 12 months Now married:
100.0% (178)Unmarried:
0.0% (0)
Women who did not give birth in the past 12 months Now married:
34.8% (1,794)Unmarried:
65.2% (3,367)
Marital status - Black or African American population 15 years and over
Males 42.6% Never married49.6% Now married3.1% Separated0.6% Widowed4.1% DivorcedFemales 48.0% Never married32.3% Now married3.9% Separated8.8% Widowed7.0% DivorcedWomen who gave birth in the past 12 months Now married:
49.2% (32)Unmarried:
50.8% (33)
Women who did not give birth in the past 12 months Now married:
25.2% (1,103)Unmarried:
74.8% (3,282)
Marital status - Asian population 15 years and over
Males 36.2% Never married58.1% Now married2.0% Separated2.0% Widowed1.6% DivorcedFemales 20.7% Never married40.4% Now married3.1% Separated8.5% Widowed27.3% DivorcedWomen who gave birth in the past 12 months Now married:
100.0% (3)Unmarried:
0.0% (0)
Women who did not give birth in the past 12 months Now married:
53.6% (223)Unmarried:
46.4% (193)
Marital status - Other race population 15 years and over
Males 39.5% Never married44.9% Now married0.5% Separated3.8% Widowed11.2% DivorcedFemales 32.2% Never married46.3% Now married2.0% Separated9.0% Widowed10.5% DivorcedWomen who gave birth in the past 12 months Now married:
100.0% (56)Unmarried:
0.0% (0)
Women who did not give birth in the past 12 months Now married:
32.6% (181)Unmarried:
67.4% (374)
Marital status - Two or more races population 15 years and over
Males 51.3% Never married43.0% Now married0.0% Separated0.0% Widowed5.6% DivorcedFemales 37.7% Never married44.4% Now married0.0% Separated1.1% Widowed16.9% DivorcedWomen who gave birth in the past 12 months Now married:
100.0% (39)Unmarried:
0.0% (0)
Women who did not give birth in the past 12 months Now married:
35.0% (616)Unmarried:
65.0% (1,144)
Marital status - White alone, not Hispanic / Latino population 15 years and over
Males 22.3% Never married61.0% Now married0.2% Separated3.9% Widowed12.6% DivorcedFemales 23.8% Never married45.7% Now married1.4% Separated12.2% Widowed17.0% DivorcedWomen who gave birth in the past 12 months Now married:
100.0% (178)Unmarried:
0.0% (0)
Women who did not give birth in the past 12 months Now married:
35.0% (1,794)Unmarried:
65.0% (3,328)
Marital status - Hispanic or Latino population 15 years and over
Males 43.3% Never married49.3% Now married0.0% Separated0.0% Widowed7.4% DivorcedFemales 36.6% Never married49.9% Now married1.8% Separated1.4% Widowed10.3% DivorcedWomen who gave birth in the past 12 months Now married:
100.0% (47)Unmarried:
0.0% (0)
Women who did not give birth in the past 12 months Now married:
46.0% (798)Unmarried:
54.0% (936)
Ancestries in Delray Beach
9,384 22.4% Haitian3,357 8.0% Italian3,102 7.4% American1,846 4.4% Irish1,186 2.8% German1,145 2.7% English1,012 2.4% Polish729 1.7% Eastern European695 1.7% European541 1.3% Russian477 1.1% Jamaican435 1.0% Brazilian392 0.9% French330 0.8% Portuguese221 0.5% Greek216 0.5% Hungarian199 0.5% French Canadian187 0.4% Norwegian187 0.4% Ukrainian185 0.4% Scotch-Irish169 0.4% Scottish155 0.4% British147 0.4% African140 0.3% Danish101 0.2% Canadian94 0.2% Czech93 0.2% Lithuanian86 0.2% Iranian86 0.2% Israeli83 0.2% Romanian72 0.2% Austrian58 0.1% Lebanese57 0.1% Welsh54 0.1% Finnish52 0.1% Trinidadian and Tobagonian50 0.1% Moroccan48 0.1% Turkish41 0.10% Swedish39 0.09% Serbian36 0.09% Dutch36 0.09% Bulgarian32 0.08% Slovak30 0.07% Egyptian30 0.07% Latvian30 0.07% Armenian29 0.07% Albanian27 0.06% Kenyan26 0.06% Croatian21 0.05% Swiss21 0.05% U.S. Virgin Islander17 0.04% Slovene11 0.03% Northern European11 0.03% Belgian9 0.02% Celtic8 0.02% Macedonian8 0.02% New Zealander7 0.02% Scandinavian6 0.01% Guyanese6 0.01% South African5 0.01% Luxembourger4 0.01% Arab
Geographical mobility in Delray Beach Same house 1 year ago 27,037 88.1% White (Caucasian)19,035 94.9% Black or African American89 76.1% American Indian / Alaska Native1,188 82.4% Asian19 59.5% Native Hawaiian / Pacific Islander2,387 83.7% Other race5,743 80.4% Two or more races26,616 88.1% White alone, not Hispanic / Latino6,479 82.4% Hispanic or LatinoMoved within same county 1,527 5.0% White / Caucasian661 3.3% Black or African American70 4.9% Asian79 2.8% Other race651 9.1% Two or more races1,485 4.9% White alone, not Hispanic / Latino608 7.7% Hispanic or LatinoMoved within same state 468 1.5% White / Caucasian101 0.5% Black or African American110 7.6% Asian17 51.3% Native Hawaiian / Pacific Islander113 4.0% Other race135 1.9% Two or more races468 1.5% White alone, not Hispanic / Latino201 2.6% Hispanic or LatinoMoved from different state 1,539 5.0% White / Caucasian98 0.5% Black or African American81 5.6% Asian132 4.6% Other race461 6.5% Two or more races1,539 5.1% White alone, not Hispanic / Latino287 3.7% Hispanic or LatinoMoved from abroad 105 0.3% White484 2.4% Black or African American39 33.7% American Indian / Alaska Native191 6.7% Other race223 3.1% Two or more races105 0.3% White alone, not Hispanic / Latino331 4.2% Hispanic or Latino
Children Nativity (place of birth) in Delray Beach
Children under 6 years - Living with two parents Both parents native 1,139 99.9% Native1 0.1% Foreign-bornBoth parents foreign-born 585 92.9% Native45 7.1% Foreign-bornOne native, one foreign-born parent 157 100.0% NativeChildren under 6 years - Living with one parent Native parent 824 100.0% NativeForeign-born parent 545 87.4% Native78 12.6% Foreign-bornChildren 6 to 17 years - Living with two parents Both parents native 1,376 99.3% Native9 0.7% Foreign-bornBoth parents foreign-born 889 77.8% Native254 22.2% Foreign-bornOne native, one foreign-born parent 253 94.0% Native16 6.0% Foreign-bornChildren 6 to 17 years - Living with one parent Native parent 687 100.0% NativeForeign-born parent 835 59.0% Native581 41.0% Foreign-born
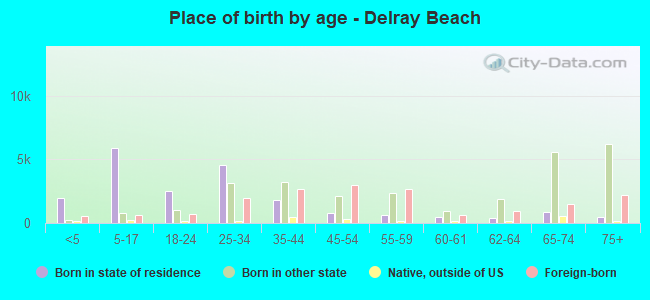
Place of birth for residents in Delray Beach
Grandparents responsible for own grandchildren in Delray Beach
Grandparents (30 to 59 years) White / Caucasian 13 32.3% Responsible for grandchildren28 67.7% Not responsible for grandchildrenBlack or African American 102 39.5% Responsible for grandchildren156 60.5% Not responsible for grandchildrenAsian 23 100.0% Responsible for grandchildrenTwo or more races 8 100.0% Responsible for grandchildrenWhite alone, not Hispanic / Latino 16 34.7% Responsible for grandchildren29 65.3% Not responsible for grandchildrenHispanic or Latino 23 100.0% Not responsible for grandchildrenGrandparents (60 years and over) White / Caucasian 18 14.7% Responsible for grandchildren106 85.3% Not responsible for grandchildrenBlack or African American 95 39.2% Responsible for grandchildren147 60.8% Not responsible for grandchildrenAsian 103 100.0% Not responsible for grandchildrenTwo or more races 3 100.0% Not responsible for grandchildrenWhite alone, not Hispanic / Latino 22 20.5% Responsible for grandchildren84 79.5% Not responsible for grandchildrenHispanic or Latino 129 100.0% Not responsible for grandchildren