Races in Denison, Iowa (IA) Detailed Stats
Data:
Races - White alone (%)
Races - White alone (% change since 2000)
Races - Black alone (%)
Races - Black alone (% change since 2000)
Races - American Indian alone (%)
Races - American Indian alone (% change since 2000)
Races - Asian alone (%)
Races - Asian alone (% change since 2000)
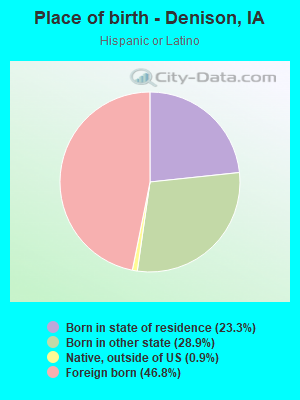
Races - Hispanic (%)
Races - Hispanic (% change since 2000)
Races - Native Hawaiian and Other Pacific Islander alone (%)
Races - Native Hawaiian and Other Pacific Islander alone (% change since 2000)
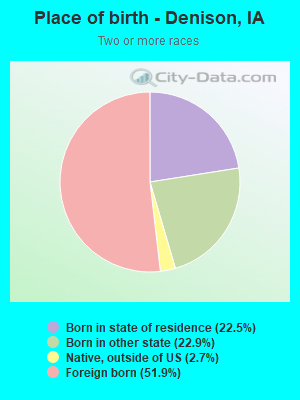
Races - Two or more races(%)
Races - Two or more races(% change since 2000)
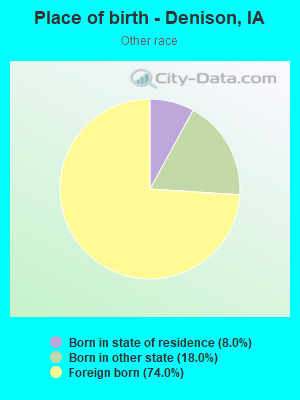
Races - Other race alone (%)
Races - Other race alone (% change since 2000)
Racial diversity
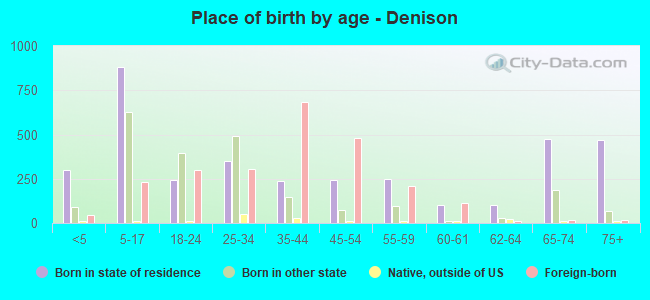
Place of birth - Born in state of residence (%)
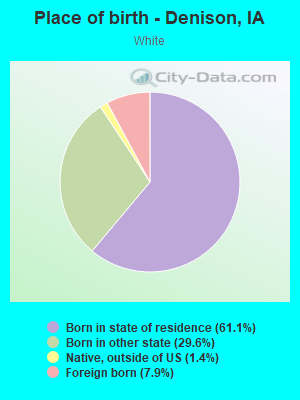
Place of birth - Born in state of residence (%) - White
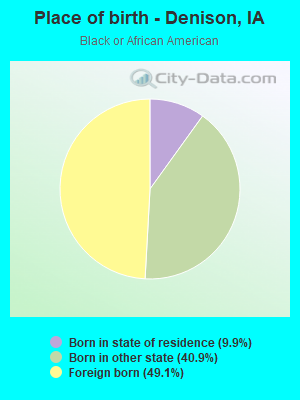
Place of birth - Born in state of residence (%) - Black or African American
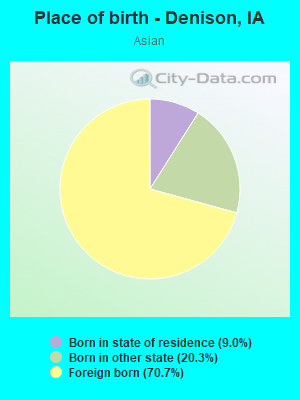
Place of birth - Born in state of residence (%) - Asian
Place of birth - Born in state of residence (%) - Hispanic or Latino
Place of birth - Born in state of residence (%) - American Indian and Alaska Native
Place of birth - Born in state of residence (%) - Multirace
Place of birth - Born in state of residence (%) - Other Race
Place of birth - Born in other state (%)
Place of birth - Born in other state (%) - White
Place of birth - Born in other state (%) - Black or African American
Place of birth - Born in other state (%) - Asian
Place of birth - Born in other state (%) - Hispanic or Latino
Place of birth - Born in other state (%) - American Indian and Alaska Native
Place of birth - Born in other state (%) - Multirace
Place of birth - Born in other state (%) - Other Race
Place of birth - Native, outside of US (%)
Place of birth - Native, outside of US (%) - White
Place of birth - Native, outside of US (%) - Black or African American
Place of birth - Native, outside of US (%) - Asian
Place of birth - Native, outside of US (%) - Hispanic or Latino
Place of birth - Native, outside of US (%) - American Indian and Alaska Native
Place of birth - Native, outside of US (%) - Multirace
Place of birth - Native, outside of US (%) - Other Race
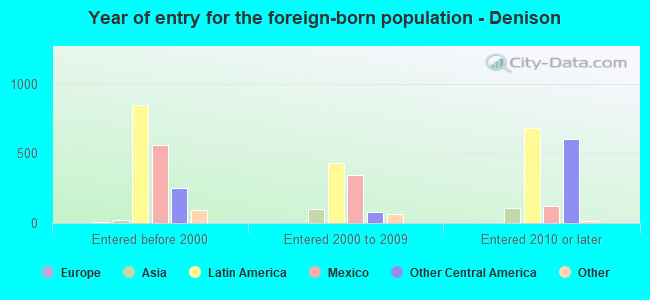
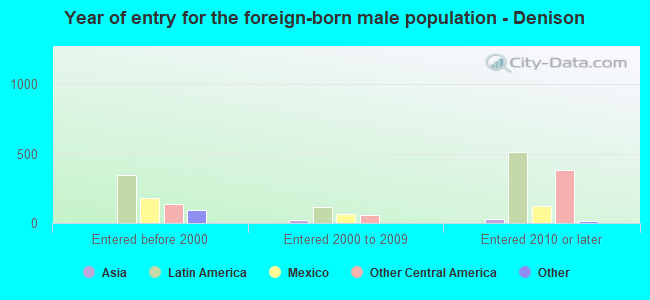
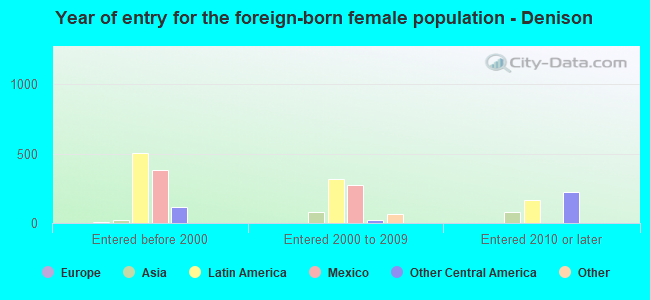
Place of birth - Foreign born (%)
Place of birth - Foreign born (%) - White
Place of birth - Foreign born (%) - Black or African American
Place of birth - Foreign born (%) - Asian
Place of birth - Foreign born (%) - Hispanic or Latino
Place of birth - Foreign born (%) - American Indian and Alaska Native
Place of birth - Foreign born (%) - Multirace
Place of birth - Foreign born (%) - Other Race
Residents speaking English at home (%)
Residents speaking English at home - Born in the United States (%)
Residents speaking English at home - Native, born elsewhere (%)
Residents speaking English at home - Foreign born (%)
Residents speaking Spanish at home (%)
Residents speaking Spanish at home - Born in the United States (%)
Residents speaking Spanish at home - Native, born elsewhere (%)
Residents speaking Spanish at home - Foreign born (%)
Residents speaking other language at home (%)
Residents speaking other language at home - Born in the United States (%)
Residents speaking other language at home - Native, born elsewhere (%)
Residents speaking other language at home - Foreign born (%)
Marital status - Never married (%)
Marital status - Now married (%)
Marital status - Separated (%)
Marital status - Widowed (%)
Marital status - Divorced (%)
Ancestries Reported - Arab (%)
Ancestries Reported - Czech (%)
Ancestries Reported - Danish (%)
Ancestries Reported - Dutch (%)
Ancestries Reported - English (%)
Ancestries Reported - French (%)
Ancestries Reported - French Canadian (%)
Ancestries Reported - German (%)
Ancestries Reported - Greek (%)
Ancestries Reported - Hungarian (%)
Ancestries Reported - Irish (%)
Ancestries Reported - Italian (%)
Ancestries Reported - Lithuanian (%)
Ancestries Reported - Norwegian (%)
Ancestries Reported - Polish (%)
Ancestries Reported - Portuguese (%)
Ancestries Reported - Russian (%)
Ancestries Reported - Scotch-Irish (%)
Ancestries Reported - Scottish (%)
Ancestries Reported - Slovak (%)
Ancestries Reported - Subsaharan African (%)
Ancestries Reported - Swedish (%)
Ancestries Reported - Swiss (%)
Ancestries Reported - Ukrainian (%)
Ancestries Reported - United States (%)
Ancestries Reported - Welsh (%)
Ancestries Reported - West Indian (%)
Ancestries Reported - Other (%)
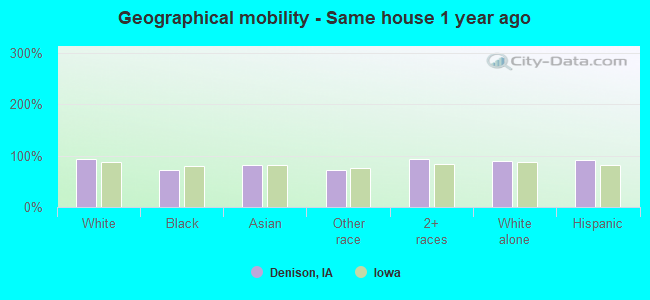
Geographical mobility - Same house 1 year ago (%)
Geographical mobility - Same house 1 year ago (%) - White
Geographical mobility - Same house 1 year ago (%) - Black or African American
Geographical mobility - Same house 1 year ago (%) - Asian
Geographical mobility - Same house 1 year ago (%) - Hispanic or Latino
Geographical mobility - Same house 1 year ago (%) - American Indian and Alaska Native
Geographical mobility - Same house 1 year ago (%) - Multirace
Geographical mobility - Same house 1 year ago (%) - Other Race
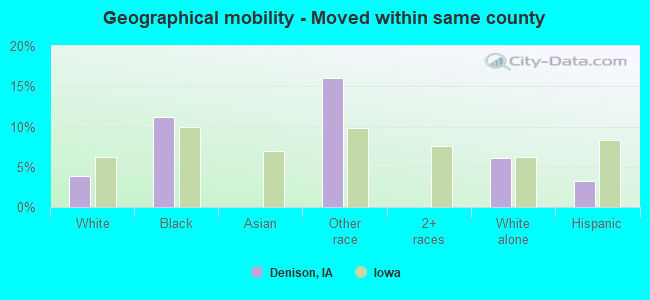
Geographical mobility - Moved within same county (%)
Geographical mobility - Moved within same county (%) - White
Geographical mobility - Moved within same county (%) - Black or African American
Geographical mobility - Moved within same county (%) - Asian
Geographical mobility - Moved within same county (%) - Hispanic or Latino
Geographical mobility - Moved within same county (%) - American Indian and Alaska Native
Geographical mobility - Moved within same county (%) - Multirace
Geographical mobility - Moved within same county (%) - Other Race
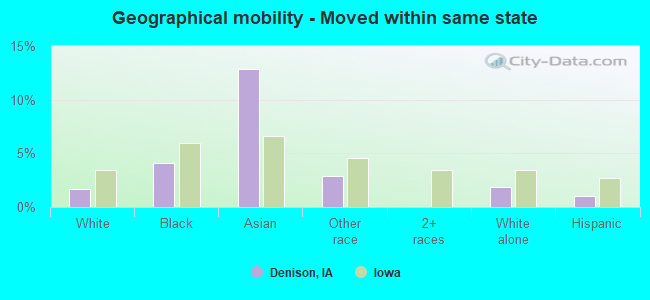
Geographical mobility - Moved from different county within same state (%)
Geographical mobility - Moved from different county within same state (%) - White
Geographical mobility - Moved from different county within same state (%) - Black or African American
Geographical mobility - Moved from different county within same state (%) - Asian
Geographical mobility - Moved from different county within same state (%) - Hispanic or Latino
Geographical mobility - Moved from different county within same state (%) - American Indian and Alaska Native
Geographical mobility - Moved from different county within same state (%) - Multirace
Geographical mobility - Moved from different county within same state (%) - Other Race
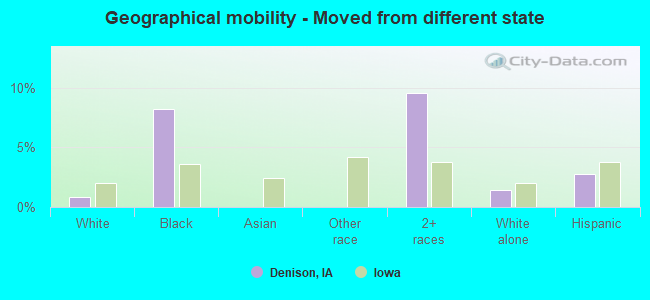
Geographical mobility - Moved from different state (%)
Geographical mobility - Moved from different state (%) - White
Geographical mobility - Moved from different state (%) - Black or African American
Geographical mobility - Moved from different state (%) - Asian
Geographical mobility - Moved from different state (%) - Hispanic or Latino
Geographical mobility - Moved from different state (%) - American Indian and Alaska Native
Geographical mobility - Moved from different state (%) - Multirace
Geographical mobility - Moved from different state (%) - Other Race
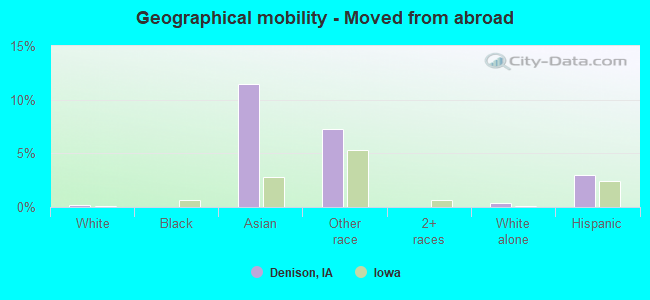
Geographical mobility - Moved from abroad (%)
Geographical mobility - Moved from abroad (%) - White
Geographical mobility - Moved from abroad (%) - Black or African American
Geographical mobility - Moved from abroad (%) - Asian
Geographical mobility - Moved from abroad (%) - Hispanic or Latino
Geographical mobility - Moved from abroad (%) - American Indian and Alaska Native
Geographical mobility - Moved from abroad (%) - Multirace
Geographical mobility - Moved from abroad (%) - Other Race
Place of birth for the foreign-born population - Ireland (%)
Place of birth for the foreign-born population - Denmark (%)
Place of birth for the foreign-born population - Norway (%)
Place of birth for the foreign-born population - Sweden (%)
Place of birth for the foreign-born population - United Kingdom (%)
Place of birth for the foreign-born population - England (%)
Place of birth for the foreign-born population - Scotland (%)
Place of birth for the foreign-born population - Other Northern Europe (%)
Place of birth for the foreign-born population - Austria (%)
Place of birth for the foreign-born population - Belgium (%)
Place of birth for the foreign-born population - France (%)
Place of birth for the foreign-born population - Germany (%)
Place of birth for the foreign-born population - Netherlands (%)
Place of birth for the foreign-born population - Switzerland (%)
Place of birth for the foreign-born population - Other Western Europe (%)
Place of birth for the foreign-born population - Greece (%)
Place of birth for the foreign-born population - Italy (%)
Place of birth for the foreign-born population - Portugal (%)
Place of birth for the foreign-born population - Spain (%)
Place of birth for the foreign-born population - Other Southern Europe (%)
Place of birth for the foreign-born population - Albania (%)
Place of birth for the foreign-born population - Belarus (%)
Place of birth for the foreign-born population - Bosnia and Herzegovina (%)
Place of birth for the foreign-born population - Bulgaria (%)
Place of birth for the foreign-born population - Croatia (%)
Place of birth for the foreign-born population - Czechoslovakia (%)
Place of birth for the foreign-born population - Hungary (%)
Place of birth for the foreign-born population - Latvia (%)
Place of birth for the foreign-born population - Lithuania (%)
Place of birth for the foreign-born population - North Macedonia (Macedonia) (%)
Place of birth for the foreign-born population - Moldova (%)
Place of birth for the foreign-born population - Poland (%)
Place of birth for the foreign-born population - Romania (%)
Place of birth for the foreign-born population - Russia (%)
Place of birth for the foreign-born population - Serbia (%)
Place of birth for the foreign-born population - Ukraine (%)
Place of birth for the foreign-born population - Other Eastern Europe (%)
Place of birth for the foreign-born population - China (%)
Place of birth for the foreign-born population - Hong Kong (%)
Place of birth for the foreign-born population - Taiwan (%)
Place of birth for the foreign-born population - Japan (%)
Place of birth for the foreign-born population - Korea (%)
Place of birth for the foreign-born population - Other Eastern Asia (%)
Place of birth for the foreign-born population - Afghanistan (%)
Place of birth for the foreign-born population - Bangladesh (%)
Place of birth for the foreign-born population - India (%)
Place of birth for the foreign-born population - Iran (%)
Place of birth for the foreign-born population - Kazakhstan (%)
Place of birth for the foreign-born population - Nepal (%)
Place of birth for the foreign-born population - Pakistan (%)
Place of birth for the foreign-born population - Sri Lanka (%)
Place of birth for the foreign-born population - Uzbekistan (%)
Place of birth for the foreign-born population - Other South Central Asia (%)
Place of birth for the foreign-born population - Burma (%)
Place of birth for the foreign-born population - Cambodia (%)
Place of birth for the foreign-born population - Indonesia (%)
Place of birth for the foreign-born population - Laos (%)
Place of birth for the foreign-born population - Malaysia (%)
Place of birth for the foreign-born population - Philippines (%)
Place of birth for the foreign-born population - Singapore (%)
Place of birth for the foreign-born population - Thailand (%)
Place of birth for the foreign-born population - Vietnam (%)
Place of birth for the foreign-born population - Other South Eastern Asia (%)
Place of birth for the foreign-born population - Armenia (%)
Place of birth for the foreign-born population - Iraq (%)
Place of birth for the foreign-born population - Israel (%)
Place of birth for the foreign-born population - Jordan (%)
Place of birth for the foreign-born population - Kuwait (%)
Place of birth for the foreign-born population - Lebanon (%)
Place of birth for the foreign-born population - Saudi Arabia (%)
Place of birth for the foreign-born population - Syria (%)
Place of birth for the foreign-born population - Turkey (%)
Place of birth for the foreign-born population - Yemen (%)
Place of birth for the foreign-born population - Other Western Asia (%)
Place of birth for the foreign-born population - Eritrea (%)
Place of birth for the foreign-born population - Ethiopia (%)
Place of birth for the foreign-born population - Kenya (%)
Place of birth for the foreign-born population - Somalia (%)
Place of birth for the foreign-born population - Uganda (%)
Place of birth for the foreign-born population - Zimbabwe (%)
Place of birth for the foreign-born population - Other Eastern Africa (%)
Place of birth for the foreign-born population - Cameroon (%)
Place of birth for the foreign-born population - Congo (%)
Place of birth for the foreign-born population - Democratic Republic of Congo (Zaire) (%)
Place of birth for the foreign-born population - Other Middle Africa (%)
Place of birth for the foreign-born population - Egypt (%)
Place of birth for the foreign-born population - Morocco (%)
Place of birth for the foreign-born population - Sudan (%)
Place of birth for the foreign-born population - Other Northern Africa (%)
Place of birth for the foreign-born population - South Africa (%)
Place of birth for the foreign-born population - Other Southern Africa (%)
Place of birth for the foreign-born population - Cabo Verde (%)
Place of birth for the foreign-born population - Ghana (%)
Place of birth for the foreign-born population - Liberia (%)
Place of birth for the foreign-born population - Nigeria (%)
Place of birth for the foreign-born population - Senegal (%)
Place of birth for the foreign-born population - Sierra Leone (%)
Place of birth for the foreign-born population - Other Western Africa (%)
Place of birth for the foreign-born population - Australia (%)
Place of birth for the foreign-born population - New Zealand (%)
Place of birth for the foreign-born population - Fiji (%)
Place of birth for the foreign-born population - Micronesia (%)
Place of birth for the foreign-born population - Bahamas (%)
Place of birth for the foreign-born population - Barbados (%)
Place of birth for the foreign-born population - Cuba (%)
Place of birth for the foreign-born population - Dominica (%)
Place of birth for the foreign-born population - Dominican Republic (%)
Place of birth for the foreign-born population - Grenada (%)
Place of birth for the foreign-born population - Haiti (%)
Place of birth for the foreign-born population - Jamaica (%)
Place of birth for the foreign-born population - St. Vincent and the Grenadines (%)
Place of birth for the foreign-born population - Trinidad and Tobago (%)
Place of birth for the foreign-born population - West Indies (%)
Place of birth for the foreign-born population - Other Caribbean (%)
Place of birth for the foreign-born population - Belize (%)
Place of birth for the foreign-born population - Costa Rica (%)
Place of birth for the foreign-born population - El Salvador (%)
Place of birth for the foreign-born population - Guatemala (%)
Place of birth for the foreign-born population - Honduras (%)
Place of birth for the foreign-born population - Mexico (%)
Place of birth for the foreign-born population - Nicaragua (%)
Place of birth for the foreign-born population - Panama (%)
Place of birth for the foreign-born population - Other Central America (%)
Place of birth for the foreign-born population - Argentina (%)
Place of birth for the foreign-born population - Bolivia (%)
Place of birth for the foreign-born population - Brazil (%)
Place of birth for the foreign-born population - Chile (%)
Place of birth for the foreign-born population - Colombia (%)
Place of birth for the foreign-born population - Ecuador (%)
Place of birth for the foreign-born population - Guyana (%)
Place of birth for the foreign-born population - Peru (%)
Place of birth for the foreign-born population - Uruguay (%)
Place of birth for the foreign-born population - Venezuela (%)
Place of birth for the foreign-born population - Other South America (%)
Place of birth for the foreign-born population - Canada (%)
Place of birth for the foreign-born population - Other Northern America (%)
Place of birth for the foreign-born population - Other (%)
Latest news about races in Denison, IA collected exclusively by city-data.com from local newspapers, TV, and radio stations
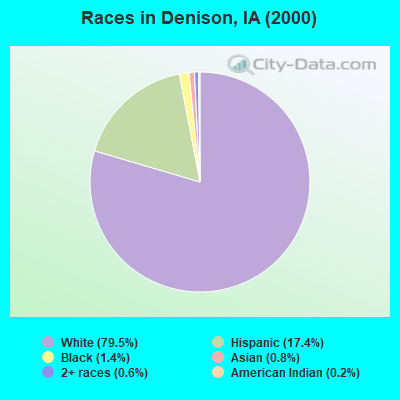
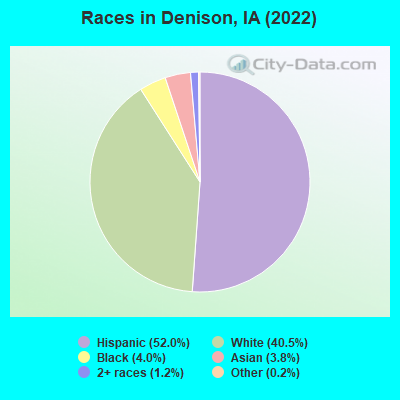
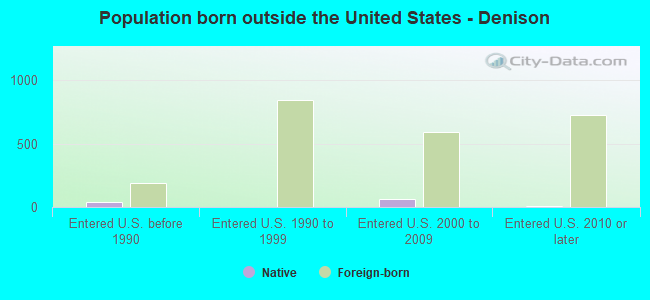
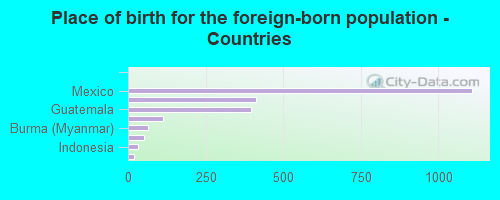
According to 2022 data, the most numerous races in Denison, IA are White alone (3,380 residents), Hispanic (4,339 residents), and Black alone (337 residents). 50.1% of Denison residents speak English at home. 27.8% of Denison, IA residents are foreign-born (22.6% born in Latin America), which is 82.0% greater than the foreign-born rate of 5.0% across the entire state of Iowa.
Race distribution in Denison
2000 2022
2,710,344 92.6% White alone 82,473 2.8% Hispanic 60,744 2.1% Black alone 36,345 1.2% Asian alone 25,472 0.9% Two or more races 7,955 0.3% American Indian alone 2,103 0.07% Other race alone 888 0.03% Native Hawaiian and Other
2,650,110 82.8% White alone 218,024 6.8% Hispanic 119,004 3.7% Black alone 115,286 3.6% Two or more races 74,892 2.3% Asian alone 9,260 0.3% Other race alone 8,595 0.3% Native Hawaiian and Other 5,346 0.2% American Indian alone
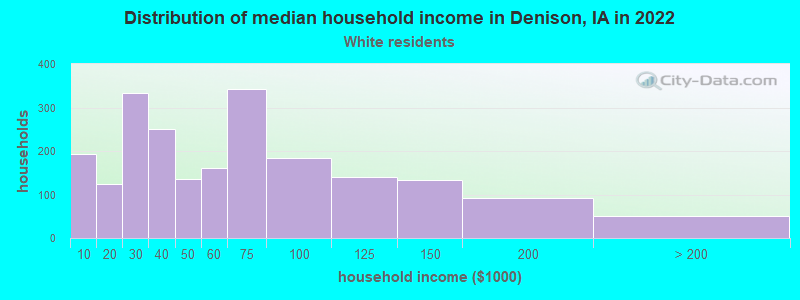
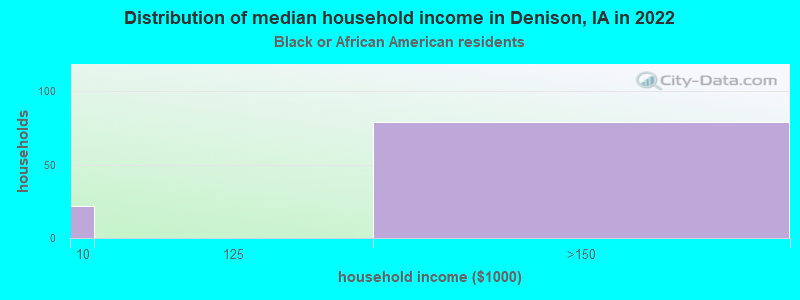
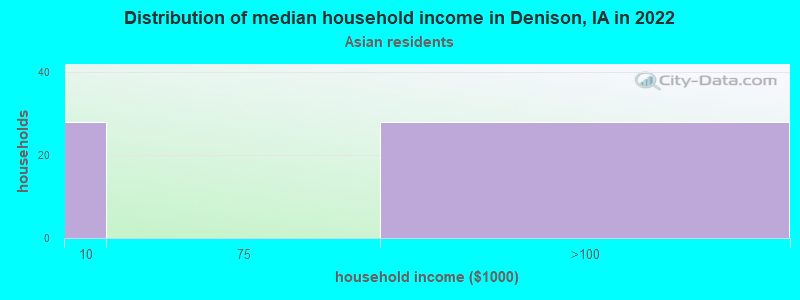
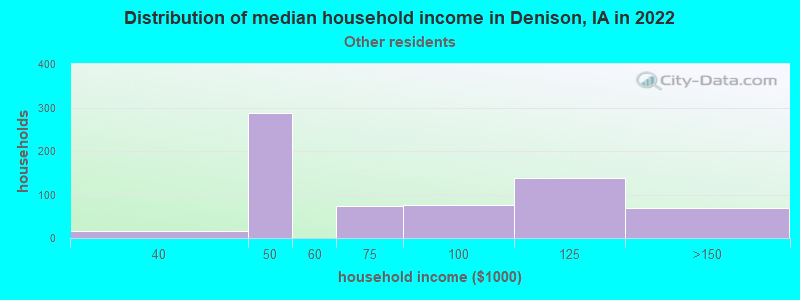
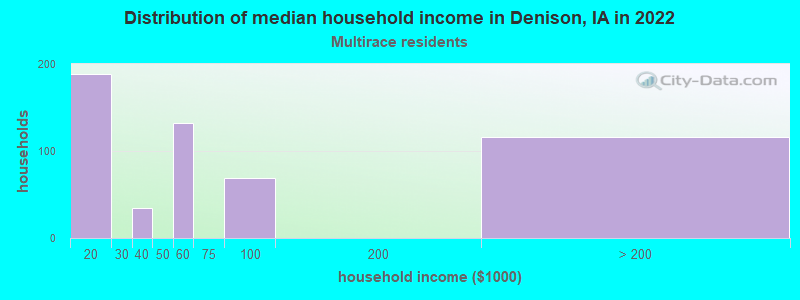
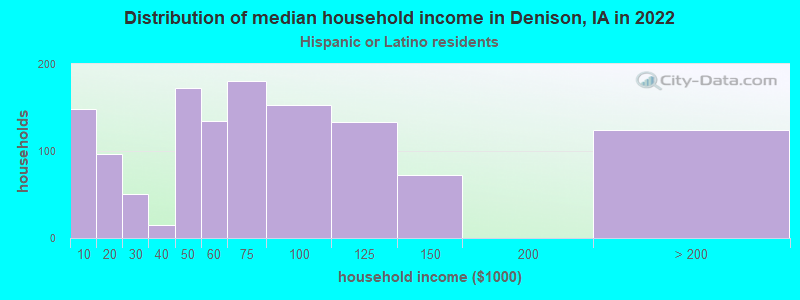
Income and house value in Denison Median household income in 2022 $52,374 White non-Hispanic householders$75,865 Some other race householders$65,232 Hispanic or Latino race householdersMedian 2022 house value $124,127 White Non-Hispanic householders$92,713 Some other race householders$95,600 Hispanic or Latino householders
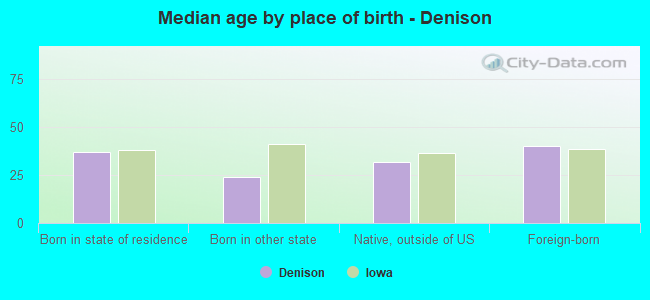
Median age by race in Denison
37.8 Median age for White residents34.8 40.3 36.1 Median age for Black or African American residents43.6 23.2 -660,397,073.5 Median age for American Indian / Alaska Native residents-654,282,765.1 -670,912,950.5 25.8 Median age for Asian residents27.7 25.3 -580,729,166.1 Median age for Native Hawaiian / Pacific Islander residents-776,978,416.5 -504,347,825.6 32.0 Median age for Other race residents26.4 32.9 24.0 Median age for Two or more races residents20.1 25.3 52.4 Median age for White alone residents52.4 53.7 24.5 Median age for Hispanic or Latino residents21.3 27.0
Owner/renter occupied households by race in Denison
House owners and renters - White residents 1,361 64.6% Owner occupied746 35.4% Renter occupiedHouse owners and renters - Black or African American residents 88 82.6% Owner occupied19 17.4% Renter occupiedHouse owners and renters - Asian residents 60 68.9% Owner occupied27 31.1% Renter occupiedHouse owners and renters - Other race residents 413 64.5% Owner occupied227 35.5% Renter occupiedHouse owners and renters - Two or more races residents 432 83.7% Owner occupied84 16.3% Renter occupiedHouse owners and renters - White alone residents 1,129 67.4% Owner occupied546 32.6% Renter occupiedHouse owners and renters - Hispanic or Latino residents 906 68.8% Owner occupied411 31.2% Renter occupied
Language usage in Denison
English speakers - Total 50.1% of residents of Denison speak English at home.
43.5% of residents speak Spanish at home 1,756 51.0% Speak English very well1,685 49.0% Speak English less than very well8.0% of residents speak other language at home 473 74.7% Speak English very well160 25.3% Speak English less than very well
English speakers - Born in the United States 53.6% of residents of Denison speak English at home.
38.1% of residents speak Spanish at home 781 95.0% Speak English very well41 5.0% Speak English less than very well5.6% of residents speak other language at home 121 100.0% Speak English very well
English speakers - Native, born elsewhere 57.5% of residents of Denison speak English at home.
33.6% of residents speak Spanish at home 22 57.9% Speak English very well16 42.1% Speak English less than very well
English speakers - Foreign-born 5.0% of residents of Denison speak English at home.
78.8% of residents speak Spanish at home 392 20.9% Speak English very well1,486 79.1% Speak English less than very well18.8% of residents speak other language at home 293 65.5% Speak English very well154 34.5% Speak English less than very well
White (Caucasian) - Speak another language Native:
19.5% (864)Foreign-born:
92.9% (374)
Black or African American - Speak another language Native:
60.7% (113)Foreign-born:
100.0% (170)
Asian - Speak another language Native:
65.9% (63)Foreign-born:
97.5% (218)
Other race - Speak only English Native:
23.1% (83)Foreign-born:
9.1% (93)
Other race - Speak another language Native:
69.2% (249)Foreign-born:
88.9% (914)
Two or more races - Speak only English Native:
51.8% (383)Foreign-born:
1.8% (17)
Two or more races - Speak another language Native:
56.1% (414)Foreign-born:
96.2% (909)
Hispanic or Latino - Speak only English Native:
24.3% (503)Foreign-born:
5.0% (102)
Hispanic or Latino - Speak another language Native:
69.5% (1,440)Foreign-born:
95.4% (1,930)
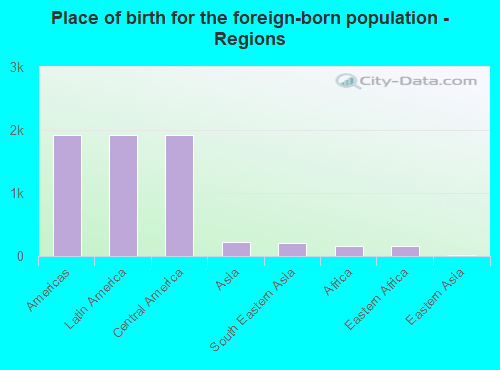
Foreign-born residents in Denison 2,317 residents are foreign born (22.6% Latin America ).
Marital status for residents in Denison Marital status - White (Caucasian) population 15 years and over
Males 34.6% Never married43.1% Now married1.3% Separated5.2% Widowed15.8% DivorcedFemales 29.8% Never married40.8% Now married3.4% Separated13.5% Widowed12.5% DivorcedWomen who gave birth in the past 12 months Now married:
100.0% (69)Unmarried:
0.0% (0)
Women who did not give birth in the past 12 months Now married:
28.5% (285)Unmarried:
71.5% (717)
Marital status - Black or African American population 15 years and over
Males 36.8% Never married58.1% Now married0.0% Separated0.0% Widowed5.1% DivorcedFemales 46.8% Never married53.2% Now married0.0% Separated0.0% Widowed0.0% DivorcedWomen who gave birth in the past 12 months Now married:
0.0% (0)Unmarried:
100.0% (9)
Women who did not give birth in the past 12 months Now married:
58.8% (49)Unmarried:
41.2% (34)
Marital status - Asian population 15 years and over
Males 55.7% Never married44.3% Now married0.0% Separated0.0% Widowed0.0% DivorcedFemales 14.4% Never married85.6% Now married0.0% Separated0.0% Widowed0.0% DivorcedWomen who did not give birth in the past 12 months Now married:
83.5% (105)Unmarried:
16.5% (21)
Marital status - Other race population 15 years and over
Males 38.9% Never married37.2% Now married8.3% Separated10.4% Widowed5.3% DivorcedFemales 28.5% Never married67.9% Now married0.0% Separated3.5% Widowed0.0% DivorcedWomen who did not give birth in the past 12 months Now married:
37.1% (80)Unmarried:
62.9% (136)
Marital status - Two or more races population 15 years and over
Males 22.2% Never married69.6% Now married0.0% Separated0.0% Widowed8.2% DivorcedFemales 43.6% Never married48.4% Now married0.0% Separated0.0% Widowed8.0% DivorcedWomen who gave birth in the past 12 months Now married:
100.0% (63)Unmarried:
0.0% (0)
Women who did not give birth in the past 12 months Now married:
36.5% (221)Unmarried:
63.5% (384)
Marital status - White alone, not Hispanic / Latino population 15 years and over
Males 27.1% Never married48.7% Now married2.0% Separated7.4% Widowed14.8% DivorcedFemales 23.3% Never married41.8% Now married0.7% Separated17.7% Widowed16.5% DivorcedWomen who gave birth in the past 12 months Now married:
100.0% (11)Unmarried:
0.0% (0)
Women who did not give birth in the past 12 months Now married:
24.7% (153)Unmarried:
75.3% (468)
Marital status - Hispanic or Latino population 15 years and over
Males 40.5% Never married40.5% Now married2.6% Separated3.9% Widowed12.5% DivorcedFemales 42.4% Never married49.9% Now married4.5% Separated0.9% Widowed2.4% DivorcedWomen who gave birth in the past 12 months Now married:
100.0% (112)Unmarried:
0.0% (0)
Women who did not give birth in the past 12 months Now married:
36.0% (382)Unmarried:
64.0% (678)
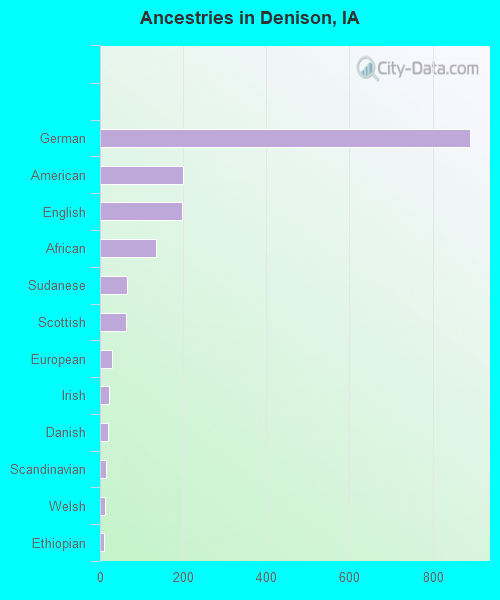
Ancestries in Denison
891 16.9% German199 3.8% American198 3.8% English135 2.6% African64 1.2% Sudanese62 1.2% Scottish29 0.6% European22 0.4% Irish20 0.4% Danish15 0.3% Scandinavian13 0.2% Welsh10 0.2% Ethiopian8 0.2% Eastern European
Children Nativity (place of birth) in Denison
Children under 6 years - Living with two parents Both parents native 160 100.0% NativeBoth parents foreign-born 83 100.0% NativeOne native, one foreign-born parent 112 100.0% NativeChildren under 6 years - Living with one parent Native parent 159 100.0% NativeForeign-born parent 38 33.5% Native76 66.5% Foreign-bornChildren 6 to 17 years - Living with two parents Both parents native 242 100.0% NativeBoth parents foreign-born 366 100.0% NativeOne native, one foreign-born parent 102 100.0% NativeChildren 6 to 17 years - Living with one parent Foreign-born parent 660 59.3% Native453 40.7% Foreign-born
Grandparents responsible for own grandchildren in Denison
Grandparents (30 to 59 years) White / Caucasian 7 100.0% Not responsible for grandchildrenOther race 29 34.6% Responsible for grandchildren55 65.4% Not responsible for grandchildrenHispanic or Latino 20 45.3% Responsible for grandchildren25 54.7% Not responsible for grandchildrenGrandparents (60 years and over) White / Caucasian 7 14.1% Responsible for grandchildren40 85.9% Not responsible for grandchildrenHispanic or Latino 3 46.3% Responsible for grandchildren4 53.7% Not responsible for grandchildren