Races in Derby, Kansas (KS) Detailed Stats
Ancestries, Foreign-born residents, place of birth
Settings
X


Recent posts about races in Derby, Kansas on our local forum with over 2,400,000 registered users:

Latest news about races in Derby, KS collected exclusively by city-data.com from local newspapers, TV, and radio stations
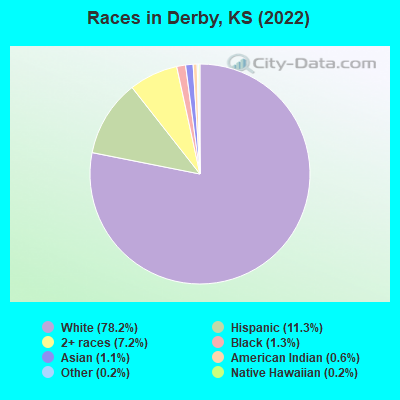
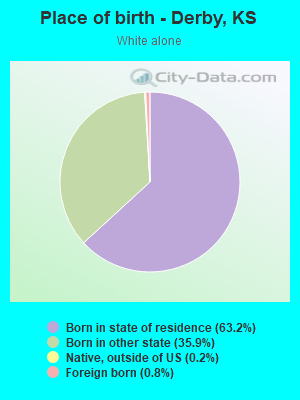
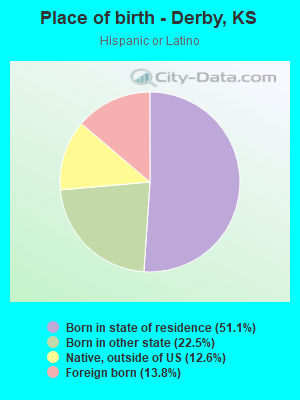
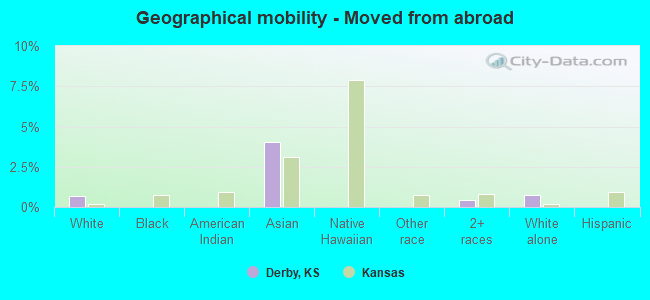
According to 2022 data, the most numerous races in Derby, KS are White alone (20,100 residents), Hispanic (2,900 residents), and Black alone (331 residents). 94.8% of Derby residents speak English at home. 3.1% of Derby, KS residents are foreign-born (1.6% born in Latin America, 0.8% born in Asia, 0.4% born in Europe), which is 123.9% less than the foreign-born rate of 7.0% across the entire state of Kansas.
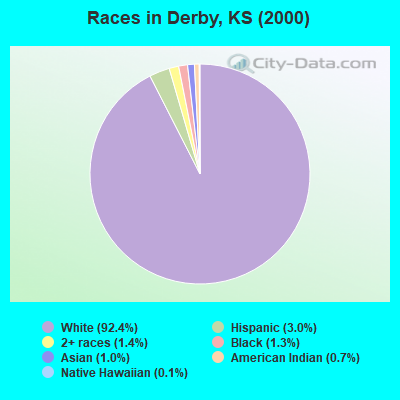
Race distribution in Derby
2000
2022

- 16,44692.4%White alone
- 5333.0%Hispanic
- 2531.4%Two or more races
- 2371.3%Black alone
- 1761.0%Asian alone
- 1220.7%American Indian alone
- 170.10%Other race alone
- 230.1%Native Hawaiian and Other
Pacific Islander alone
-
- 20,10078.2%White alone
- 2,90011.3%Hispanic
- 1,8397.2%Two or more races
- 3311.3%Black alone
- 2951.1%Asian alone
- 1450.6%American Indian alone
- 630.2%Other race alone
- 450.2%Native Hawaiian and Other
Pacific Islander alone
2000
2022
-
- 2,233,99783.1%White alone
- 188,2527.0%Hispanic
- 151,4075.6%Black alone
- 46,3011.7%Asian alone
- 42,5081.6%Two or more races
- 22,3220.8%American Indian alone
- 2,4770.09%Other race alone
- 1,1540.04%Native Hawaiian and Other
Pacific Islander alone

-
- 2,147,94373.1%White alone
- 381,74613.0%Hispanic
- 147,6665.0%Black alone
- 145,3624.9%Two or more races
- 85,0852.9%Asian alone
- 13,2630.5%Other race alone
- 12,0650.4%American Indian alone
- 4,0200.1%Native Hawaiian and Other
Pacific Islander alone

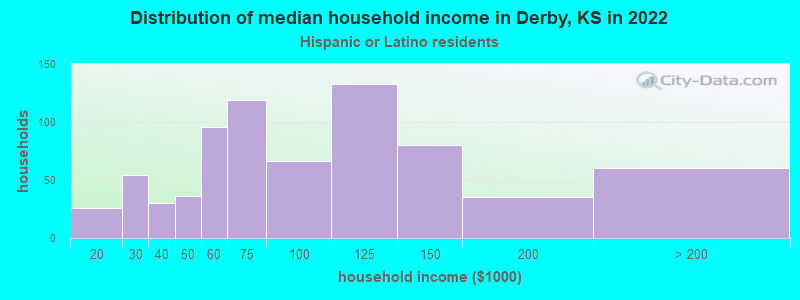
Income and house value in Derby
- Median household income in 2022
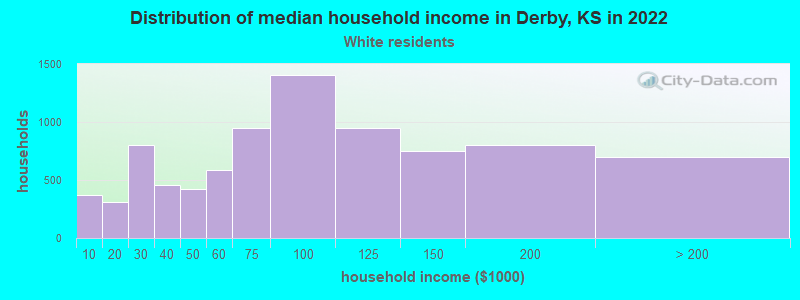
- $79,196White non-Hispanic householders
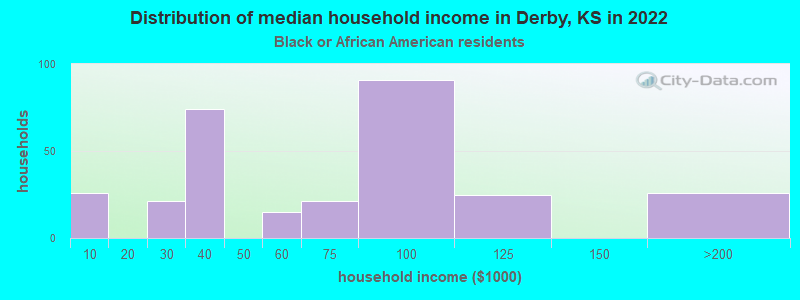
- $76,194Black householders
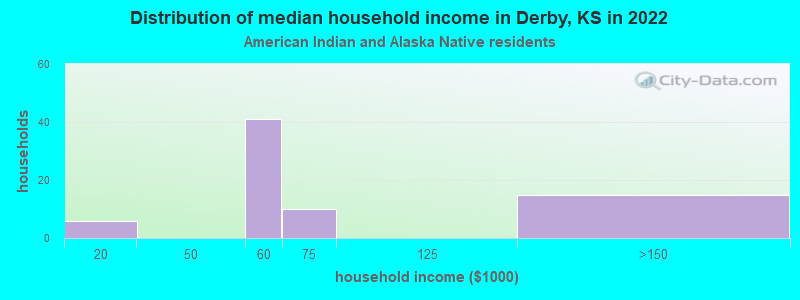
- $44,270American Indian and Alaska Native householders
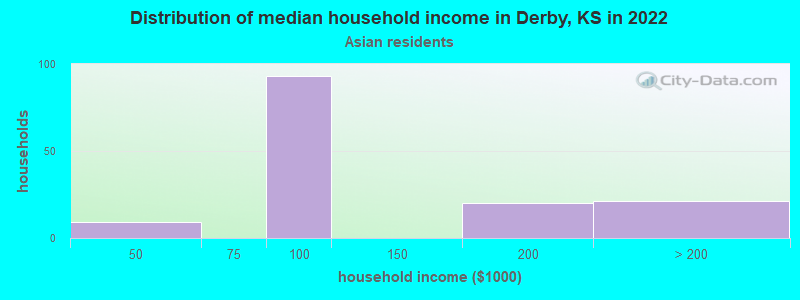
- $86,814Asian householders
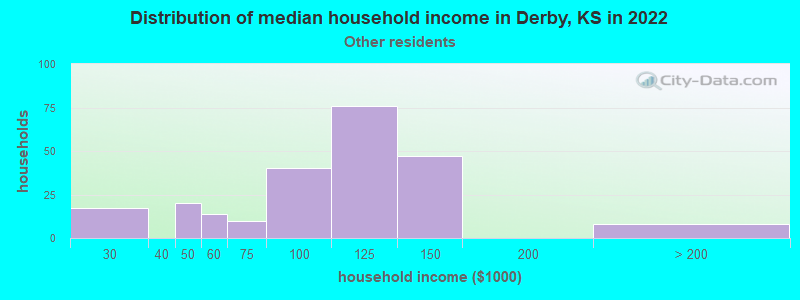
- $98,025Some other race householders
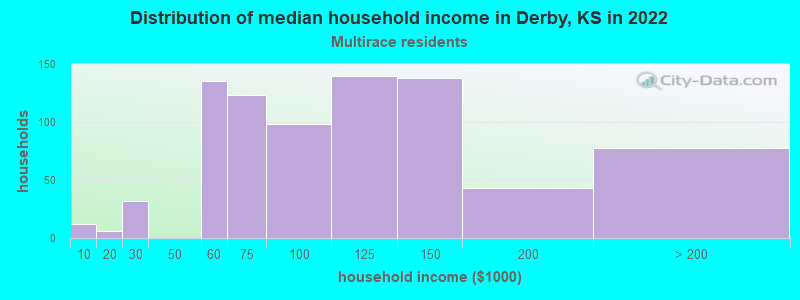
- $96,361Two or more races householders
- $63,158Hispanic or Latino race householders
- Median 2022 house value
- $241,527White Non-Hispanic householders
- $227,855Black or African American householders
- $187,525American Indian or Alaska Native householders
- $196,639Asian householders
- $162,005Some other race householders
- $197,550Two or more races householders
- $191,854Hispanic or Latino householders
Household income for White non-Hispanic householders
Household income for Black householders
Household income for American Indian and Alaska Native householders
Household income for Asian householders
Household income for Native Hawaiian and other Pacific Islander householders

Household income for Some other race householders
Household income for Two or more races householders
Household income for Hispanic or Latino race householders
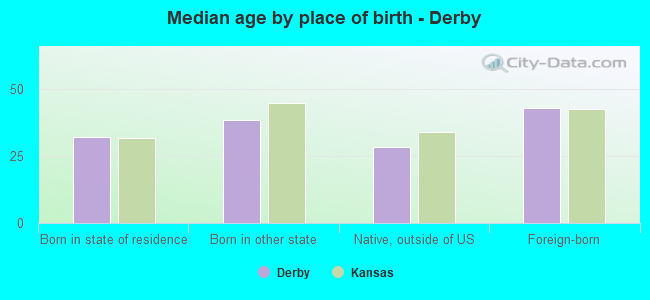
Median age by race in Derby
- 38.6Median age for White residents
- 36.4Males
- 40.9Females
- 63.9Median age for Black or African American residents
- 74.6Males
- 60.7Females
- 25.6Median age for American Indian / Alaska Native residents
- 29.0Males
- 38.2Females
- 36.4Median age for Asian residents
- 39.5Males
- 32.8Females
- 98.0Median age for Native Hawaiian / Pacific Islander residents
- -1,324,483,774.5Males
- -827,083,332.5Females
- 17.7Median age for Other race residents
- 22.4Males
- 18.6Females
- 21.0Median age for Two or more races residents
- 20.3Males
- 29.0Females
- 38.6Median age for White alone residents
- 37.1Males
- 41.2Females
- 23.7Median age for Hispanic or Latino residents
- 23.9Males
- 20.4Females
Owner/renter occupied households by race in Derby
- House owners and renters - White residents
- 6,19571.5%Owner occupied
- 2,47128.5%Renter occupied
- House owners and renters - Black or African American residents
- 16758.6%Owner occupied
- 11841.4%Renter occupied
- House owners and renters - American Indian / Alaska Native residents
- 3048.4%Owner occupied
- 3251.6%Renter occupied
- House owners and renters - Asian residents
- 7665.5%Owner occupied
- 4034.5%Renter occupied
- House owners and renters - Native Hawaiian / Pacific Islander residents
- 30100.0%Renter occupied
- House owners and renters - Other race residents
- 20382.3%Owner occupied
- 4417.7%Renter occupied
- House owners and renters - Two or more races residents
- 48062.0%Owner occupied
- 29438.0%Renter occupied
- House owners and renters - White alone residents
- 6,16671.9%Owner occupied
- 2,41528.1%Renter occupied
- House owners and renters - Hispanic or Latino residents
- 49865.8%Owner occupied
- 25934.2%Renter occupied
Language usage in Derby
- English speakers - Total
- 94.8% of residents of Derby speak English at home.
- 4.5% of residents speak Spanish at home
- 62657.6%Speak English very well
- 46142.4%Speak English less than very well
- 1.8% of residents speak other language at home
- 39389.3%Speak English very well
- 4710.7%Speak English less than very well
- English speakers - Born in the United States
- 96.4% of residents of Derby speak English at home.
- 2.3% of residents speak Spanish at home
- 18192.3%Speak English very well
- 157.7%Speak English less than very well
- 1.3% of residents speak other language at home
- 111100.0%Speak English very well
- English speakers - Native, born elsewhere
- 39.9% of residents of Derby speak English at home.
- 59.9% of residents speak Spanish at home
- 20064.9%Speak English very well
- 10835.1%Speak English less than very well
- English speakers - Foreign-born
- 37.1% of residents of Derby speak English at home.
- 44.9% of residents speak Spanish at home
- 14039.4%Speak English very well
- 21560.6%Speak English less than very well
- 24.3% of residents speak other language at home
- 17289.6%Speak English very well
- 2010.4%Speak English less than very well
White (Caucasian) - Speak only English
| Native: | 99.9% (19,229) |
| Foreign-born: | 98.9% (125) |
White (Caucasian) - Speak another language
| Native: | 1.2% (229) |
| Foreign-born: | 27.4% (34) |
Asian - Speak only English
| Native: | 78.5% (71) |
| Foreign-born: | 53.5% (103) |
Asian - Speak another language
| Native: | 25.6% (23) |
| Foreign-born: | 56.7% (109) |
Other race - Speak another language
| Native: | 55.2% (461) |
| Foreign-born: | 100.0% (286) |
Two or more races - Speak only English
| Native: | 91.1% (2,593) |
| Foreign-born: | 22.7% (41) |
Two or more races - Speak another language
| Native: | 9.4% (268) |
| Foreign-born: | 80.1% (145) |
White alone - Speak only English
| Native: | 98.9% (18,607) |
| Foreign-born: | 69.0% (107) |
White alone - Speak another language
| Native: | 1.2% (220) |
| Foreign-born: | 23.7% (37) |
Hispanic or Latino - Speak only English
| Native: | 75.0% (1,666) |
| Foreign-born: | 8.2% (32) |
Hispanic or Latino - Speak another language
| Native: | 29.2% (649) |
| Foreign-born: | 91.9% (364) |
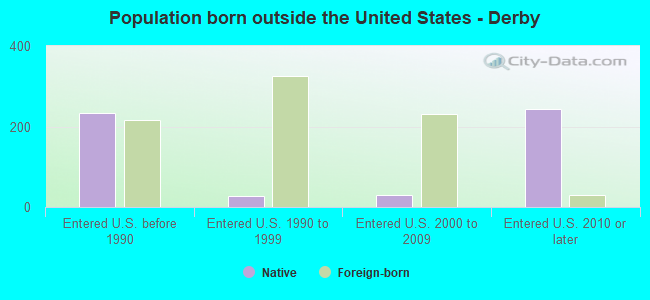
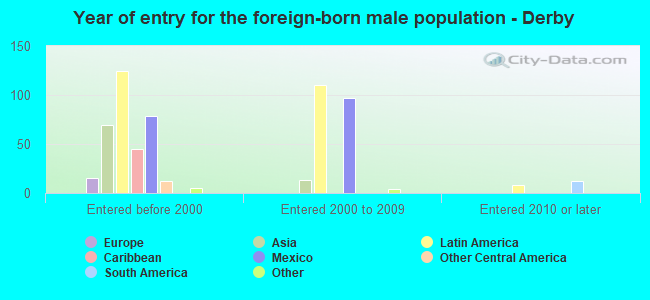
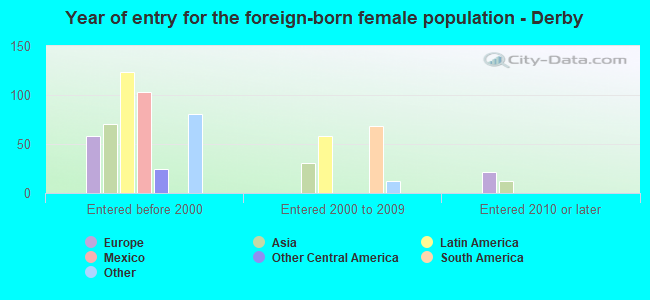
Foreign-born residents in Derby
803 residents are foreign born (1.6% Latin America, 0.8% Asia, 0.4% Europe).
| This city: | 3.1% |
| Kansas: | 7.1% |

Marital status for residents in Derby
Marital status - White (Caucasian) population 15 years and over
- Males
- 26.2%Never married
- 63.1%Now married
- 1.3%Separated
- 1.9%Widowed
- 7.6%Divorced
- Females
- 18.7%Never married
- 55.9%Now married
- 0.9%Separated
- 11.9%Widowed
- 12.5%Divorced
Women who gave birth in the past 12 months
| Now married: | 83.6% (170) |
| Unmarried: | 16.4% (33) |
Women who did not give birth in the past 12 months
| Now married: | 58.4% (2,325) |
| Unmarried: | 41.6% (1,658) |
Marital status - Black or African American population 15 years and over
- Males
- 28.2%Never married
- 63.6%Now married
- 0.0%Separated
- 0.0%Widowed
- 8.3%Divorced
- Females
- 22.5%Never married
- 4.4%Now married
- 10.4%Separated
- 40.7%Widowed
- 22.0%Divorced
Women who did not give birth in the past 12 months
| Now married: | 0.0% (0) |
| Unmarried: | 100.0% (60) |
Marital status - American Indian / Alaska Native population 15 years and over
- Males
- 67.2%Never married
- 9.0%Now married
- 0.0%Separated
- 0.0%Widowed
- 23.9%Divorced
- Females
- 38.5%Never married
- 25.6%Now married
- 0.0%Separated
- 0.0%Widowed
- 35.9%Divorced
Women who did not give birth in the past 12 months
| Now married: | 40.0% (11) |
| Unmarried: | 60.0% (17) |
Marital status - Asian population 15 years and over
- Males
- 27.5%Never married
- 51.0%Now married
- 0.0%Separated
- 0.0%Widowed
- 21.6%Divorced
- Females
- 49.7%Never married
- 42.0%Now married
- 0.0%Separated
- 8.3%Widowed
- 0.0%Divorced
Women who did not give birth in the past 12 months
| Now married: | 38.6% (49) |
| Unmarried: | 61.4% (78) |
Marital status - Native Hawaiian / Pacific Islander population 15 years and over
- Males
- 30.0%Never married
- 70.0%Now married
- 0.0%Separated
- 0.0%Widowed
- 0.0%Divorced
- Females
- 0.0%Never married
- 0.0%Now married
- 0.0%Separated
- 0.0%Widowed
- 100.0%Divorced
Women who did not give birth in the past 12 months
| Now married: | 0.0% (0) |
| Unmarried: | 100.0% (6) |
Marital status - Other race population 15 years and over
- Males
- 24.4%Never married
- 59.4%Now married
- 0.0%Separated
- 0.0%Widowed
- 16.2%Divorced
- Females
- 35.4%Never married
- 52.6%Now married
- 0.0%Separated
- 0.0%Widowed
- 12.0%Divorced
Women who did not give birth in the past 12 months
| Now married: | 48.9% (164) |
| Unmarried: | 51.1% (172) |
Marital status - Two or more races population 15 years and over
- Males
- 44.6%Never married
- 50.7%Now married
- 3.0%Separated
- 0.0%Widowed
- 1.6%Divorced
- Females
- 30.7%Never married
- 62.2%Now married
- 0.0%Separated
- 0.4%Widowed
- 6.7%Divorced
Women who gave birth in the past 12 months
| Now married: | 100.0% (57) |
| Unmarried: | 0.0% (0) |
Women who did not give birth in the past 12 months
| Now married: | 58.7% (606) |
| Unmarried: | 41.3% (426) |
Marital status - White alone, not Hispanic / Latino population 15 years and over
- Males
- 25.2%Never married
- 64.3%Now married
- 0.8%Separated
- 2.0%Widowed
- 7.7%Divorced
- Females
- 18.0%Never married
- 56.0%Now married
- 0.9%Separated
- 12.2%Widowed
- 12.8%Divorced
Women who gave birth in the past 12 months
| Now married: | 83.6% (176) |
| Unmarried: | 16.4% (35) |
Women who did not give birth in the past 12 months
| Now married: | 58.8% (2,317) |
| Unmarried: | 41.2% (1,623) |
Marital status - Hispanic or Latino population 15 years and over
- Males
- 34.5%Never married
- 52.3%Now married
- 6.8%Separated
- 0.0%Widowed
- 6.4%Divorced
- Females
- 38.5%Never married
- 54.5%Now married
- 0.0%Separated
- 0.0%Widowed
- 7.0%Divorced
Women who gave birth in the past 12 months
| Now married: | 100.0% (32) |
| Unmarried: | 0.0% (0) |
Women who did not give birth in the past 12 months
| Now married: | 49.9% (383) |
| Unmarried: | 50.1% (384) |
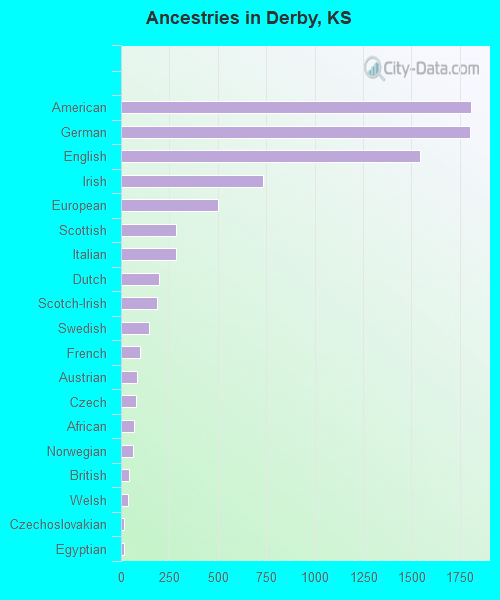
Ancestries in Derby

- 1,81016.2%American
- 1,80116.1%German
- 1,54213.8%English
- 7356.6%Irish
- 4994.5%European
- 2862.6%Scottish
- 2852.6%Italian
- 1961.8%Dutch
- 1881.7%Scotch-Irish
- 1441.3%Swedish
- 960.9%French
- 840.8%Austrian
- 770.7%Czech
- 660.6%African
- 600.5%Norwegian
- 390.3%British
- 360.3%Welsh
- 180.2%Czechoslovakian
- 170.2%Egyptian
- 120.1%Danish
- 120.1%Portuguese
- 100.09%Polish
- 100.09%Scandinavian
- 90.08%Northern European
- 60.05%Hungarian
- 40.04%Eastern European
- 40.04%Ukrainian
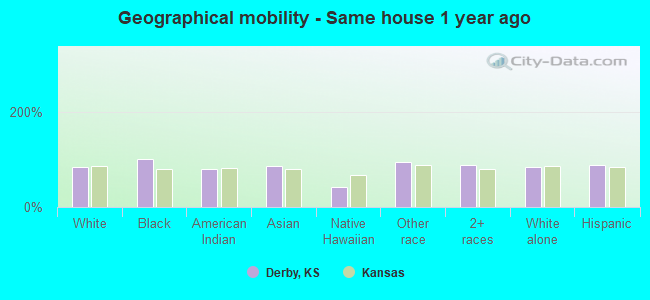
Geographical mobility in Derby

- Same house 1 year ago
- 16,96984.5%White (Caucasian)
- 363100.0%Black or African American
- 20380.4%American Indian / Alaska Native
- 24884.7%Asian
- 1642.1%Native Hawaiian / Pacific Islander
- 1,29993.6%Other race
- 2,86687.9%Two or more races
- 16,84384.5%White alone, not Hispanic / Latino
- 2,58488.5%Hispanic or Latino
-
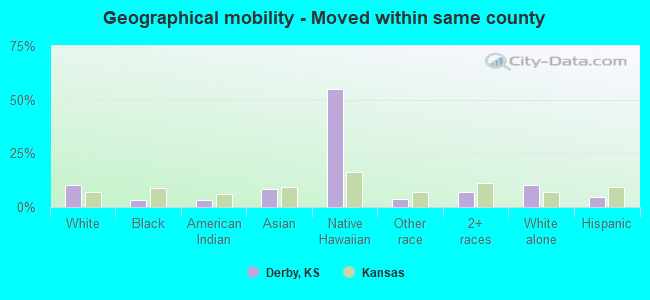
- Moved within same county
- 2,06510.3%White / Caucasian
- 113.1%Black or African American
- 93.4%American Indian / Alaska Native
- 248.4%Asian
- 2155.2%Native Hawaiian / Pacific Islander
- 513.6%Other race
- 2297.0%Two or more races
- 2,07610.4%White alone, not Hispanic / Latino
- 1324.5%Hispanic or Latino
-
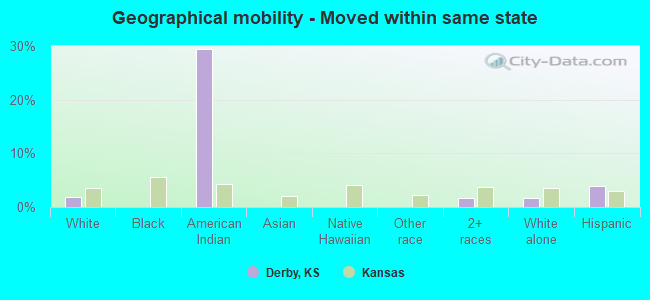
- Moved within same state
- 3701.8%White / Caucasian
- 7529.5%American Indian / Alaska Native
- 561.7%Two or more races
- 3211.6%White alone, not Hispanic / Latino
- 1164.0%Hispanic or Latino
-
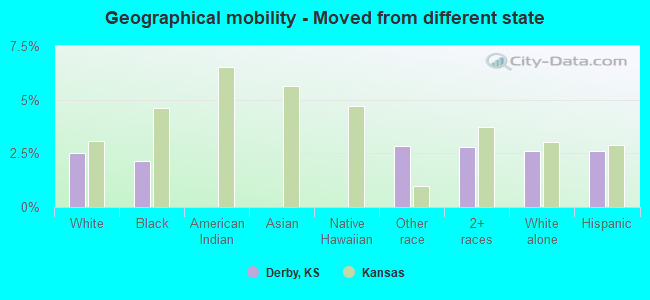
- Moved from different state
- 5092.5%White / Caucasian
- 82.1%Black or African American
- 392.8%Other race
- 922.8%Two or more races
- 5172.6%White alone, not Hispanic / Latino
- 762.6%Hispanic or Latino
-
- Moved from abroad
- 1380.7%White
- 124.0%Asian
- 140.4%Two or more races
- 1530.8%White alone, not Hispanic / Latino
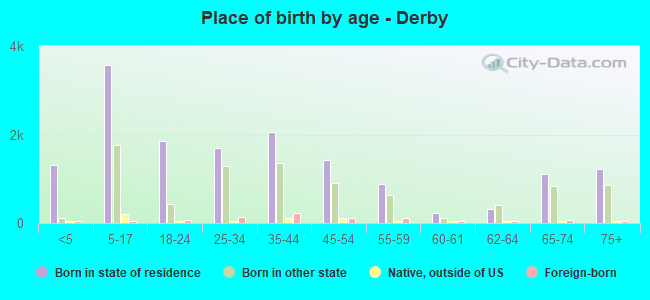
Children Nativity (place of birth) in Derby
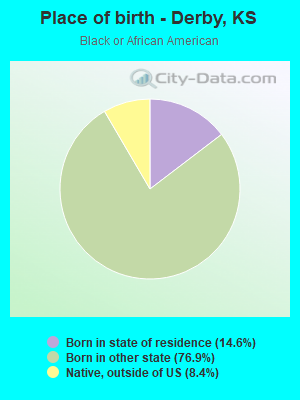
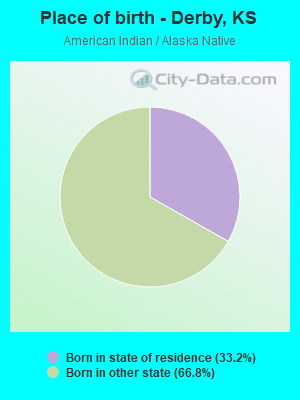
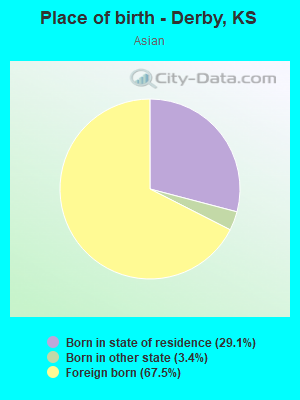
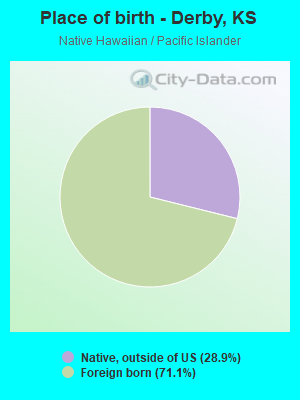
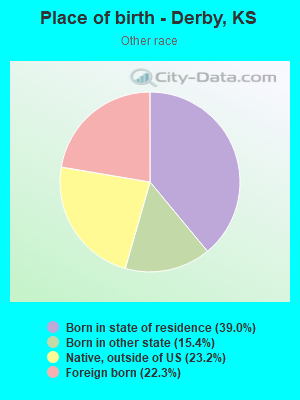
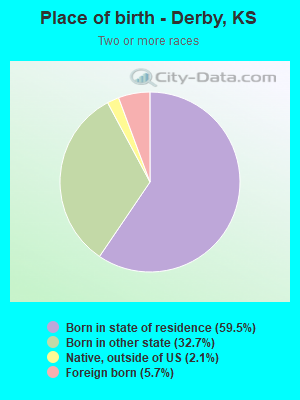
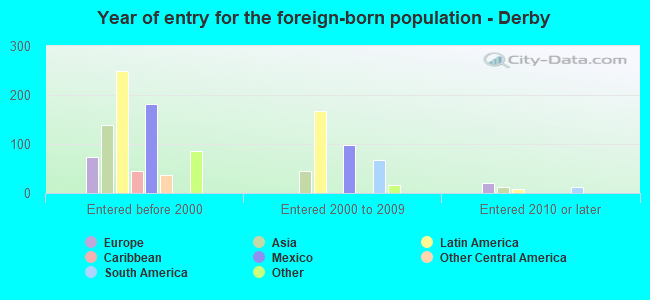
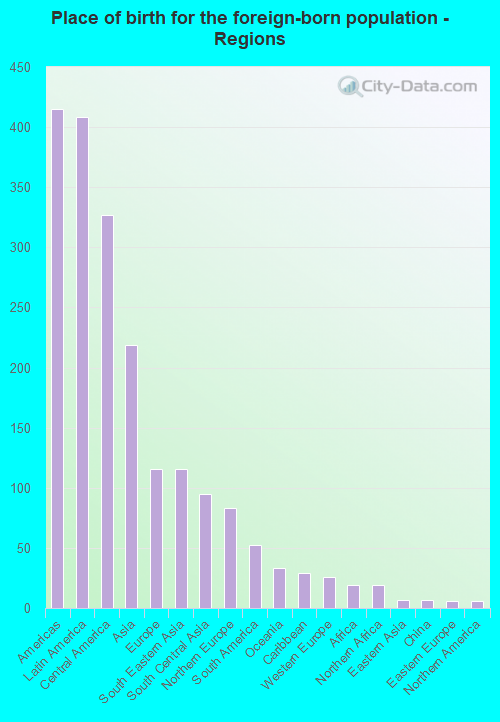
Place of birth for residents in Derby
![Place of birth for the foreign-born population - Regions]()
- 415Americas
- 408Latin America
- 327Central America
- 219Asia
- 116Europe
- 116South Eastern Asia
- 95South Central Asia
- 83Northern Europe
- 52South America
- 33Oceania
- 29Caribbean
- 26Western Europe
- 19Africa
- 19Northern Africa
- 7Eastern Asia
- 7China
- 6Eastern Europe
- 6Northern America
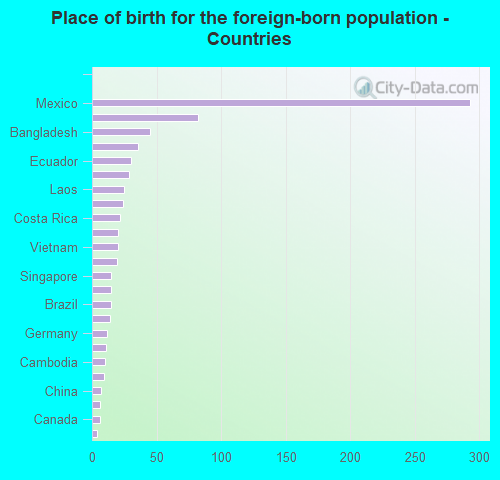
![Place of birth for the foreign-born population - Countries]()
- 293Mexico
- 82England
- 45Bangladesh
- 36India
- 30Ecuador
- 29Cuba
- 25Laos
- 24Thailand
- 22Costa Rica
- 20Philippines
- 20Vietnam
- 19Egypt
- 15Singapore
- 15Micronesia
- 15Brazil
- 14Netherlands
- 12Germany
- 11Belize
- 10Cambodia
- 9Pakistan
- 7China
- 6Ukraine
- 6Canada
- 4Kazakhstan
- 1United Kingdom
Grandparents responsible for own grandchildren in Derby
Zip codes: 67037.