Races in Derry, New Hampshire (NH) Detailed Stats
Data:
Races - White alone (%)
Races - White alone (% change since 2000)
Races - Black alone (%)
Races - Black alone (% change since 2000)
Races - American Indian alone (%)
Races - American Indian alone (% change since 2000)
Races - Asian alone (%)
Races - Asian alone (% change since 2000)
Races - Hispanic (%)
Races - Hispanic (% change since 2000)
Races - Native Hawaiian and Other Pacific Islander alone (%)
Races - Native Hawaiian and Other Pacific Islander alone (% change since 2000)
Races - Two or more races(%)
Races - Two or more races(% change since 2000)
Races - Other race alone (%)
Races - Other race alone (% change since 2000)
Racial diversity
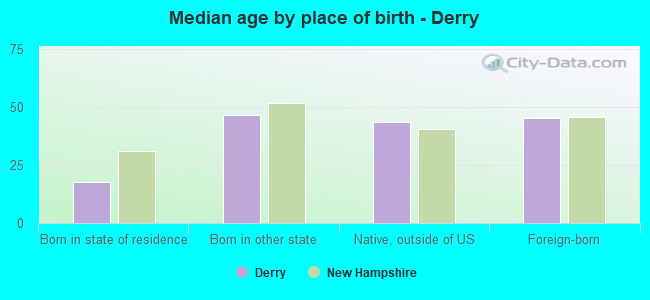
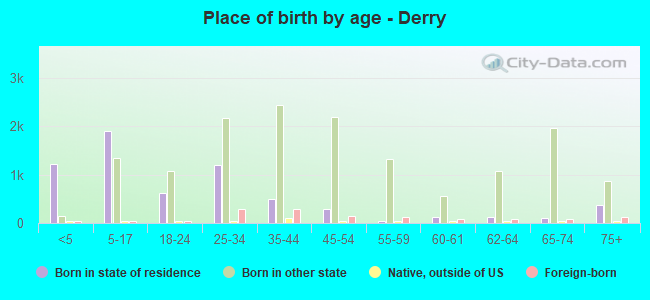
Place of birth - Born in state of residence (%)
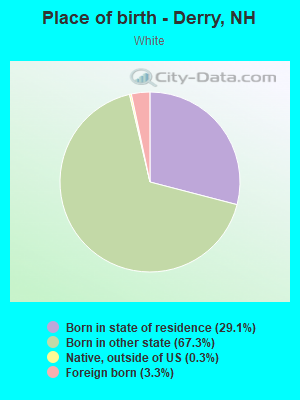
Place of birth - Born in state of residence (%) - White
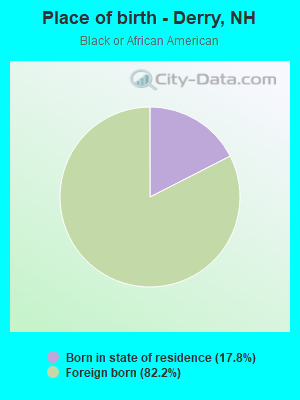
Place of birth - Born in state of residence (%) - Black or African American
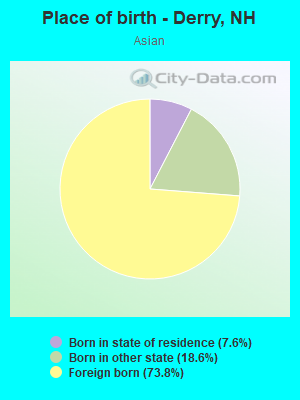
Place of birth - Born in state of residence (%) - Asian
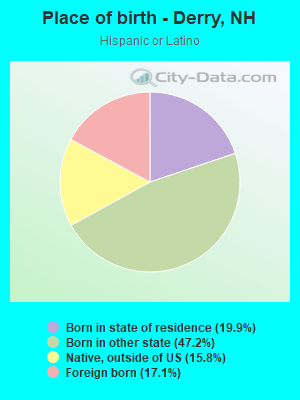
Place of birth - Born in state of residence (%) - Hispanic or Latino
Place of birth - Born in state of residence (%) - American Indian and Alaska Native
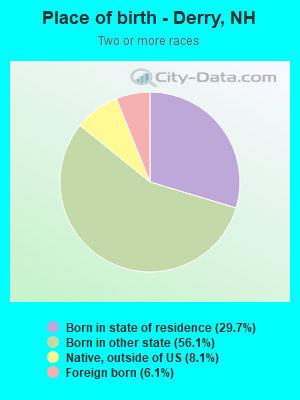
Place of birth - Born in state of residence (%) - Multirace
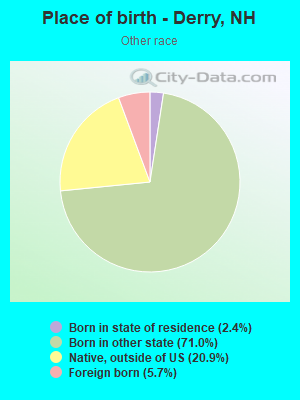
Place of birth - Born in state of residence (%) - Other Race
Place of birth - Born in other state (%)
Place of birth - Born in other state (%) - White
Place of birth - Born in other state (%) - Black or African American
Place of birth - Born in other state (%) - Asian
Place of birth - Born in other state (%) - Hispanic or Latino
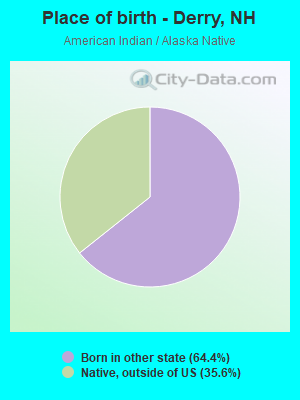
Place of birth - Born in other state (%) - American Indian and Alaska Native
Place of birth - Born in other state (%) - Multirace
Place of birth - Born in other state (%) - Other Race
Place of birth - Native, outside of US (%)
Place of birth - Native, outside of US (%) - White
Place of birth - Native, outside of US (%) - Black or African American
Place of birth - Native, outside of US (%) - Asian
Place of birth - Native, outside of US (%) - Hispanic or Latino
Place of birth - Native, outside of US (%) - American Indian and Alaska Native
Place of birth - Native, outside of US (%) - Multirace
Place of birth - Native, outside of US (%) - Other Race
Place of birth - Foreign born (%)
Place of birth - Foreign born (%) - White
Place of birth - Foreign born (%) - Black or African American
Place of birth - Foreign born (%) - Asian
Place of birth - Foreign born (%) - Hispanic or Latino
Place of birth - Foreign born (%) - American Indian and Alaska Native
Place of birth - Foreign born (%) - Multirace
Place of birth - Foreign born (%) - Other Race
Residents speaking English at home (%)
Residents speaking English at home - Born in the United States (%)
Residents speaking English at home - Native, born elsewhere (%)
Residents speaking English at home - Foreign born (%)
Residents speaking Spanish at home (%)
Residents speaking Spanish at home - Born in the United States (%)
Residents speaking Spanish at home - Native, born elsewhere (%)
Residents speaking Spanish at home - Foreign born (%)
Residents speaking other language at home (%)
Residents speaking other language at home - Born in the United States (%)
Residents speaking other language at home - Native, born elsewhere (%)
Residents speaking other language at home - Foreign born (%)
Marital status - Never married (%)
Marital status - Now married (%)
Marital status - Separated (%)
Marital status - Widowed (%)
Marital status - Divorced (%)
Ancestries Reported - Arab (%)
Ancestries Reported - Czech (%)
Ancestries Reported - Danish (%)
Ancestries Reported - Dutch (%)
Ancestries Reported - English (%)
Ancestries Reported - French (%)
Ancestries Reported - French Canadian (%)
Ancestries Reported - German (%)
Ancestries Reported - Greek (%)
Ancestries Reported - Hungarian (%)
Ancestries Reported - Irish (%)
Ancestries Reported - Italian (%)
Ancestries Reported - Lithuanian (%)
Ancestries Reported - Norwegian (%)
Ancestries Reported - Polish (%)
Ancestries Reported - Portuguese (%)
Ancestries Reported - Russian (%)
Ancestries Reported - Scotch-Irish (%)
Ancestries Reported - Scottish (%)
Ancestries Reported - Slovak (%)
Ancestries Reported - Subsaharan African (%)
Ancestries Reported - Swedish (%)
Ancestries Reported - Swiss (%)
Ancestries Reported - Ukrainian (%)
Ancestries Reported - United States (%)
Ancestries Reported - Welsh (%)
Ancestries Reported - West Indian (%)
Ancestries Reported - Other (%)
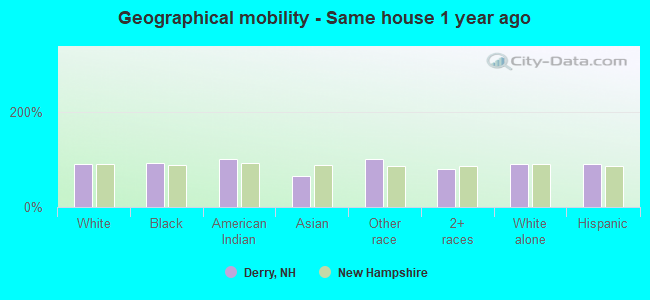
Geographical mobility - Same house 1 year ago (%)
Geographical mobility - Same house 1 year ago (%) - White
Geographical mobility - Same house 1 year ago (%) - Black or African American
Geographical mobility - Same house 1 year ago (%) - Asian
Geographical mobility - Same house 1 year ago (%) - Hispanic or Latino
Geographical mobility - Same house 1 year ago (%) - American Indian and Alaska Native
Geographical mobility - Same house 1 year ago (%) - Multirace
Geographical mobility - Same house 1 year ago (%) - Other Race
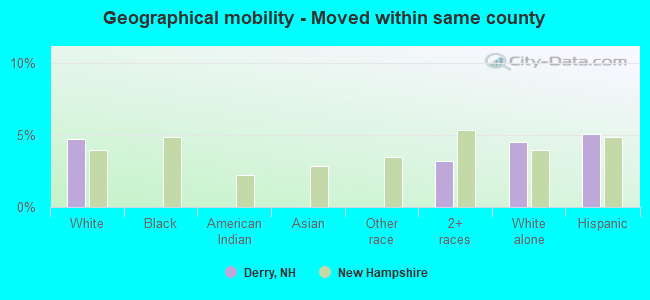
Geographical mobility - Moved within same county (%)
Geographical mobility - Moved within same county (%) - White
Geographical mobility - Moved within same county (%) - Black or African American
Geographical mobility - Moved within same county (%) - Asian
Geographical mobility - Moved within same county (%) - Hispanic or Latino
Geographical mobility - Moved within same county (%) - American Indian and Alaska Native
Geographical mobility - Moved within same county (%) - Multirace
Geographical mobility - Moved within same county (%) - Other Race
Geographical mobility - Moved from different county within same state (%)
Geographical mobility - Moved from different county within same state (%) - White
Geographical mobility - Moved from different county within same state (%) - Black or African American
Geographical mobility - Moved from different county within same state (%) - Asian
Geographical mobility - Moved from different county within same state (%) - Hispanic or Latino
Geographical mobility - Moved from different county within same state (%) - American Indian and Alaska Native
Geographical mobility - Moved from different county within same state (%) - Multirace
Geographical mobility - Moved from different county within same state (%) - Other Race
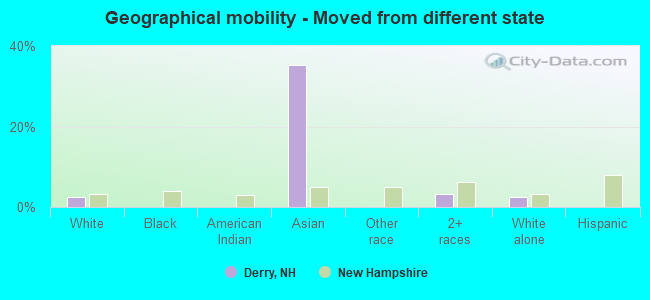
Geographical mobility - Moved from different state (%)
Geographical mobility - Moved from different state (%) - White
Geographical mobility - Moved from different state (%) - Black or African American
Geographical mobility - Moved from different state (%) - Asian
Geographical mobility - Moved from different state (%) - Hispanic or Latino
Geographical mobility - Moved from different state (%) - American Indian and Alaska Native
Geographical mobility - Moved from different state (%) - Multirace
Geographical mobility - Moved from different state (%) - Other Race
Geographical mobility - Moved from abroad (%)
Geographical mobility - Moved from abroad (%) - White
Geographical mobility - Moved from abroad (%) - Black or African American
Geographical mobility - Moved from abroad (%) - Asian
Geographical mobility - Moved from abroad (%) - Hispanic or Latino
Geographical mobility - Moved from abroad (%) - American Indian and Alaska Native
Geographical mobility - Moved from abroad (%) - Multirace
Geographical mobility - Moved from abroad (%) - Other Race
Place of birth for the foreign-born population - Ireland (%)
Place of birth for the foreign-born population - Denmark (%)
Place of birth for the foreign-born population - Norway (%)
Place of birth for the foreign-born population - Sweden (%)
Place of birth for the foreign-born population - United Kingdom (%)
Place of birth for the foreign-born population - England (%)
Place of birth for the foreign-born population - Scotland (%)
Place of birth for the foreign-born population - Other Northern Europe (%)
Place of birth for the foreign-born population - Austria (%)
Place of birth for the foreign-born population - Belgium (%)
Place of birth for the foreign-born population - France (%)
Place of birth for the foreign-born population - Germany (%)
Place of birth for the foreign-born population - Netherlands (%)
Place of birth for the foreign-born population - Switzerland (%)
Place of birth for the foreign-born population - Other Western Europe (%)
Place of birth for the foreign-born population - Greece (%)
Place of birth for the foreign-born population - Italy (%)
Place of birth for the foreign-born population - Portugal (%)
Place of birth for the foreign-born population - Spain (%)
Place of birth for the foreign-born population - Other Southern Europe (%)
Place of birth for the foreign-born population - Albania (%)
Place of birth for the foreign-born population - Belarus (%)
Place of birth for the foreign-born population - Bosnia and Herzegovina (%)
Place of birth for the foreign-born population - Bulgaria (%)
Place of birth for the foreign-born population - Croatia (%)
Place of birth for the foreign-born population - Czechoslovakia (%)
Place of birth for the foreign-born population - Hungary (%)
Place of birth for the foreign-born population - Latvia (%)
Place of birth for the foreign-born population - Lithuania (%)
Place of birth for the foreign-born population - North Macedonia (Macedonia) (%)
Place of birth for the foreign-born population - Moldova (%)
Place of birth for the foreign-born population - Poland (%)
Place of birth for the foreign-born population - Romania (%)
Place of birth for the foreign-born population - Russia (%)
Place of birth for the foreign-born population - Serbia (%)
Place of birth for the foreign-born population - Ukraine (%)
Place of birth for the foreign-born population - Other Eastern Europe (%)
Place of birth for the foreign-born population - China (%)
Place of birth for the foreign-born population - Hong Kong (%)
Place of birth for the foreign-born population - Taiwan (%)
Place of birth for the foreign-born population - Japan (%)
Place of birth for the foreign-born population - Korea (%)
Place of birth for the foreign-born population - Other Eastern Asia (%)
Place of birth for the foreign-born population - Afghanistan (%)
Place of birth for the foreign-born population - Bangladesh (%)
Place of birth for the foreign-born population - India (%)
Place of birth for the foreign-born population - Iran (%)
Place of birth for the foreign-born population - Kazakhstan (%)
Place of birth for the foreign-born population - Nepal (%)
Place of birth for the foreign-born population - Pakistan (%)
Place of birth for the foreign-born population - Sri Lanka (%)
Place of birth for the foreign-born population - Uzbekistan (%)
Place of birth for the foreign-born population - Other South Central Asia (%)
Place of birth for the foreign-born population - Burma (%)
Place of birth for the foreign-born population - Cambodia (%)
Place of birth for the foreign-born population - Indonesia (%)
Place of birth for the foreign-born population - Laos (%)
Place of birth for the foreign-born population - Malaysia (%)
Place of birth for the foreign-born population - Philippines (%)
Place of birth for the foreign-born population - Singapore (%)
Place of birth for the foreign-born population - Thailand (%)
Place of birth for the foreign-born population - Vietnam (%)
Place of birth for the foreign-born population - Other South Eastern Asia (%)
Place of birth for the foreign-born population - Armenia (%)
Place of birth for the foreign-born population - Iraq (%)
Place of birth for the foreign-born population - Israel (%)
Place of birth for the foreign-born population - Jordan (%)
Place of birth for the foreign-born population - Kuwait (%)
Place of birth for the foreign-born population - Lebanon (%)
Place of birth for the foreign-born population - Saudi Arabia (%)
Place of birth for the foreign-born population - Syria (%)
Place of birth for the foreign-born population - Turkey (%)
Place of birth for the foreign-born population - Yemen (%)
Place of birth for the foreign-born population - Other Western Asia (%)
Place of birth for the foreign-born population - Eritrea (%)
Place of birth for the foreign-born population - Ethiopia (%)
Place of birth for the foreign-born population - Kenya (%)
Place of birth for the foreign-born population - Somalia (%)
Place of birth for the foreign-born population - Uganda (%)
Place of birth for the foreign-born population - Zimbabwe (%)
Place of birth for the foreign-born population - Other Eastern Africa (%)
Place of birth for the foreign-born population - Cameroon (%)
Place of birth for the foreign-born population - Congo (%)
Place of birth for the foreign-born population - Democratic Republic of Congo (Zaire) (%)
Place of birth for the foreign-born population - Other Middle Africa (%)
Place of birth for the foreign-born population - Egypt (%)
Place of birth for the foreign-born population - Morocco (%)
Place of birth for the foreign-born population - Sudan (%)
Place of birth for the foreign-born population - Other Northern Africa (%)
Place of birth for the foreign-born population - South Africa (%)
Place of birth for the foreign-born population - Other Southern Africa (%)
Place of birth for the foreign-born population - Cabo Verde (%)
Place of birth for the foreign-born population - Ghana (%)
Place of birth for the foreign-born population - Liberia (%)
Place of birth for the foreign-born population - Nigeria (%)
Place of birth for the foreign-born population - Senegal (%)
Place of birth for the foreign-born population - Sierra Leone (%)
Place of birth for the foreign-born population - Other Western Africa (%)
Place of birth for the foreign-born population - Australia (%)
Place of birth for the foreign-born population - New Zealand (%)
Place of birth for the foreign-born population - Fiji (%)
Place of birth for the foreign-born population - Micronesia (%)
Place of birth for the foreign-born population - Bahamas (%)
Place of birth for the foreign-born population - Barbados (%)
Place of birth for the foreign-born population - Cuba (%)
Place of birth for the foreign-born population - Dominica (%)
Place of birth for the foreign-born population - Dominican Republic (%)
Place of birth for the foreign-born population - Grenada (%)
Place of birth for the foreign-born population - Haiti (%)
Place of birth for the foreign-born population - Jamaica (%)
Place of birth for the foreign-born population - St. Vincent and the Grenadines (%)
Place of birth for the foreign-born population - Trinidad and Tobago (%)
Place of birth for the foreign-born population - West Indies (%)
Place of birth for the foreign-born population - Other Caribbean (%)
Place of birth for the foreign-born population - Belize (%)
Place of birth for the foreign-born population - Costa Rica (%)
Place of birth for the foreign-born population - El Salvador (%)
Place of birth for the foreign-born population - Guatemala (%)
Place of birth for the foreign-born population - Honduras (%)
Place of birth for the foreign-born population - Mexico (%)
Place of birth for the foreign-born population - Nicaragua (%)
Place of birth for the foreign-born population - Panama (%)
Place of birth for the foreign-born population - Other Central America (%)
Place of birth for the foreign-born population - Argentina (%)
Place of birth for the foreign-born population - Bolivia (%)
Place of birth for the foreign-born population - Brazil (%)
Place of birth for the foreign-born population - Chile (%)
Place of birth for the foreign-born population - Colombia (%)
Place of birth for the foreign-born population - Ecuador (%)
Place of birth for the foreign-born population - Guyana (%)
Place of birth for the foreign-born population - Peru (%)
Place of birth for the foreign-born population - Uruguay (%)
Place of birth for the foreign-born population - Venezuela (%)
Place of birth for the foreign-born population - Other South America (%)
Place of birth for the foreign-born population - Canada (%)
Place of birth for the foreign-born population - Other Northern America (%)
Place of birth for the foreign-born population - Other (%)
Latest news about races in Derry, NH collected exclusively by city-data.com from local newspapers, TV, and radio stations
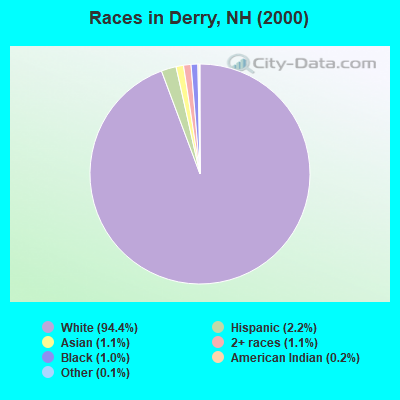
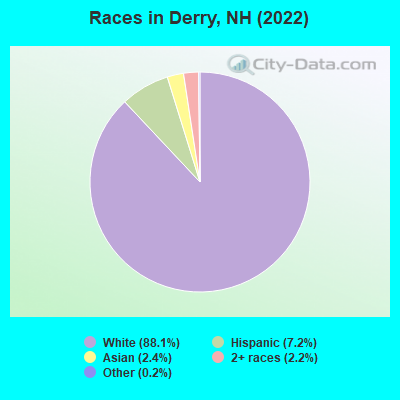
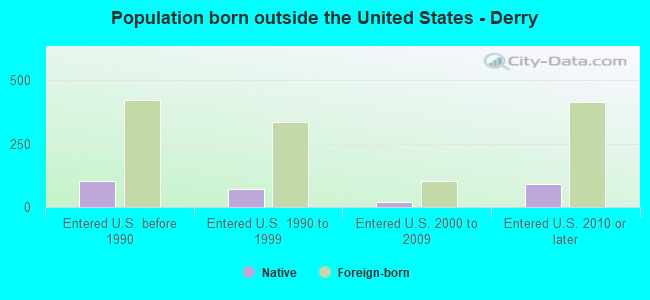
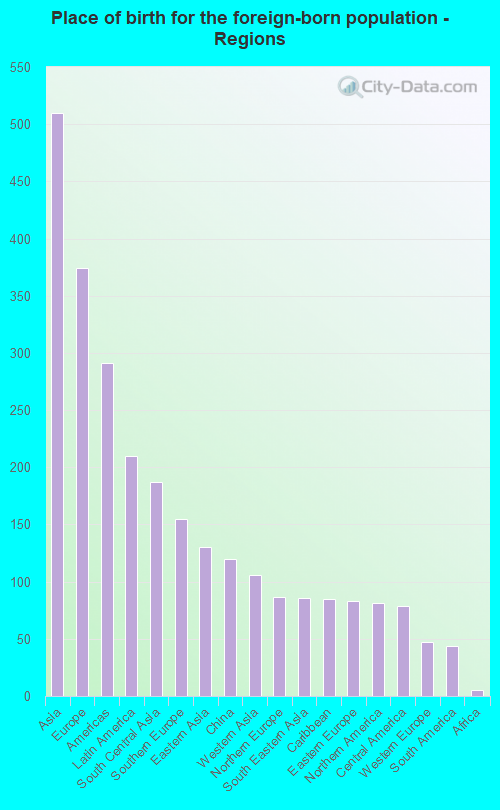
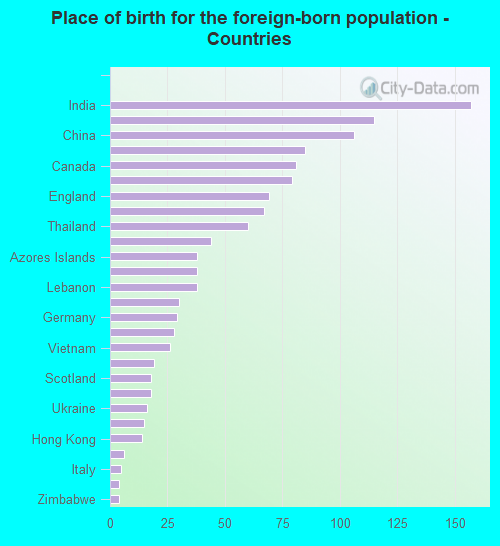
According to 2022 data, the most numerous races in Derry, NH are White alone (20,554 residents), Hispanic (1,678 residents), and Two or more races (525 residents). 91.2% of Derry residents speak English at home. 5.1% of Derry, NH residents are foreign-born (2.2% born in Asia, 1.6% born in Europe, 0.9% born in Latin America), which is about the same as the foreign-born rate of 5.0% across the entire state of New Hampshire.
Race distribution in Derry
2000 2022
1,175,252 95.1% White alone 20,489 1.7% Hispanic 15,803 1.3% Asian alone 11,606 0.9% Two or more races 8,354 0.7% Black alone 2,698 0.2% American Indian alone 1,254 0.1% Other race alone 330 0.03% Native Hawaiian and Other
1,208,101 86.6% White alone 63,479 4.5% Hispanic 60,724 4.4% Two or more races 36,519 2.6% Asian alone 17,931 1.3% Black alone 6,615 0.5% Other race alone 1,014 0.07% American Indian alone 848 0.06% Native Hawaiian and Other
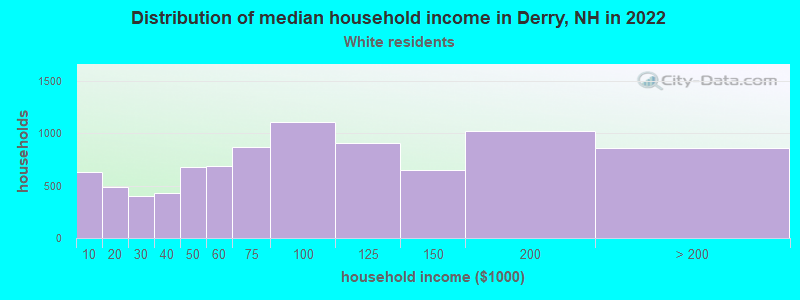
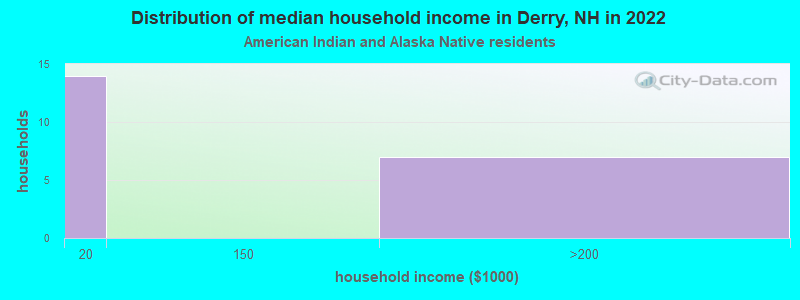
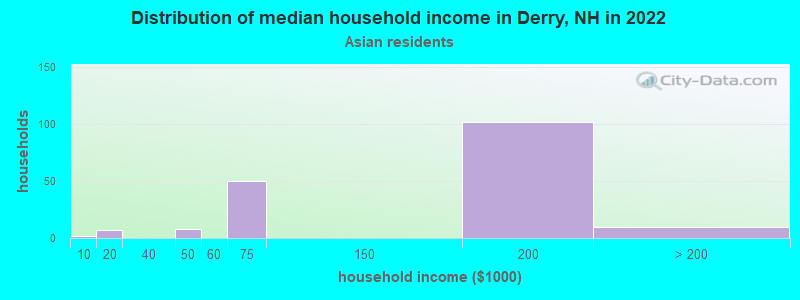
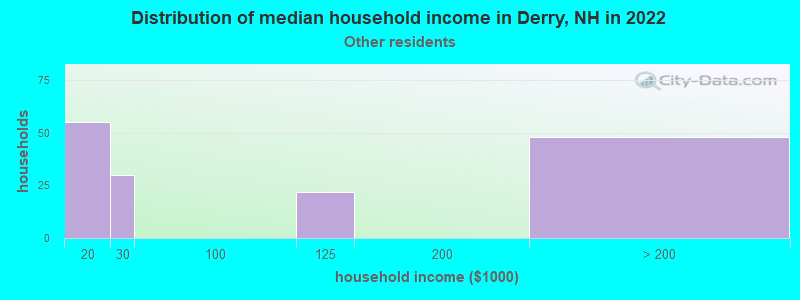
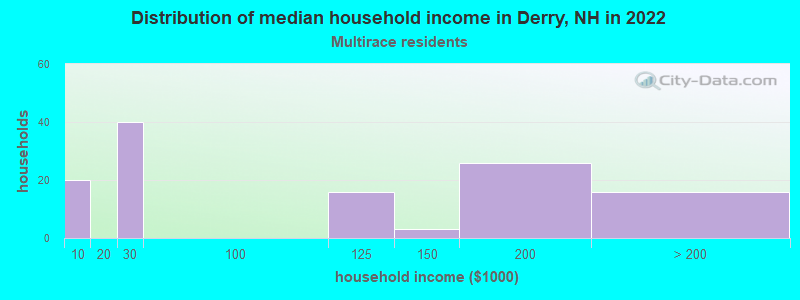
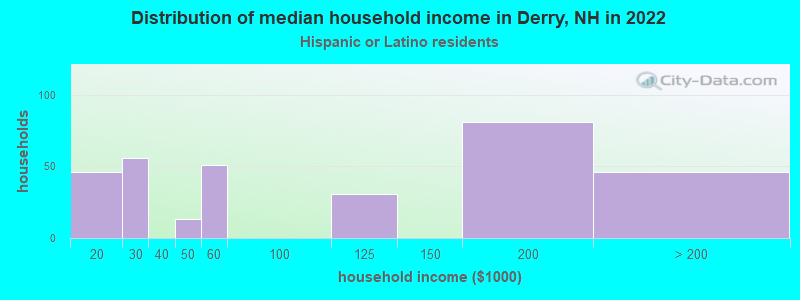
Income and house value in Derry Median household income in 2022 $81,736 White non-Hispanic householdersover $200,000 Asian householdersMedian 2022 house value $389,419 White Non-Hispanic householders$427,929 Black or African American householders $549,623 Asian householders$462,127 Some other race householders$481,536 Two or more races householders$418,687 Hispanic or Latino householders
Median age by race in Derry
41.0 Median age for White residents40.4 41.7 49.8 Median age for Black or African American residents-670,623,144.7 -772,779,699.3 89.0 Median age for American Indian / Alaska Native residents-772,357,722.8 79.4 36.8 Median age for Asian residents37.9 33.7 -633,846,153.2 Median age for Native Hawaiian / Pacific Islander residents-666,666,666.0 -666,666,666.0 28.3 Median age for Other race residents27.7 25.9 27.8 Median age for Two or more races residents34.7 24.3 41.7 Median age for White alone residents40.4 42.3 25.7 Median age for Hispanic or Latino residents31.0 20.2
Owner/renter occupied households by race in Derry
House owners and renters - White residents 5,080 57.6% Owner occupied3,740 42.4% Renter occupiedHouse owners and renters - American Indian / Alaska Native residents 3 18.9% Owner occupied14 81.1% Renter occupiedHouse owners and renters - Asian residents 158 66.8% Owner occupied78 33.2% Renter occupiedHouse owners and renters - Other race residents 35 15.7% Owner occupied187 84.3% Renter occupiedHouse owners and renters - Two or more races residents 71 61.8% Owner occupied44 38.2% Renter occupiedHouse owners and renters - White alone residents 4,975 56.9% Owner occupied3,768 43.1% Renter occupiedHouse owners and renters - Hispanic or Latino residents 92 25.1% Owner occupied275 74.9% Renter occupied
Language usage in Derry
English speakers - Total 91.2% of residents of Derry speak English at home.
3.5% of residents speak Spanish at home 647 84.5% Speak English very well119 15.5% Speak English less than very well5.5% of residents speak other language at home 953 78.6% Speak English very well260 21.4% Speak English less than very well
English speakers - Born in the United States 94.9% of residents of Derry speak English at home.
3.7% of residents speak Spanish at home 560 99.8% Speak English very well1 0.2% Speak English less than very well1.7% of residents speak other language at home 221 84.0% Speak English very well42 16.0% Speak English less than very well
English speakers - Native, born elsewhere 62.8% of residents of Derry speak English at home.
57.5% of residents speak Spanish at home 110 77.5% Speak English very well32 22.5% Speak English less than very well
English speakers - Foreign-born 30.2% of residents of Derry speak English at home.
9.9% of residents speak Spanish at home 16 12.8% Speak English very well109 87.2% Speak English less than very well59.0% of residents speak other language at home 535 71.9% Speak English very well209 28.1% Speak English less than very well
White (Caucasian) - Speak only English Native:
97.7% (18,675)Foreign-born:
41.5% (291)
White (Caucasian) - Speak another language Native:
2.2% (429)Foreign-born:
59.1% (415)
Black or African American - Speak only English Native:
100.0% (1)Foreign-born:
100.0% (4)
Asian - Speak only English Native:
39.1% (71)Foreign-born:
16.2% (62)
Asian - Speak another language Native:
56.6% (103)Foreign-born:
84.4% (324)
Other race - Speak only English Native:
57.4% (304)Foreign-born:
40.0% (11)
Two or more races - Speak another language Native:
39.5% (356)Foreign-born:
99.5% (63)
White alone - Speak only English Native:
97.6% (18,313)Foreign-born:
33.7% (191)
White alone - Speak another language Native:
2.4% (458)Foreign-born:
70.5% (400)
Hispanic or Latino - Speak only English Native:
58.1% (661)Foreign-born:
72.5% (199)
Hispanic or Latino - Speak another language Native:
41.2% (469)Foreign-born:
40.9% (112)
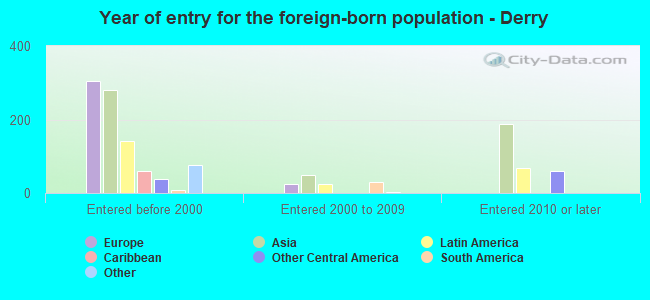
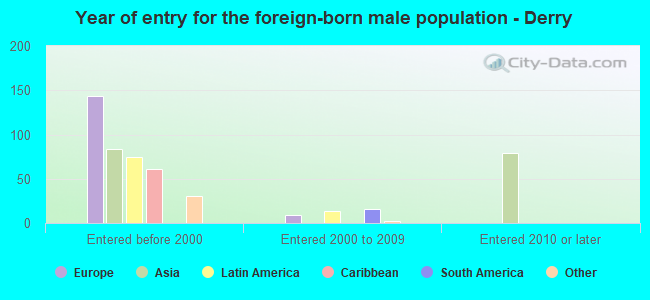
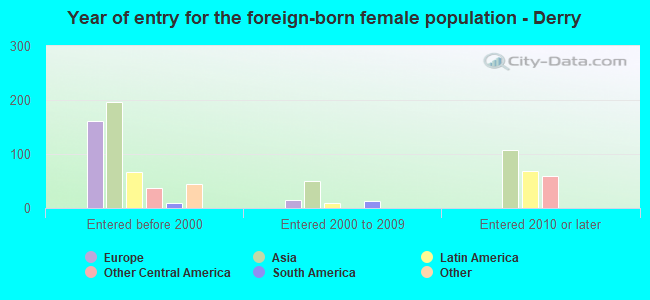
Foreign-born residents in Derry 1,182 residents are foreign born (2.2% Asia , 1.6% Europe , 0.9% Latin America ).
This city:
5.1%New Hampshire:
6.0%
Marital status for residents in Derry Marital status - White (Caucasian) population 15 years and over
Males 34.8% Never married53.0% Now married0.4% Separated0.7% Widowed11.1% DivorcedFemales 31.5% Never married42.0% Now married3.9% Separated10.2% Widowed12.4% DivorcedWomen who gave birth in the past 12 months Now married:
100.0% (200)Unmarried:
0.0% (0)
Women who did not give birth in the past 12 months Now married:
37.8% (2,091)Unmarried:
62.2% (3,437)
Marital status - Black or African American population 15 years and over
Males 20.0% Never married80.0% Now married0.0% Separated0.0% Widowed0.0% DivorcedFemales 100.0% Never married0.0% Now married0.0% Separated0.0% Widowed0.0% DivorcedWomen who did not give birth in the past 12 months Now married:
0.0% (0)Unmarried:
97.6% (1)
Marital status - American Indian / Alaska Native population 15 years and over
Males 0.0% Never married100.0% Now married0.0% Separated0.0% Widowed0.0% DivorcedFemales 0.0% Never married0.0% Now married0.0% Separated0.0% Widowed100.0% DivorcedMarital status - Asian population 15 years and over
Males 41.0% Never married59.0% Now married0.0% Separated0.0% Widowed0.0% DivorcedFemales 11.1% Never married74.0% Now married0.0% Separated3.8% Widowed11.1% DivorcedWomen who did not give birth in the past 12 months Now married:
70.6% (141)Unmarried:
29.4% (59)
Marital status - Other race population 15 years and over
Males 44.9% Never married55.1% Now married0.0% Separated0.0% Widowed0.0% DivorcedFemales 60.0% Never married40.0% Now married0.0% Separated0.0% Widowed0.0% DivorcedWomen who gave birth in the past 12 months Now married:
0.0% (0)Unmarried:
100.0% (84)
Women who did not give birth in the past 12 months Now married:
39.2% (36)Unmarried:
60.8% (55)
Marital status - Two or more races population 15 years and over
Males 62.7% Never married34.0% Now married0.0% Separated0.0% Widowed3.3% DivorcedFemales 53.2% Never married42.9% Now married3.2% Separated0.7% Widowed0.0% DivorcedWomen who gave birth in the past 12 months Now married:
0.0% (0)Unmarried:
100.0% (14)
Women who did not give birth in the past 12 months Now married:
41.1% (132)Unmarried:
58.9% (190)
Marital status - White alone, not Hispanic / Latino population 15 years and over
Males 34.5% Never married53.1% Now married0.4% Separated0.7% Widowed11.3% DivorcedFemales 30.4% Never married42.8% Now married4.0% Separated10.1% Widowed12.7% DivorcedWomen who gave birth in the past 12 months Now married:
100.0% (201)Unmarried:
0.0% (0)
Women who did not give birth in the past 12 months Now married:
38.7% (2,060)Unmarried:
61.3% (3,262)
Marital status - Hispanic or Latino population 15 years and over
Males 46.1% Never married53.9% Now married0.0% Separated0.0% Widowed0.0% DivorcedFemales 61.3% Never married24.3% Now married1.8% Separated7.9% Widowed4.7% DivorcedWomen who gave birth in the past 12 months Now married:
0.0% (0)Unmarried:
100.0% (54)
Women who did not give birth in the past 12 months Now married:
25.1% (101)Unmarried:
74.9% (302)
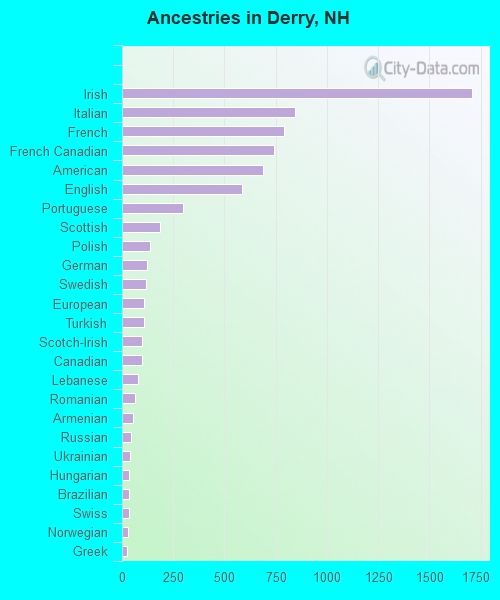
Ancestries in Derry
1,705 20.0% Irish845 9.9% Italian792 9.3% French743 8.7% French Canadian690 8.1% American583 6.8% English297 3.5% Portuguese186 2.2% Scottish139 1.6% Polish120 1.4% German118 1.4% Swedish107 1.3% European105 1.2% Turkish100 1.2% Scotch-Irish100 1.2% Canadian80 0.9% Lebanese63 0.7% Romanian53 0.6% Armenian44 0.5% Russian37 0.4% Ukrainian36 0.4% Hungarian33 0.4% Brazilian33 0.4% Swiss29 0.3% Norwegian23 0.3% Greek19 0.2% Belgian17 0.2% Danish12 0.1% Czech11 0.1% Scandinavian9 0.1% Austrian5 0.06% Zimbabwean4 0.05% Dutch1 0.01% Nigerian
Children Nativity (place of birth) in Derry
Children under 6 years - Living with two parents Both parents native 798 100.0% NativeBoth parents foreign-born 27 100.0% NativeOne native, one foreign-born parent 119 100.0% NativeChildren under 6 years - Living with one parent Native parent 528 100.0% NativeForeign-born parent 29 100.0% NativeChildren 6 to 17 years - Living with two parents Both parents native 1,327 100.0% NativeBoth parents foreign-born 34 100.0% NativeOne native, one foreign-born parent 180 100.0% NativeChildren 6 to 17 years - Living with one parent Native parent 1,023 100.0% NativeForeign-born parent 218 50.0% Native218 50.0% Foreign-born
Grandparents responsible for own grandchildren in Derry
Grandparents (30 to 59 years) White / Caucasian 82 50.6% Responsible for grandchildren81 49.4% Not responsible for grandchildrenWhite alone, not Hispanic / Latino 82 64.0% Responsible for grandchildren46 36.0% Not responsible for grandchildrenGrandparents (60 years and over) White / Caucasian 14 12.2% Responsible for grandchildren101 87.8% Not responsible for grandchildrenWhite alone, not Hispanic / Latino 14 12.3% Responsible for grandchildren102 87.7% Not responsible for grandchildren