Races in Destrehan, Louisiana (LA) Detailed Stats
Data:
Races - White alone (%)
Races - White alone (% change since 2000)
Races - Black alone (%)
Races - Black alone (% change since 2000)
Races - American Indian alone (%)
Races - American Indian alone (% change since 2000)
Races - Asian alone (%)
Races - Asian alone (% change since 2000)
Races - Hispanic (%)
Races - Hispanic (% change since 2000)
Races - Native Hawaiian and Other Pacific Islander alone (%)
Races - Native Hawaiian and Other Pacific Islander alone (% change since 2000)
Races - Two or more races(%)
Races - Two or more races(% change since 2000)
Races - Other race alone (%)
Races - Other race alone (% change since 2000)
Racial diversity
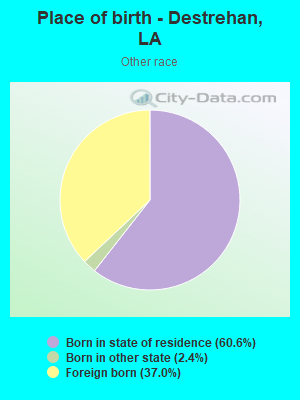
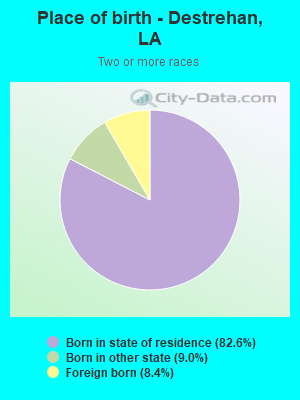
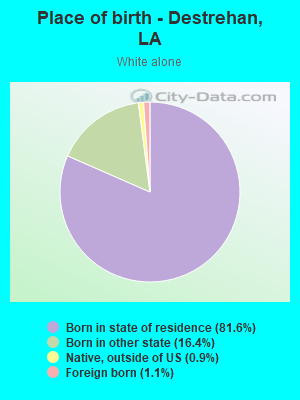
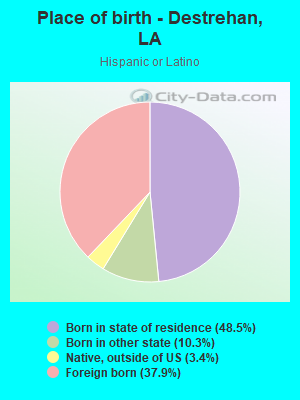
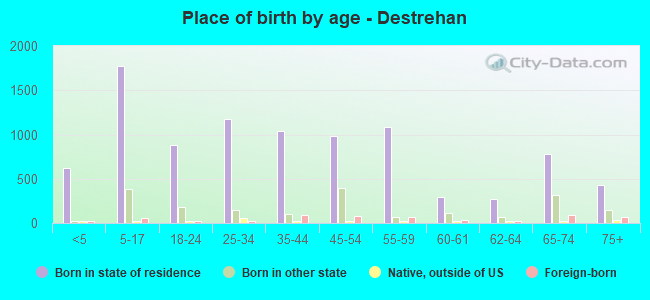
Place of birth - Born in state of residence (%)
Place of birth - Born in state of residence (%) - White
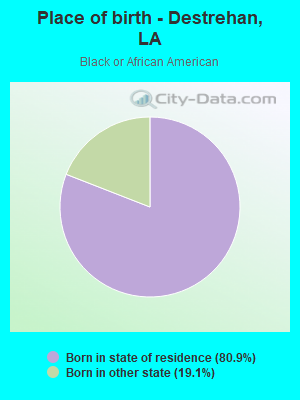
Place of birth - Born in state of residence (%) - Black or African American
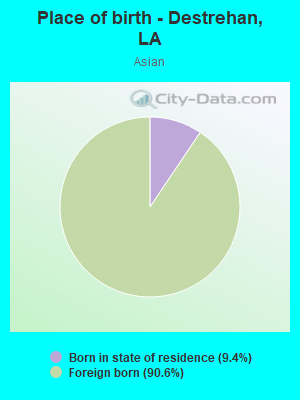
Place of birth - Born in state of residence (%) - Asian
Place of birth - Born in state of residence (%) - Hispanic or Latino
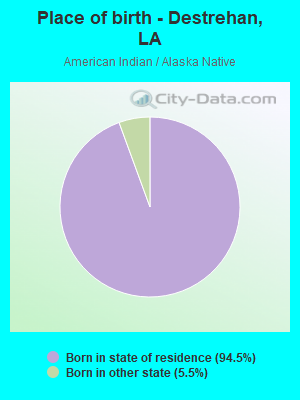
Place of birth - Born in state of residence (%) - American Indian and Alaska Native
Place of birth - Born in state of residence (%) - Multirace
Place of birth - Born in state of residence (%) - Other Race
Place of birth - Born in other state (%)
Place of birth - Born in other state (%) - White
Place of birth - Born in other state (%) - Black or African American
Place of birth - Born in other state (%) - Asian
Place of birth - Born in other state (%) - Hispanic or Latino
Place of birth - Born in other state (%) - American Indian and Alaska Native
Place of birth - Born in other state (%) - Multirace
Place of birth - Born in other state (%) - Other Race
Place of birth - Native, outside of US (%)
Place of birth - Native, outside of US (%) - White
Place of birth - Native, outside of US (%) - Black or African American
Place of birth - Native, outside of US (%) - Asian
Place of birth - Native, outside of US (%) - Hispanic or Latino
Place of birth - Native, outside of US (%) - American Indian and Alaska Native
Place of birth - Native, outside of US (%) - Multirace
Place of birth - Native, outside of US (%) - Other Race
Place of birth - Foreign born (%)
Place of birth - Foreign born (%) - White
Place of birth - Foreign born (%) - Black or African American
Place of birth - Foreign born (%) - Asian
Place of birth - Foreign born (%) - Hispanic or Latino
Place of birth - Foreign born (%) - American Indian and Alaska Native
Place of birth - Foreign born (%) - Multirace
Place of birth - Foreign born (%) - Other Race
Residents speaking English at home (%)
Residents speaking English at home - Born in the United States (%)
Residents speaking English at home - Native, born elsewhere (%)
Residents speaking English at home - Foreign born (%)
Residents speaking Spanish at home (%)
Residents speaking Spanish at home - Born in the United States (%)
Residents speaking Spanish at home - Native, born elsewhere (%)
Residents speaking Spanish at home - Foreign born (%)
Residents speaking other language at home (%)
Residents speaking other language at home - Born in the United States (%)
Residents speaking other language at home - Native, born elsewhere (%)
Residents speaking other language at home - Foreign born (%)
Marital status - Never married (%)
Marital status - Now married (%)
Marital status - Separated (%)
Marital status - Widowed (%)
Marital status - Divorced (%)
Ancestries Reported - Arab (%)
Ancestries Reported - Czech (%)
Ancestries Reported - Danish (%)
Ancestries Reported - Dutch (%)
Ancestries Reported - English (%)
Ancestries Reported - French (%)
Ancestries Reported - French Canadian (%)
Ancestries Reported - German (%)
Ancestries Reported - Greek (%)
Ancestries Reported - Hungarian (%)
Ancestries Reported - Irish (%)
Ancestries Reported - Italian (%)
Ancestries Reported - Lithuanian (%)
Ancestries Reported - Norwegian (%)
Ancestries Reported - Polish (%)
Ancestries Reported - Portuguese (%)
Ancestries Reported - Russian (%)
Ancestries Reported - Scotch-Irish (%)
Ancestries Reported - Scottish (%)
Ancestries Reported - Slovak (%)
Ancestries Reported - Subsaharan African (%)
Ancestries Reported - Swedish (%)
Ancestries Reported - Swiss (%)
Ancestries Reported - Ukrainian (%)
Ancestries Reported - United States (%)
Ancestries Reported - Welsh (%)
Ancestries Reported - West Indian (%)
Ancestries Reported - Other (%)
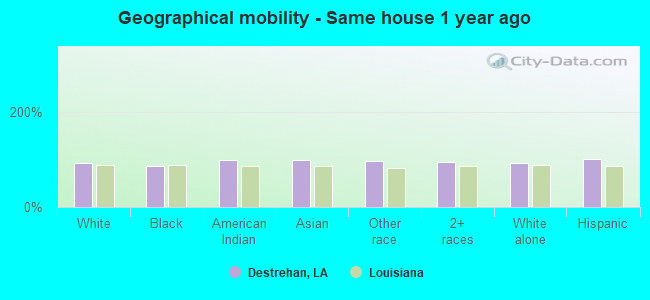
Geographical mobility - Same house 1 year ago (%)
Geographical mobility - Same house 1 year ago (%) - White
Geographical mobility - Same house 1 year ago (%) - Black or African American
Geographical mobility - Same house 1 year ago (%) - Asian
Geographical mobility - Same house 1 year ago (%) - Hispanic or Latino
Geographical mobility - Same house 1 year ago (%) - American Indian and Alaska Native
Geographical mobility - Same house 1 year ago (%) - Multirace
Geographical mobility - Same house 1 year ago (%) - Other Race
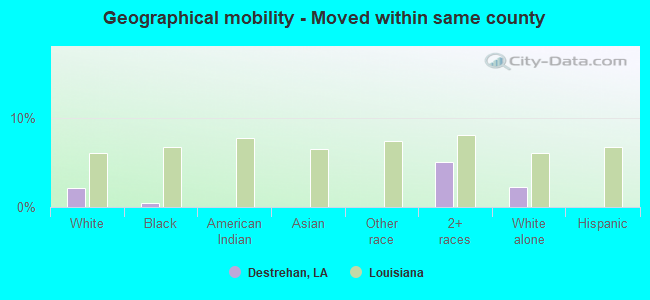
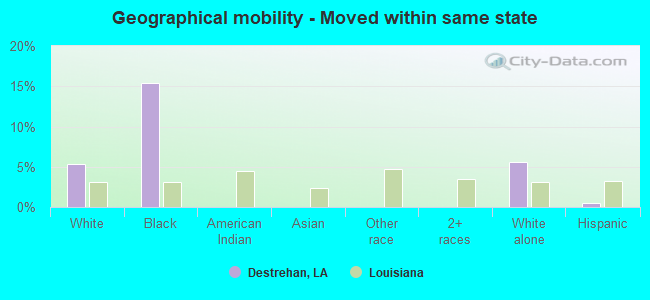
Geographical mobility - Moved within same county (%)
Geographical mobility - Moved within same county (%) - White
Geographical mobility - Moved within same county (%) - Black or African American
Geographical mobility - Moved within same county (%) - Asian
Geographical mobility - Moved within same county (%) - Hispanic or Latino
Geographical mobility - Moved within same county (%) - American Indian and Alaska Native
Geographical mobility - Moved within same county (%) - Multirace
Geographical mobility - Moved within same county (%) - Other Race
Geographical mobility - Moved from different county within same state (%)
Geographical mobility - Moved from different county within same state (%) - White
Geographical mobility - Moved from different county within same state (%) - Black or African American
Geographical mobility - Moved from different county within same state (%) - Asian
Geographical mobility - Moved from different county within same state (%) - Hispanic or Latino
Geographical mobility - Moved from different county within same state (%) - American Indian and Alaska Native
Geographical mobility - Moved from different county within same state (%) - Multirace
Geographical mobility - Moved from different county within same state (%) - Other Race
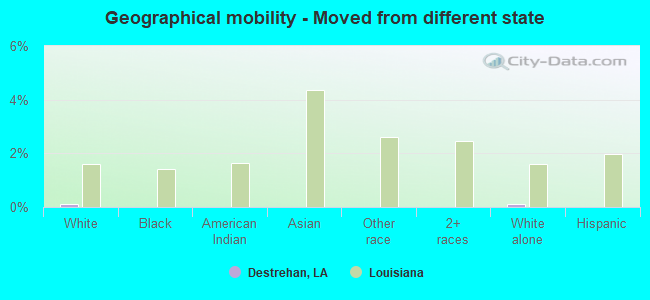
Geographical mobility - Moved from different state (%)
Geographical mobility - Moved from different state (%) - White
Geographical mobility - Moved from different state (%) - Black or African American
Geographical mobility - Moved from different state (%) - Asian
Geographical mobility - Moved from different state (%) - Hispanic or Latino
Geographical mobility - Moved from different state (%) - American Indian and Alaska Native
Geographical mobility - Moved from different state (%) - Multirace
Geographical mobility - Moved from different state (%) - Other Race
Geographical mobility - Moved from abroad (%)
Geographical mobility - Moved from abroad (%) - White
Geographical mobility - Moved from abroad (%) - Black or African American
Geographical mobility - Moved from abroad (%) - Asian
Geographical mobility - Moved from abroad (%) - Hispanic or Latino
Geographical mobility - Moved from abroad (%) - American Indian and Alaska Native
Geographical mobility - Moved from abroad (%) - Multirace
Geographical mobility - Moved from abroad (%) - Other Race
Place of birth for the foreign-born population - Ireland (%)
Place of birth for the foreign-born population - Denmark (%)
Place of birth for the foreign-born population - Norway (%)
Place of birth for the foreign-born population - Sweden (%)
Place of birth for the foreign-born population - United Kingdom (%)
Place of birth for the foreign-born population - England (%)
Place of birth for the foreign-born population - Scotland (%)
Place of birth for the foreign-born population - Other Northern Europe (%)
Place of birth for the foreign-born population - Austria (%)
Place of birth for the foreign-born population - Belgium (%)
Place of birth for the foreign-born population - France (%)
Place of birth for the foreign-born population - Germany (%)
Place of birth for the foreign-born population - Netherlands (%)
Place of birth for the foreign-born population - Switzerland (%)
Place of birth for the foreign-born population - Other Western Europe (%)
Place of birth for the foreign-born population - Greece (%)
Place of birth for the foreign-born population - Italy (%)
Place of birth for the foreign-born population - Portugal (%)
Place of birth for the foreign-born population - Spain (%)
Place of birth for the foreign-born population - Other Southern Europe (%)
Place of birth for the foreign-born population - Albania (%)
Place of birth for the foreign-born population - Belarus (%)
Place of birth for the foreign-born population - Bosnia and Herzegovina (%)
Place of birth for the foreign-born population - Bulgaria (%)
Place of birth for the foreign-born population - Croatia (%)
Place of birth for the foreign-born population - Czechoslovakia (%)
Place of birth for the foreign-born population - Hungary (%)
Place of birth for the foreign-born population - Latvia (%)
Place of birth for the foreign-born population - Lithuania (%)
Place of birth for the foreign-born population - North Macedonia (Macedonia) (%)
Place of birth for the foreign-born population - Moldova (%)
Place of birth for the foreign-born population - Poland (%)
Place of birth for the foreign-born population - Romania (%)
Place of birth for the foreign-born population - Russia (%)
Place of birth for the foreign-born population - Serbia (%)
Place of birth for the foreign-born population - Ukraine (%)
Place of birth for the foreign-born population - Other Eastern Europe (%)
Place of birth for the foreign-born population - China (%)
Place of birth for the foreign-born population - Hong Kong (%)
Place of birth for the foreign-born population - Taiwan (%)
Place of birth for the foreign-born population - Japan (%)
Place of birth for the foreign-born population - Korea (%)
Place of birth for the foreign-born population - Other Eastern Asia (%)
Place of birth for the foreign-born population - Afghanistan (%)
Place of birth for the foreign-born population - Bangladesh (%)
Place of birth for the foreign-born population - India (%)
Place of birth for the foreign-born population - Iran (%)
Place of birth for the foreign-born population - Kazakhstan (%)
Place of birth for the foreign-born population - Nepal (%)
Place of birth for the foreign-born population - Pakistan (%)
Place of birth for the foreign-born population - Sri Lanka (%)
Place of birth for the foreign-born population - Uzbekistan (%)
Place of birth for the foreign-born population - Other South Central Asia (%)
Place of birth for the foreign-born population - Burma (%)
Place of birth for the foreign-born population - Cambodia (%)
Place of birth for the foreign-born population - Indonesia (%)
Place of birth for the foreign-born population - Laos (%)
Place of birth for the foreign-born population - Malaysia (%)
Place of birth for the foreign-born population - Philippines (%)
Place of birth for the foreign-born population - Singapore (%)
Place of birth for the foreign-born population - Thailand (%)
Place of birth for the foreign-born population - Vietnam (%)
Place of birth for the foreign-born population - Other South Eastern Asia (%)
Place of birth for the foreign-born population - Armenia (%)
Place of birth for the foreign-born population - Iraq (%)
Place of birth for the foreign-born population - Israel (%)
Place of birth for the foreign-born population - Jordan (%)
Place of birth for the foreign-born population - Kuwait (%)
Place of birth for the foreign-born population - Lebanon (%)
Place of birth for the foreign-born population - Saudi Arabia (%)
Place of birth for the foreign-born population - Syria (%)
Place of birth for the foreign-born population - Turkey (%)
Place of birth for the foreign-born population - Yemen (%)
Place of birth for the foreign-born population - Other Western Asia (%)
Place of birth for the foreign-born population - Eritrea (%)
Place of birth for the foreign-born population - Ethiopia (%)
Place of birth for the foreign-born population - Kenya (%)
Place of birth for the foreign-born population - Somalia (%)
Place of birth for the foreign-born population - Uganda (%)
Place of birth for the foreign-born population - Zimbabwe (%)
Place of birth for the foreign-born population - Other Eastern Africa (%)
Place of birth for the foreign-born population - Cameroon (%)
Place of birth for the foreign-born population - Congo (%)
Place of birth for the foreign-born population - Democratic Republic of Congo (Zaire) (%)
Place of birth for the foreign-born population - Other Middle Africa (%)
Place of birth for the foreign-born population - Egypt (%)
Place of birth for the foreign-born population - Morocco (%)
Place of birth for the foreign-born population - Sudan (%)
Place of birth for the foreign-born population - Other Northern Africa (%)
Place of birth for the foreign-born population - South Africa (%)
Place of birth for the foreign-born population - Other Southern Africa (%)
Place of birth for the foreign-born population - Cabo Verde (%)
Place of birth for the foreign-born population - Ghana (%)
Place of birth for the foreign-born population - Liberia (%)
Place of birth for the foreign-born population - Nigeria (%)
Place of birth for the foreign-born population - Senegal (%)
Place of birth for the foreign-born population - Sierra Leone (%)
Place of birth for the foreign-born population - Other Western Africa (%)
Place of birth for the foreign-born population - Australia (%)
Place of birth for the foreign-born population - New Zealand (%)
Place of birth for the foreign-born population - Fiji (%)
Place of birth for the foreign-born population - Micronesia (%)
Place of birth for the foreign-born population - Bahamas (%)
Place of birth for the foreign-born population - Barbados (%)
Place of birth for the foreign-born population - Cuba (%)
Place of birth for the foreign-born population - Dominica (%)
Place of birth for the foreign-born population - Dominican Republic (%)
Place of birth for the foreign-born population - Grenada (%)
Place of birth for the foreign-born population - Haiti (%)
Place of birth for the foreign-born population - Jamaica (%)
Place of birth for the foreign-born population - St. Vincent and the Grenadines (%)
Place of birth for the foreign-born population - Trinidad and Tobago (%)
Place of birth for the foreign-born population - West Indies (%)
Place of birth for the foreign-born population - Other Caribbean (%)
Place of birth for the foreign-born population - Belize (%)
Place of birth for the foreign-born population - Costa Rica (%)
Place of birth for the foreign-born population - El Salvador (%)
Place of birth for the foreign-born population - Guatemala (%)
Place of birth for the foreign-born population - Honduras (%)
Place of birth for the foreign-born population - Mexico (%)
Place of birth for the foreign-born population - Nicaragua (%)
Place of birth for the foreign-born population - Panama (%)
Place of birth for the foreign-born population - Other Central America (%)
Place of birth for the foreign-born population - Argentina (%)
Place of birth for the foreign-born population - Bolivia (%)
Place of birth for the foreign-born population - Brazil (%)
Place of birth for the foreign-born population - Chile (%)
Place of birth for the foreign-born population - Colombia (%)
Place of birth for the foreign-born population - Ecuador (%)
Place of birth for the foreign-born population - Guyana (%)
Place of birth for the foreign-born population - Peru (%)
Place of birth for the foreign-born population - Uruguay (%)
Place of birth for the foreign-born population - Venezuela (%)
Place of birth for the foreign-born population - Other South America (%)
Place of birth for the foreign-born population - Canada (%)
Place of birth for the foreign-born population - Other Northern America (%)
Place of birth for the foreign-born population - Other (%)
Latest news about races in Destrehan, LA collected exclusively by city-data.com from local newspapers, TV, and radio stations
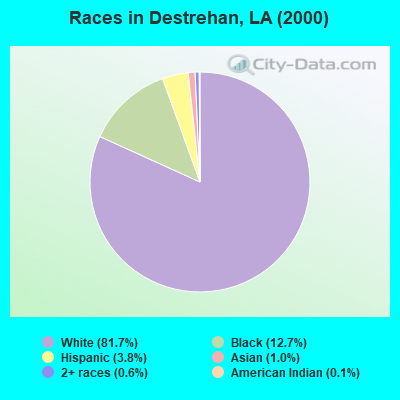
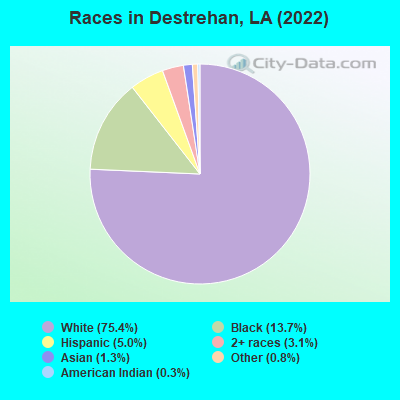
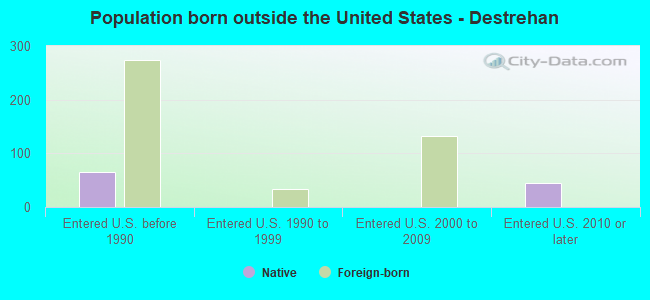
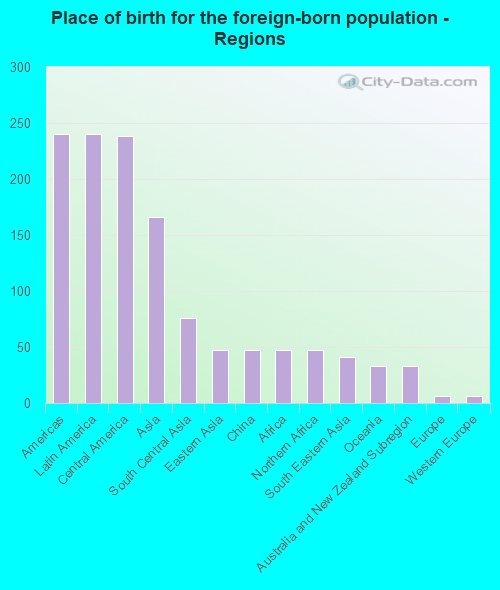
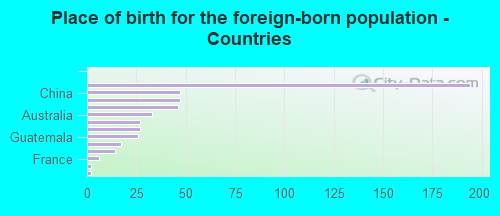
According to 2022 data, the most numerous races in Destrehan, LA are White alone (8,991 residents), Black alone (1,633 residents), and Hispanic (602 residents). 94.6% of Destrehan residents speak English at home. 4.1% of Destrehan, LA residents are foreign-born (2.0% born in Latin America, 1.3% born in Asia), which is 3.4% greater than the foreign-born rate of 4.0% across the entire state of Louisiana.
Race distribution in Destrehan
2000 2022
2,794,391 62.5% White alone 1,443,390 32.3% Black alone 107,738 2.4% Hispanic 54,256 1.2% Asian alone 39,260 0.9% Two or more races 24,129 0.5% American Indian alone 4,736 0.1% Other race alone 1,076 0.02% Native Hawaiian and Other
2,603,221 56.7% White alone 1,420,055 30.9% Black alone 262,213 5.7% Hispanic 183,270 4.0% Two or more races 81,169 1.8% Asian alone 19,991 0.4% American Indian alone 18,043 0.4% Other race alone 2,279 0.05% Native Hawaiian and Other
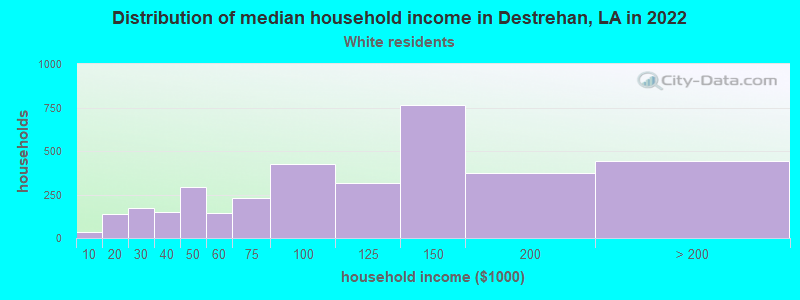
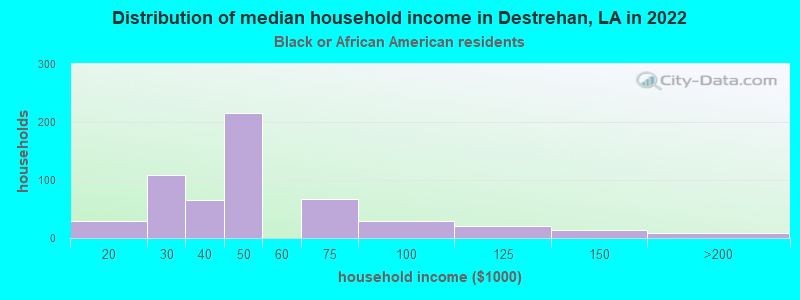
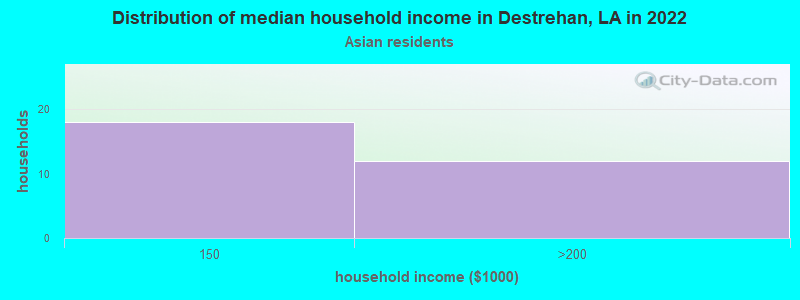
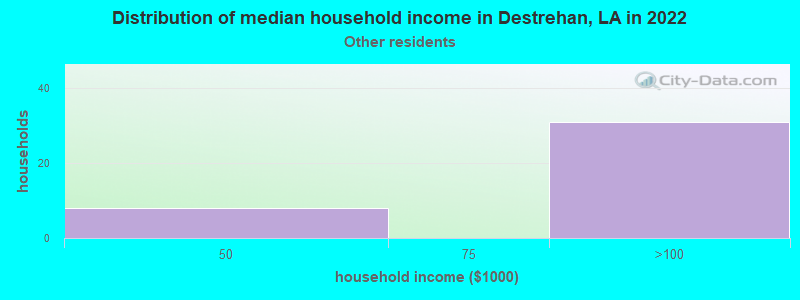
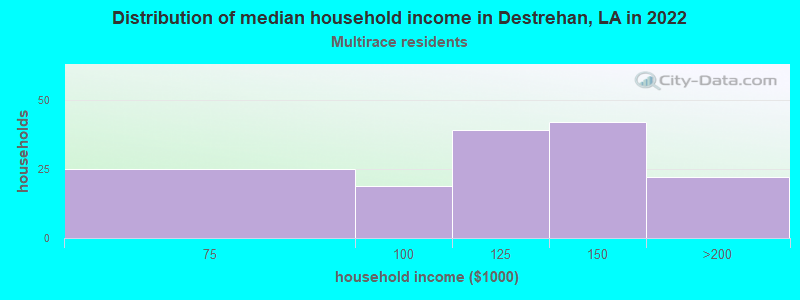
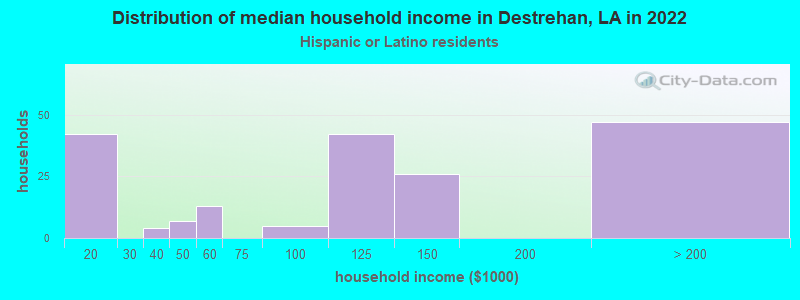
Income and house value in Destrehan Median household income in 2022 $109,699 White non-Hispanic householders$44,040 Black householders$129,922 Asian householders$85,946 Some other race householders$116,949 Two or more races householders$109,356 Hispanic or Latino race householdersMedian 2022 house value $324,057 White Non-Hispanic householders$276,888 Black or African American householders $378,029 Asian householders$229,947 Some other race householders$355,805 Two or more races householders$267,817 Hispanic or Latino householders
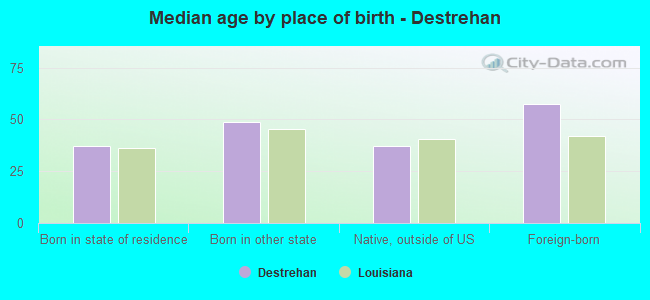
Median age by race in Destrehan
43.7 Median age for White residents43.9 43.3 29.7 Median age for Black or African American residents22.4 38.8 -754,036,086.6 Median age for American Indian / Alaska Native residents-739,906,102.5 -781,341,107.1 51.0 Median age for Asian residents55.3 12.3 -821,138,210.6 Median age for Native Hawaiian / Pacific Islander residents-868,167,201.7 -599,999,999.4 33.4 Median age for Other race residents-633,663,365.7 36.1 14.0 Median age for Two or more races residents10.1 24.8 43.4 Median age for White alone residents43.8 42.9 45.3 Median age for Hispanic or Latino residents26.8 51.7
Owner/renter occupied households by race in Destrehan
House owners and renters - White residents 3,169 88.1% Owner occupied430 11.9% Renter occupiedHouse owners and renters - Black or African American residents 186 33.2% Owner occupied375 66.8% Renter occupiedHouse owners and renters - American Indian / Alaska Native residents 45 100.0% Owner occupiedHouse owners and renters - Asian residents 40 100.0% Owner occupiedHouse owners and renters - Other race residents 47 100.0% Owner occupiedHouse owners and renters - Two or more races residents 128 87.8% Owner occupied18 12.2% Renter occupiedHouse owners and renters - White alone residents 3,103 88.1% Owner occupied420 11.9% Renter occupiedHouse owners and renters - Hispanic or Latino residents 175 87.8% Owner occupied24 12.2% Renter occupied
Language usage in Destrehan
English speakers - Total 94.6% of residents of Destrehan speak English at home.
3.5% of residents speak Spanish at home 269 67.2% Speak English very well131 32.8% Speak English less than very well1.8% of residents speak other language at home 100 49.5% Speak English very well102 50.5% Speak English less than very well
English speakers - Born in the United States 95.2% of residents of Destrehan speak English at home.
4.1% of residents speak Spanish at home 72 91.1% Speak English very well7 8.9% Speak English less than very well0.7% of residents speak other language at home 14 100.0% Speak English very well
English speakers - Native, born elsewhere 79.1% of residents of Destrehan speak English at home.
15.5% of residents speak Spanish at home 17 100.0% Speak English very well
English speakers - Foreign-born 28.8% of residents of Destrehan speak English at home.
48.4% of residents speak Spanish at home 104 45.2% Speak English very well126 54.8% Speak English less than very well20.4% of residents speak other language at home 8 8.2% Speak English very well89 91.8% Speak English less than very well
White (Caucasian) - Speak only English Native:
98.1% (8,408)Foreign-born:
43.8% (65)
White (Caucasian) - Speak another language Native:
2.1% (180)Foreign-born:
59.7% (89)
Asian - Speak another language Native:
100.0% (15)Foreign-born:
46.6% (64)
Other race - Speak another language Native:
7.3% (5)Foreign-born:
100.0% (76)
Two or more races - Speak another language Native:
10.5% (65)Foreign-born:
100.0% (59)
White alone - Speak only English Native:
98.9% (8,386)Foreign-born:
71.1% (73)
White alone - Speak another language Native:
1.2% (104)Foreign-born:
29.1% (30)
Hispanic or Latino - Speak another language Native:
37.5% (143)Foreign-born:
99.9% (230)
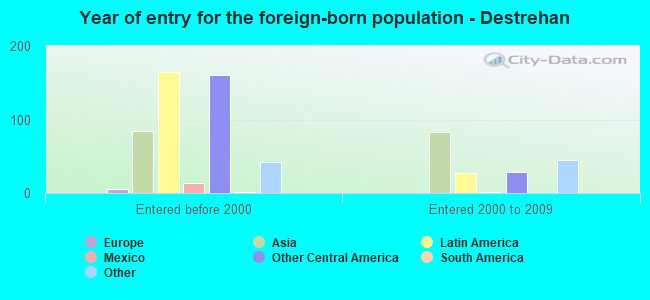
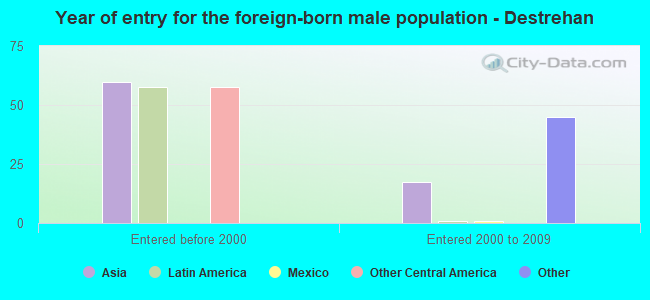
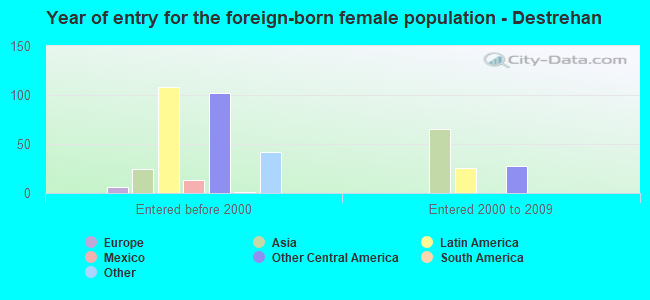
Foreign-born residents in Destrehan 494 residents are foreign born (2.0% Latin America , 1.3% Asia ).
This city:
4.1%Louisiana:
4.2%
Marital status for residents in Destrehan Marital status - White (Caucasian) population 15 years and over
Males 28.3% Never married60.3% Now married1.9% Separated0.7% Widowed8.8% DivorcedFemales 25.1% Never married57.9% Now married0.5% Separated5.2% Widowed11.3% DivorcedWomen who gave birth in the past 12 months Now married:
100.0% (40)Unmarried:
0.0% (0)
Women who did not give birth in the past 12 months Now married:
43.0% (782)Unmarried:
57.0% (1,038)
Marital status - Black or African American population 15 years and over
Males 60.7% Never married14.4% Now married0.0% Separated1.1% Widowed23.8% DivorcedFemales 53.1% Never married17.6% Now married9.0% Separated10.4% Widowed9.9% DivorcedWomen who did not give birth in the past 12 months Now married:
4.9% (21)Unmarried:
95.1% (415)
Marital status - American Indian / Alaska Native population 15 years and over
Males 0.0% Never married100.0% Now married0.0% Separated0.0% Widowed0.0% DivorcedFemales 0.0% Never married0.0% Now married0.0% Separated100.0% Widowed0.0% DivorcedMarital status - Asian population 15 years and over
Males 0.0% Never married100.0% Now married0.0% Separated0.0% Widowed0.0% DivorcedFemales 0.0% Never married100.0% Now married0.0% Separated0.0% Widowed0.0% DivorcedWomen who did not give birth in the past 12 months Now married:
100.0% (20)Unmarried:
0.0% (0)
Marital status - Other race population 15 years and over
Males 12.8% Never married87.2% Now married0.0% Separated0.0% Widowed0.0% DivorcedFemales 8.0% Never married54.0% Now married0.0% Separated38.0% Widowed0.0% DivorcedWomen who did not give birth in the past 12 months Now married:
78.4% (31)Unmarried:
21.6% (9)
Marital status - Two or more races population 15 years and over
Males 60.6% Never married39.4% Now married0.0% Separated0.0% Widowed0.0% DivorcedFemales 43.4% Never married55.9% Now married0.0% Separated0.0% Widowed0.7% DivorcedWomen who did not give birth in the past 12 months Now married:
37.6% (53)Unmarried:
62.4% (88)
Marital status - White alone, not Hispanic / Latino population 15 years and over
Males 28.9% Never married59.5% Now married1.9% Separated0.7% Widowed9.0% DivorcedFemales 25.5% Never married57.5% Now married0.5% Separated4.8% Widowed11.7% DivorcedWomen who gave birth in the past 12 months Now married:
100.0% (41)Unmarried:
0.0% (0)
Women who did not give birth in the past 12 months Now married:
42.7% (767)Unmarried:
57.3% (1,029)
Marital status - Hispanic or Latino population 15 years and over
Males 24.5% Never married75.5% Now married0.0% Separated0.0% Widowed0.0% DivorcedFemales 11.8% Never married66.6% Now married0.0% Separated20.6% Widowed1.0% DivorcedWomen who did not give birth in the past 12 months Now married:
65.7% (68)Unmarried:
34.3% (36)
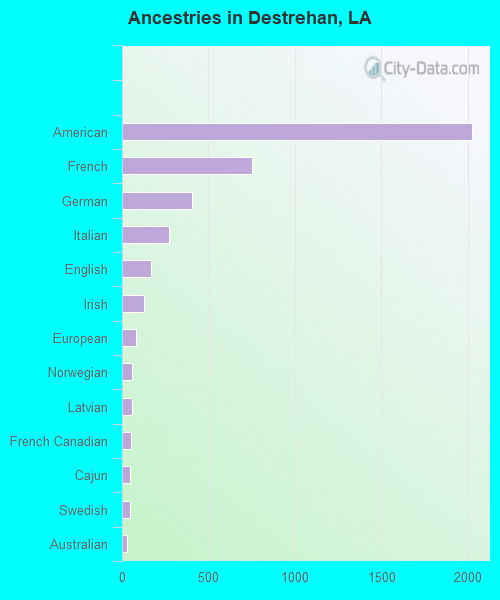
Ancestries in Destrehan
2,023 39.7% American753 14.8% French405 8.0% German271 5.3% Italian168 3.3% English129 2.5% Irish82 1.6% European58 1.1% Norwegian57 1.1% Latvian54 1.1% French Canadian48 0.9% Cajun48 0.9% Swedish27 0.5% Australian18 0.4% Egyptian16 0.3% Northern European11 0.2% Scottish9 0.2% British9 0.2% Welsh5 0.10% Eastern European
Children Nativity (place of birth) in Destrehan
Children under 6 years - Living with two parents Both parents native 334 100.0% NativeBoth parents foreign-born 19 100.0% NativeOne native, one foreign-born parent 29 100.0% NativeChildren under 6 years - Living with one parent Native parent 354 100.0% NativeChildren 6 to 17 years - Living with two parents Both parents native 959 100.0% NativeBoth parents foreign-born 65 84.8% Native12 15.2% Foreign-bornOne native, one foreign-born parent 36 100.0% NativeChildren 6 to 17 years - Living with one parent Native parent 888 95.3% Native44 4.7% Foreign-born
Grandparents responsible for own grandchildren in Destrehan
Grandparents (30 to 59 years) White / Caucasian 7 21.9% Responsible for grandchildren24 78.1% Not responsible for grandchildrenBlack or African American 12 100.0% Not responsible for grandchildrenTwo or more races 19 100.0% Not responsible for grandchildrenWhite alone, not Hispanic / Latino 7 21.5% Responsible for grandchildren26 78.5% Not responsible for grandchildrenGrandparents (60 years and over) White / Caucasian 93 85.4% Responsible for grandchildren16 14.6% Not responsible for grandchildrenWhite alone, not Hispanic / Latino 95 85.4% Responsible for grandchildren16 14.6% Not responsible for grandchildren