Races in Devils Lake, North Dakota (ND) Detailed Stats
Data:
Races - White alone (%)
Races - White alone (% change since 2000)
Races - Black alone (%)
Races - Black alone (% change since 2000)
Races - American Indian alone (%)
Races - American Indian alone (% change since 2000)
Races - Asian alone (%)
Races - Asian alone (% change since 2000)
Races - Hispanic (%)
Races - Hispanic (% change since 2000)
Races - Native Hawaiian and Other Pacific Islander alone (%)
Races - Native Hawaiian and Other Pacific Islander alone (% change since 2000)
Races - Two or more races(%)
Races - Two or more races(% change since 2000)
Races - Other race alone (%)
Races - Other race alone (% change since 2000)
Racial diversity
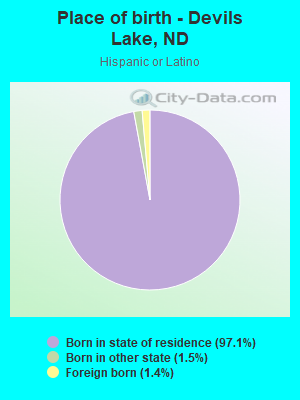
Place of birth - Born in state of residence (%)
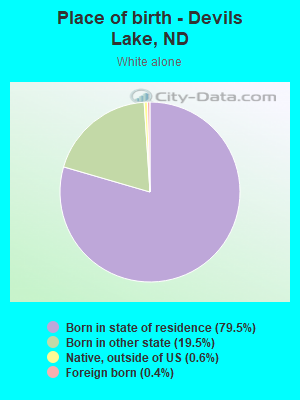
Place of birth - Born in state of residence (%) - White
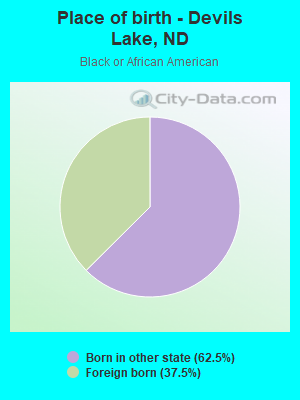
Place of birth - Born in state of residence (%) - Black or African American
Place of birth - Born in state of residence (%) - Asian
Place of birth - Born in state of residence (%) - Hispanic or Latino
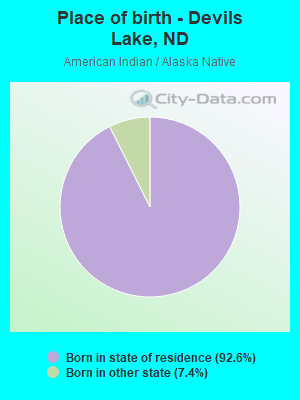
Place of birth - Born in state of residence (%) - American Indian and Alaska Native
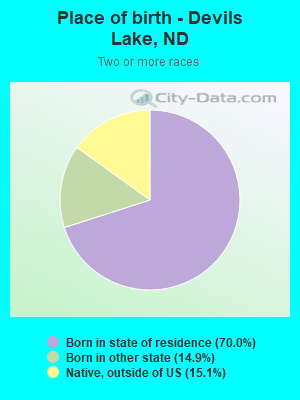
Place of birth - Born in state of residence (%) - Multirace
Place of birth - Born in state of residence (%) - Other Race
Place of birth - Born in other state (%)
Place of birth - Born in other state (%) - White
Place of birth - Born in other state (%) - Black or African American
Place of birth - Born in other state (%) - Asian
Place of birth - Born in other state (%) - Hispanic or Latino
Place of birth - Born in other state (%) - American Indian and Alaska Native
Place of birth - Born in other state (%) - Multirace
Place of birth - Born in other state (%) - Other Race
Place of birth - Native, outside of US (%)
Place of birth - Native, outside of US (%) - White
Place of birth - Native, outside of US (%) - Black or African American
Place of birth - Native, outside of US (%) - Asian
Place of birth - Native, outside of US (%) - Hispanic or Latino
Place of birth - Native, outside of US (%) - American Indian and Alaska Native
Place of birth - Native, outside of US (%) - Multirace
Place of birth - Native, outside of US (%) - Other Race
Place of birth - Foreign born (%)
Place of birth - Foreign born (%) - White
Place of birth - Foreign born (%) - Black or African American
Place of birth - Foreign born (%) - Asian
Place of birth - Foreign born (%) - Hispanic or Latino
Place of birth - Foreign born (%) - American Indian and Alaska Native
Place of birth - Foreign born (%) - Multirace
Place of birth - Foreign born (%) - Other Race
Residents speaking English at home (%)
Residents speaking English at home - Born in the United States (%)
Residents speaking English at home - Native, born elsewhere (%)
Residents speaking English at home - Foreign born (%)
Residents speaking Spanish at home (%)
Residents speaking Spanish at home - Born in the United States (%)
Residents speaking Spanish at home - Native, born elsewhere (%)
Residents speaking Spanish at home - Foreign born (%)
Residents speaking other language at home (%)
Residents speaking other language at home - Born in the United States (%)
Residents speaking other language at home - Native, born elsewhere (%)
Residents speaking other language at home - Foreign born (%)
Marital status - Never married (%)
Marital status - Now married (%)
Marital status - Separated (%)
Marital status - Widowed (%)
Marital status - Divorced (%)
Ancestries Reported - Arab (%)
Ancestries Reported - Czech (%)
Ancestries Reported - Danish (%)
Ancestries Reported - Dutch (%)
Ancestries Reported - English (%)
Ancestries Reported - French (%)
Ancestries Reported - French Canadian (%)
Ancestries Reported - German (%)
Ancestries Reported - Greek (%)
Ancestries Reported - Hungarian (%)
Ancestries Reported - Irish (%)
Ancestries Reported - Italian (%)
Ancestries Reported - Lithuanian (%)
Ancestries Reported - Norwegian (%)
Ancestries Reported - Polish (%)
Ancestries Reported - Portuguese (%)
Ancestries Reported - Russian (%)
Ancestries Reported - Scotch-Irish (%)
Ancestries Reported - Scottish (%)
Ancestries Reported - Slovak (%)
Ancestries Reported - Subsaharan African (%)
Ancestries Reported - Swedish (%)
Ancestries Reported - Swiss (%)
Ancestries Reported - Ukrainian (%)
Ancestries Reported - United States (%)
Ancestries Reported - Welsh (%)
Ancestries Reported - West Indian (%)
Ancestries Reported - Other (%)
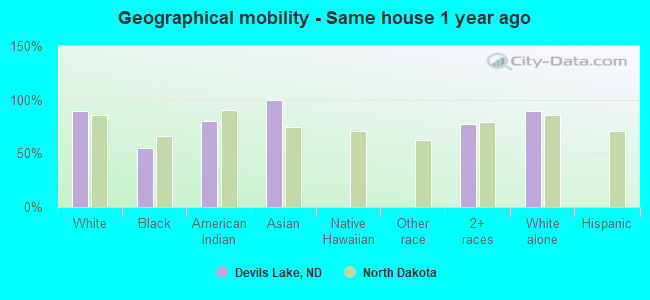
Geographical mobility - Same house 1 year ago (%)
Geographical mobility - Same house 1 year ago (%) - White
Geographical mobility - Same house 1 year ago (%) - Black or African American
Geographical mobility - Same house 1 year ago (%) - Asian
Geographical mobility - Same house 1 year ago (%) - Hispanic or Latino
Geographical mobility - Same house 1 year ago (%) - American Indian and Alaska Native
Geographical mobility - Same house 1 year ago (%) - Multirace
Geographical mobility - Same house 1 year ago (%) - Other Race
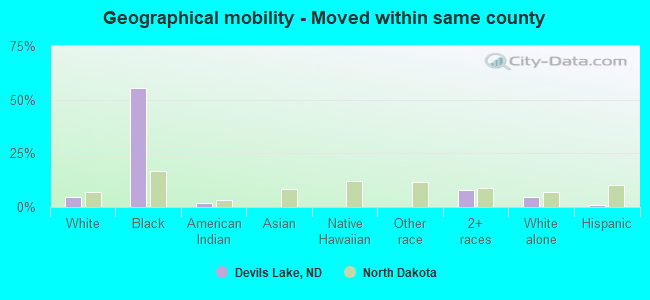
Geographical mobility - Moved within same county (%)
Geographical mobility - Moved within same county (%) - White
Geographical mobility - Moved within same county (%) - Black or African American
Geographical mobility - Moved within same county (%) - Asian
Geographical mobility - Moved within same county (%) - Hispanic or Latino
Geographical mobility - Moved within same county (%) - American Indian and Alaska Native
Geographical mobility - Moved within same county (%) - Multirace
Geographical mobility - Moved within same county (%) - Other Race
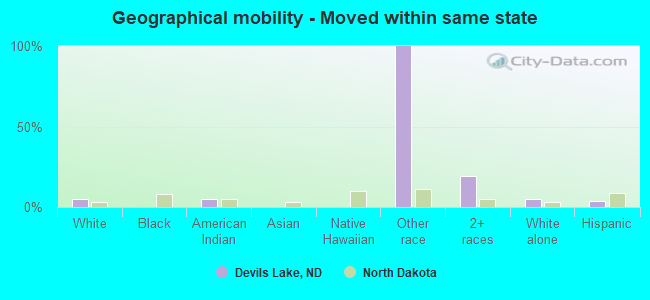
Geographical mobility - Moved from different county within same state (%)
Geographical mobility - Moved from different county within same state (%) - White
Geographical mobility - Moved from different county within same state (%) - Black or African American
Geographical mobility - Moved from different county within same state (%) - Asian
Geographical mobility - Moved from different county within same state (%) - Hispanic or Latino
Geographical mobility - Moved from different county within same state (%) - American Indian and Alaska Native
Geographical mobility - Moved from different county within same state (%) - Multirace
Geographical mobility - Moved from different county within same state (%) - Other Race
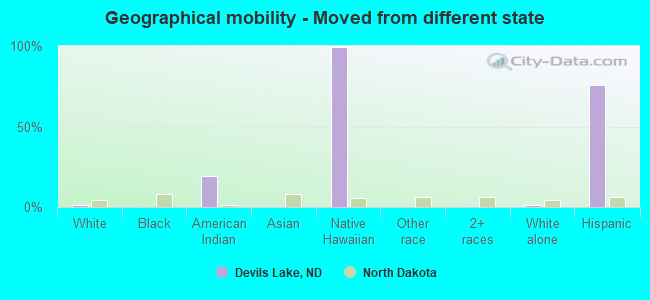
Geographical mobility - Moved from different state (%)
Geographical mobility - Moved from different state (%) - White
Geographical mobility - Moved from different state (%) - Black or African American
Geographical mobility - Moved from different state (%) - Asian
Geographical mobility - Moved from different state (%) - Hispanic or Latino
Geographical mobility - Moved from different state (%) - American Indian and Alaska Native
Geographical mobility - Moved from different state (%) - Multirace
Geographical mobility - Moved from different state (%) - Other Race
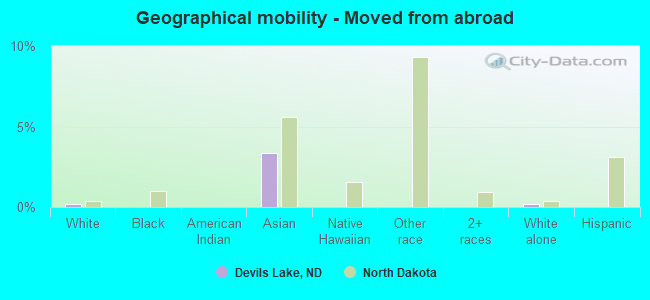
Geographical mobility - Moved from abroad (%)
Geographical mobility - Moved from abroad (%) - White
Geographical mobility - Moved from abroad (%) - Black or African American
Geographical mobility - Moved from abroad (%) - Asian
Geographical mobility - Moved from abroad (%) - Hispanic or Latino
Geographical mobility - Moved from abroad (%) - American Indian and Alaska Native
Geographical mobility - Moved from abroad (%) - Multirace
Geographical mobility - Moved from abroad (%) - Other Race
Place of birth for the foreign-born population - Ireland (%)
Place of birth for the foreign-born population - Denmark (%)
Place of birth for the foreign-born population - Norway (%)
Place of birth for the foreign-born population - Sweden (%)
Place of birth for the foreign-born population - United Kingdom (%)
Place of birth for the foreign-born population - England (%)
Place of birth for the foreign-born population - Scotland (%)
Place of birth for the foreign-born population - Other Northern Europe (%)
Place of birth for the foreign-born population - Austria (%)
Place of birth for the foreign-born population - Belgium (%)
Place of birth for the foreign-born population - France (%)
Place of birth for the foreign-born population - Germany (%)
Place of birth for the foreign-born population - Netherlands (%)
Place of birth for the foreign-born population - Switzerland (%)
Place of birth for the foreign-born population - Other Western Europe (%)
Place of birth for the foreign-born population - Greece (%)
Place of birth for the foreign-born population - Italy (%)
Place of birth for the foreign-born population - Portugal (%)
Place of birth for the foreign-born population - Spain (%)
Place of birth for the foreign-born population - Other Southern Europe (%)
Place of birth for the foreign-born population - Albania (%)
Place of birth for the foreign-born population - Belarus (%)
Place of birth for the foreign-born population - Bosnia and Herzegovina (%)
Place of birth for the foreign-born population - Bulgaria (%)
Place of birth for the foreign-born population - Croatia (%)
Place of birth for the foreign-born population - Czechoslovakia (%)
Place of birth for the foreign-born population - Hungary (%)
Place of birth for the foreign-born population - Latvia (%)
Place of birth for the foreign-born population - Lithuania (%)
Place of birth for the foreign-born population - North Macedonia (Macedonia) (%)
Place of birth for the foreign-born population - Moldova (%)
Place of birth for the foreign-born population - Poland (%)
Place of birth for the foreign-born population - Romania (%)
Place of birth for the foreign-born population - Russia (%)
Place of birth for the foreign-born population - Serbia (%)
Place of birth for the foreign-born population - Ukraine (%)
Place of birth for the foreign-born population - Other Eastern Europe (%)
Place of birth for the foreign-born population - China (%)
Place of birth for the foreign-born population - Hong Kong (%)
Place of birth for the foreign-born population - Taiwan (%)
Place of birth for the foreign-born population - Japan (%)
Place of birth for the foreign-born population - Korea (%)
Place of birth for the foreign-born population - Other Eastern Asia (%)
Place of birth for the foreign-born population - Afghanistan (%)
Place of birth for the foreign-born population - Bangladesh (%)
Place of birth for the foreign-born population - India (%)
Place of birth for the foreign-born population - Iran (%)
Place of birth for the foreign-born population - Kazakhstan (%)
Place of birth for the foreign-born population - Nepal (%)
Place of birth for the foreign-born population - Pakistan (%)
Place of birth for the foreign-born population - Sri Lanka (%)
Place of birth for the foreign-born population - Uzbekistan (%)
Place of birth for the foreign-born population - Other South Central Asia (%)
Place of birth for the foreign-born population - Burma (%)
Place of birth for the foreign-born population - Cambodia (%)
Place of birth for the foreign-born population - Indonesia (%)
Place of birth for the foreign-born population - Laos (%)
Place of birth for the foreign-born population - Malaysia (%)
Place of birth for the foreign-born population - Philippines (%)
Place of birth for the foreign-born population - Singapore (%)
Place of birth for the foreign-born population - Thailand (%)
Place of birth for the foreign-born population - Vietnam (%)
Place of birth for the foreign-born population - Other South Eastern Asia (%)
Place of birth for the foreign-born population - Armenia (%)
Place of birth for the foreign-born population - Iraq (%)
Place of birth for the foreign-born population - Israel (%)
Place of birth for the foreign-born population - Jordan (%)
Place of birth for the foreign-born population - Kuwait (%)
Place of birth for the foreign-born population - Lebanon (%)
Place of birth for the foreign-born population - Saudi Arabia (%)
Place of birth for the foreign-born population - Syria (%)
Place of birth for the foreign-born population - Turkey (%)
Place of birth for the foreign-born population - Yemen (%)
Place of birth for the foreign-born population - Other Western Asia (%)
Place of birth for the foreign-born population - Eritrea (%)
Place of birth for the foreign-born population - Ethiopia (%)
Place of birth for the foreign-born population - Kenya (%)
Place of birth for the foreign-born population - Somalia (%)
Place of birth for the foreign-born population - Uganda (%)
Place of birth for the foreign-born population - Zimbabwe (%)
Place of birth for the foreign-born population - Other Eastern Africa (%)
Place of birth for the foreign-born population - Cameroon (%)
Place of birth for the foreign-born population - Congo (%)
Place of birth for the foreign-born population - Democratic Republic of Congo (Zaire) (%)
Place of birth for the foreign-born population - Other Middle Africa (%)
Place of birth for the foreign-born population - Egypt (%)
Place of birth for the foreign-born population - Morocco (%)
Place of birth for the foreign-born population - Sudan (%)
Place of birth for the foreign-born population - Other Northern Africa (%)
Place of birth for the foreign-born population - South Africa (%)
Place of birth for the foreign-born population - Other Southern Africa (%)
Place of birth for the foreign-born population - Cabo Verde (%)
Place of birth for the foreign-born population - Ghana (%)
Place of birth for the foreign-born population - Liberia (%)
Place of birth for the foreign-born population - Nigeria (%)
Place of birth for the foreign-born population - Senegal (%)
Place of birth for the foreign-born population - Sierra Leone (%)
Place of birth for the foreign-born population - Other Western Africa (%)
Place of birth for the foreign-born population - Australia (%)
Place of birth for the foreign-born population - New Zealand (%)
Place of birth for the foreign-born population - Fiji (%)
Place of birth for the foreign-born population - Micronesia (%)
Place of birth for the foreign-born population - Bahamas (%)
Place of birth for the foreign-born population - Barbados (%)
Place of birth for the foreign-born population - Cuba (%)
Place of birth for the foreign-born population - Dominica (%)
Place of birth for the foreign-born population - Dominican Republic (%)
Place of birth for the foreign-born population - Grenada (%)
Place of birth for the foreign-born population - Haiti (%)
Place of birth for the foreign-born population - Jamaica (%)
Place of birth for the foreign-born population - St. Vincent and the Grenadines (%)
Place of birth for the foreign-born population - Trinidad and Tobago (%)
Place of birth for the foreign-born population - West Indies (%)
Place of birth for the foreign-born population - Other Caribbean (%)
Place of birth for the foreign-born population - Belize (%)
Place of birth for the foreign-born population - Costa Rica (%)
Place of birth for the foreign-born population - El Salvador (%)
Place of birth for the foreign-born population - Guatemala (%)
Place of birth for the foreign-born population - Honduras (%)
Place of birth for the foreign-born population - Mexico (%)
Place of birth for the foreign-born population - Nicaragua (%)
Place of birth for the foreign-born population - Panama (%)
Place of birth for the foreign-born population - Other Central America (%)
Place of birth for the foreign-born population - Argentina (%)
Place of birth for the foreign-born population - Bolivia (%)
Place of birth for the foreign-born population - Brazil (%)
Place of birth for the foreign-born population - Chile (%)
Place of birth for the foreign-born population - Colombia (%)
Place of birth for the foreign-born population - Ecuador (%)
Place of birth for the foreign-born population - Guyana (%)
Place of birth for the foreign-born population - Peru (%)
Place of birth for the foreign-born population - Uruguay (%)
Place of birth for the foreign-born population - Venezuela (%)
Place of birth for the foreign-born population - Other South America (%)
Place of birth for the foreign-born population - Canada (%)
Place of birth for the foreign-born population - Other Northern America (%)
Place of birth for the foreign-born population - Other (%)
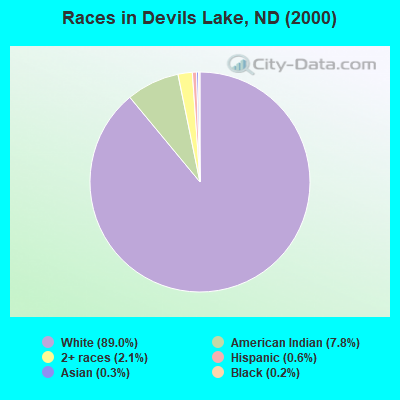
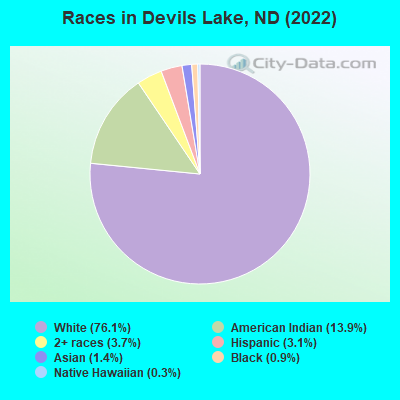
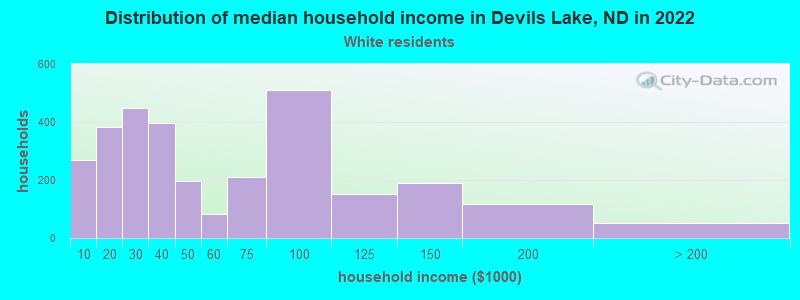
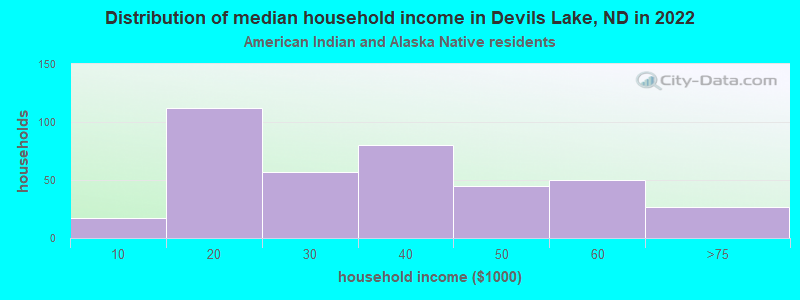
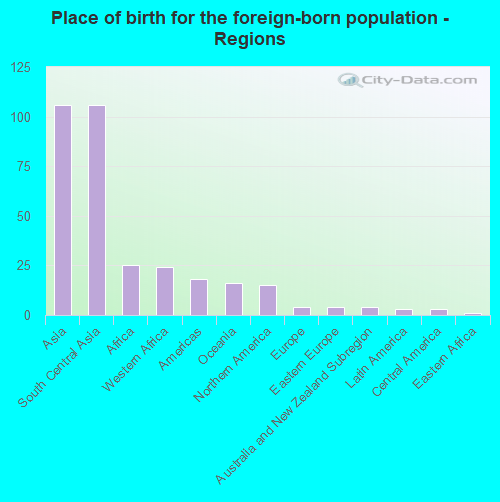
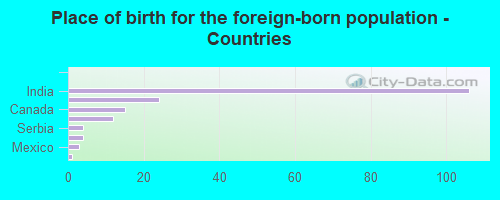
According to 2022 data, the most numerous races in Devils Lake, ND are White alone (5,491 residents), Hispanic (226 residents), and American Indian alone (1,001 residents). 94.8% of Devils Lake residents speak English at home. 2.4% of Devils Lake, ND residents are foreign-born (1.4% born in Asia, 0.3% born in Africa), which is 69.7% less than the foreign-born rate of 4.0% across the entire state of North Dakota.
Race distribution in Devils Lake
2000 2022
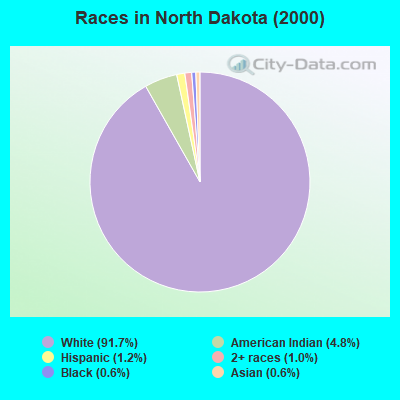
589,149 91.7% White alone 30,772 4.8% American Indian alone 7,786 1.2% Hispanic 6,666 1.0% Two or more races 3,761 0.6% Black alone 3,566 0.6% Asian alone 282 0.04% Other race alone 218 0.03% Native Hawaiian and Other
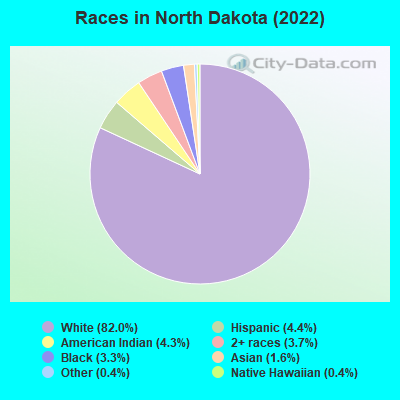
639,297 82.0% White alone 34,233 4.4% Hispanic 33,252 4.3% American Indian alone 28,831 3.7% Two or more races 25,426 3.3% Black alone 12,271 1.6% Asian alone 3,206 0.4% Other race alone 2,745 0.4% Native Hawaiian and Other
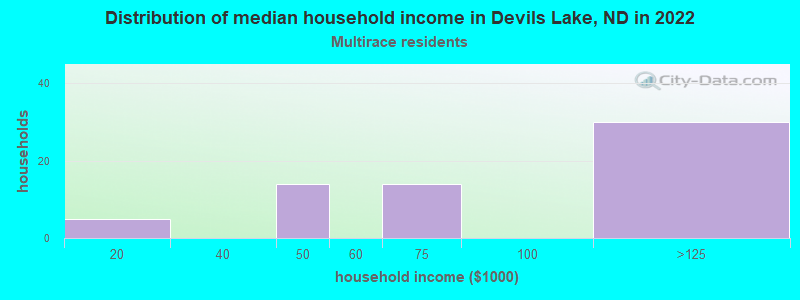
Income and house value in Devils Lake Median household income in 2022 $39,041 White non-Hispanic householders$32,011 American Indian and Alaska Native householders$107,253 Two or more races householdersMedian 2022 house value $185,722 White Non-Hispanic householders$109,678 American Indian or Alaska Native householders$116,990 Two or more races householders
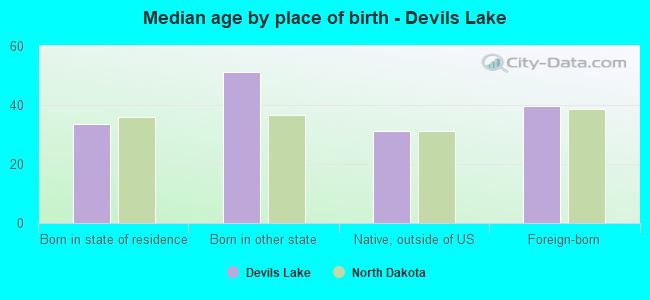
Median age by race in Devils Lake
48.2 Median age for White residents44.2 50.3 32.6 Median age for Black or African American residents55.2 38.5 14.3 Median age for American Indian / Alaska Native residents10.1 18.3 -629,750,270.8 Median age for Asian residents-666,666,666.0 -587,064,676.0 -730,392,156.1 Median age for Native Hawaiian / Pacific Islander residents-553,672,315.8 -695,847,361.8 -664,488,016.8 Median age for Other race residents-730,046,947.6 -645,435,243.5 31.1 Median age for Two or more races residents30.5 33.0 48.0 Median age for White alone residents44.1 50.1 8.0 Median age for Hispanic or Latino residents8.0 9.2
Owner/renter occupied households by race in Devils Lake
House owners and renters - White residents 1,626 55.6% Owner occupied1,301 44.4% Renter occupiedHouse owners and renters - Black or African American residents 16 100.0% Renter occupiedHouse owners and renters - American Indian / Alaska Native residents 71 21.3% Owner occupied262 78.7% Renter occupiedHouse owners and renters - Asian residents 94 100.0% Renter occupiedHouse owners and renters - Two or more races residents 38 53.1% Owner occupied34 46.9% Renter occupiedHouse owners and renters - White alone residents 1,630 55.7% Owner occupied1,297 44.3% Renter occupied
Language usage in Devils Lake
English speakers - Total 94.8% of residents of Devils Lake speak English at home.
0.2% of residents speak Spanish at home 12 75.0% Speak English very well4 25.0% Speak English less than very well4.6% of residents speak other language at home 211 66.6% Speak English very well106 33.4% Speak English less than very well
English speakers - Born in the United States 98.5% of residents of Devils Lake speak English at home.
1.6% of residents speak other language at home 20 100.0% Speak English very well
English speakers - Native, born elsewhere 52.7% of residents of Devils Lake speak English at home.
63.5% of residents speak other language at home 47 100.0% Speak English less than very well
English speakers - Foreign-born 16.9% of residents of Devils Lake speak English at home.
2.2% of residents speak Spanish at home 4 100.0% Speak English less than very well75.3% of residents speak other language at home 128 95.5% Speak English very well6 4.5% Speak English less than very well
White (Caucasian) - Speak only English Native:
97.4% (5,050)Foreign-born:
54.7% (13)
White (Caucasian) - Speak another language Native:
2.6% (135)Foreign-born:
45.3% (10)
Black or African American - Speak only English Native:
100.0% (44)Foreign-born:
5.2% (1)
White alone - Speak only English Native:
97.3% (5,055)Foreign-born:
53.7% (13)
White alone - Speak another language Native:
2.8% (146)Foreign-born:
45.0% (11)
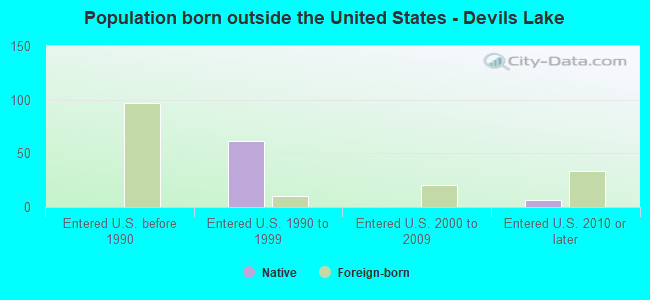
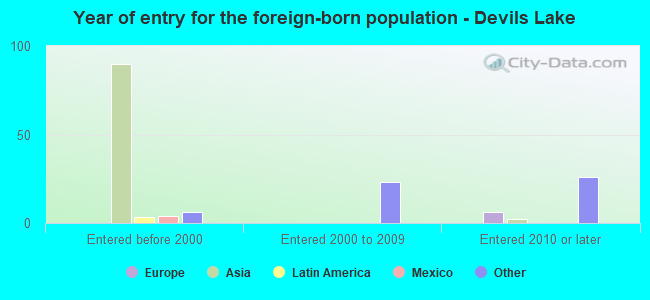
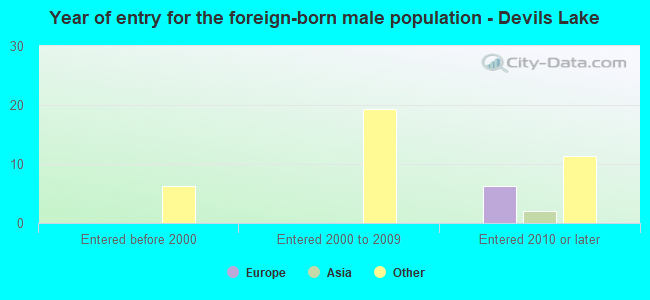
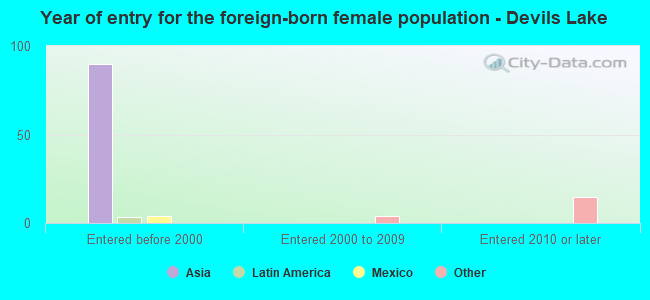
Foreign-born residents in Devils Lake 170 residents are foreign born (1.4% Asia , 0.3% Africa ).
This city:
2.4%North Dakota:
4.6%
Marital status for residents in Devils Lake Marital status - White (Caucasian) population 15 years and over
Males 27.7% Never married46.1% Now married5.5% Separated7.8% Widowed13.0% DivorcedFemales 24.4% Never married41.7% Now married0.9% Separated21.9% Widowed11.1% DivorcedWomen who gave birth in the past 12 months Now married:
100.0% (93)Unmarried:
0.0% (0)
Women who did not give birth in the past 12 months Now married:
39.8% (365)Unmarried:
60.2% (552)
Marital status - Black or African American population 15 years and over
Males 19.0% Never married81.0% Now married0.0% Separated0.0% Widowed0.0% DivorcedFemales 82.5% Never married17.5% Now married0.0% Separated0.0% Widowed0.0% DivorcedWomen who did not give birth in the past 12 months Now married:
0.0% (0)Unmarried:
100.0% (31)
Marital status - American Indian / Alaska Native population 15 years and over
Males 56.3% Never married42.4% Now married0.0% Separated0.0% Widowed1.3% DivorcedFemales 32.5% Never married37.8% Now married0.0% Separated18.3% Widowed11.4% DivorcedWomen who did not give birth in the past 12 months Now married:
50.0% (149)Unmarried:
50.0% (149)
Marital status - Asian population 15 years and over
Males 100.0% Never married0.0% Now married0.0% Separated0.0% Widowed0.0% DivorcedFemales 0.0% Never married100.0% Now married0.0% Separated0.0% Widowed0.0% DivorcedWomen who did not give birth in the past 12 months Now married:
100.0% (119)Unmarried:
0.0% (0)
Marital status - Two or more races population 15 years and over
Males 30.9% Never married67.5% Now married1.6% Separated0.0% Widowed0.0% DivorcedFemales 83.6% Never married13.1% Now married0.0% Separated0.0% Widowed3.3% DivorcedWomen who did not give birth in the past 12 months Now married:
0.0% (0)Unmarried:
100.0% (60)
Marital status - White alone, not Hispanic / Latino population 15 years and over
Males 27.6% Never married46.1% Now married5.5% Separated7.8% Widowed13.0% DivorcedFemales 24.4% Never married41.7% Now married0.9% Separated21.9% Widowed11.1% DivorcedWomen who gave birth in the past 12 months Now married:
100.0% (94)Unmarried:
0.0% (0)
Women who did not give birth in the past 12 months Now married:
39.8% (367)Unmarried:
60.2% (555)
Marital status - Hispanic or Latino population 15 years and over
Males 60.0% Never married0.0% Now married40.0% Separated0.0% Widowed0.0% DivorcedFemales 0.0% Never married0.0% Now married0.0% Separated0.0% Widowed100.0% Divorced
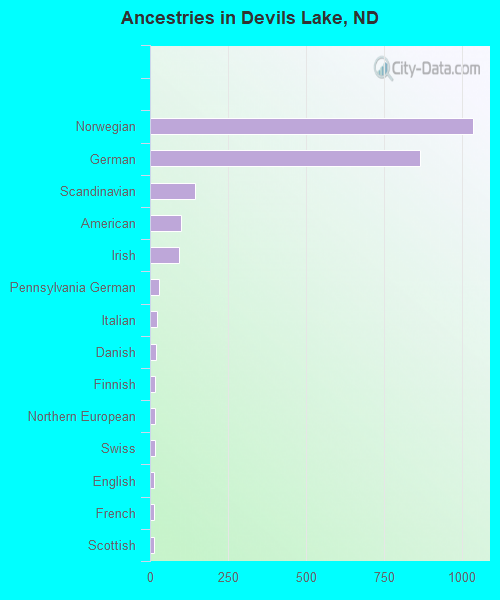
Ancestries in Devils Lake
1,035 33.3% Norwegian866 27.9% German144 4.6% Scandinavian98 3.2% American94 3.0% Irish30 1.0% Pennsylvania German21 0.7% Italian19 0.6% Danish17 0.5% Finnish16 0.5% Northern European15 0.5% Swiss12 0.4% English12 0.4% French12 0.4% Scottish6 0.2% Liberian6 0.2% Welsh3 0.10% French Canadian3 0.10% Serbian2 0.06% British1 0.03% Ethiopian
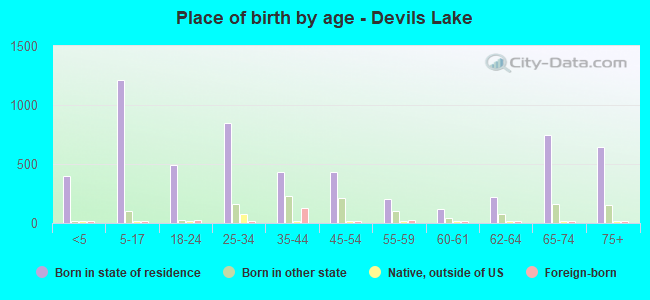
Children Nativity (place of birth) in Devils Lake
Children under 6 years - Living with two parents Both parents native 279 100.0% NativeChildren under 6 years - Living with one parent Native parent 106 100.0% Native
Children 6 to 17 years - Living with two parents Both parents native 609 100.0% NativeChildren 6 to 17 years - Living with one parent Native parent 503 100.0% Native
Grandparents responsible for own grandchildren in Devils Lake
Grandparents (30 to 59 years) White / Caucasian 4 23.1% Responsible for grandchildren15 76.9% Not responsible for grandchildrenWhite alone, not Hispanic / Latino 4 20.2% Responsible for grandchildren17 79.8% Not responsible for grandchildren
Grandparents (60 years and over)