Races in Discovery-Spring Garden, Maryland (MD) Detailed Stats
Ancestries, Foreign-born residents, place of birth

Discuss Discovery-Spring Garden, Maryland races on our local forum with over 2,400,000 registered users
5.7% of Discovery-Spring Garden, MD residents are foreign-born (3.6% born in Europe, 1.8% born in Latin America), which is 182.2% less than the foreign-born rate of 16.0% across the entire state of Maryland.
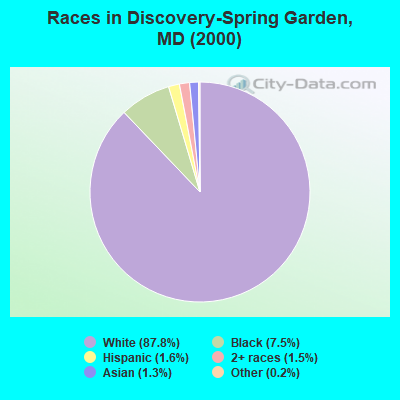
Race distribution in Discovery-Spring Garden

- 1,88987.8%White alone
- 1627.5%Black alone
- 341.6%Hispanic
- 331.5%Two or more races
- 271.3%Asian alone
- 40.2%Other race alone
- 20.09%Native Hawaiian and Other
Pacific Islander alone - 10.05%American Indian alone
2000
2022
-
- 3,286,54762.1%White alone
- 1,464,73527.7%Black alone
- 227,9164.3%Hispanic
- 209,7384.0%Asian alone
- 82,9461.6%Two or more races
- 13,3120.3%American Indian alone
- 9,3790.2%Other race alone
- 1,9130.04%Native Hawaiian and Other
Pacific Islander alone

-
- 2,906,49247.1%White alone
- 1,800,91429.2%Black alone
- 705,84211.4%Hispanic
- 401,8186.5%Asian alone
- 291,3174.7%Two or more races
- 46,9300.8%Other race alone
- 8,9300.1%American Indian alone
- 2,4170.04%Native Hawaiian and Other
Pacific Islander alone

Income and house value in Discovery-Spring Garden
- Median household income in 2022
- $94,637White non-Hispanic householders
- $194,560Black householders
- $125,377Some other race householders
- $157,331Hispanic or Latino race householders
- Median 2022 house value
- $344,415White Non-Hispanic householders
- $358,495Black or African American householders
- $387,220Some other race householders
- $387,220Hispanic or Latino householders
Household income for White non-Hispanic householders

Household income for Black householders

Household income for Hispanic or Latino race householders

Foreign-born residents in Discovery-Spring Garden
122 residents are foreign born (3.6% Europe, 1.8% Latin America).
| This city: | 5.7% |
| Maryland: | 9.8% |
Ancestries in Discovery-Spring Garden

- 46721.3%German
- 38917.7%Other
- 35416.1%Irish
- 2189.9%English
- 1898.6%United States
- 1165.3%Italian
- 1004.6%Scottish
- 843.8%Russian
- 572.6%French
- 421.9%French Canadian
- 391.8%Dutch
- 331.5%Czech
- 331.5%Polish
- 221.0%Ukrainian
- 180.8%Welsh
- 150.7%Slovak
- 90.4%Swiss
- 70.3%Danish

Zip codes: 21793.