Races in Dishman, Washington (WA) Detailed Stats
Ancestries, Foreign-born residents, place of birth

Recent posts about races in Dishman, Washington on our local forum with over 2,400,000 registered users:
 | Where are the rental houses?! (7 replies) |
| Spokane versus Spokane Valley. What is the difference? (16 replies) |
| Semi rural near Spokane (5 replies) |
| Didn't there used to be a railroad line parelleling Sprague Avenue in the Valley area? (4 replies) |
| parks and walking trails (4 replies) |
2.5% of Dishman, WA residents are foreign-born (0.9% born in Asia, 0.8% born in Europe, 0.5% born in Latin America, 0.3% born in North America), which is 511.6% less than the foreign-born rate of 15.0% across the entire state of Washington.
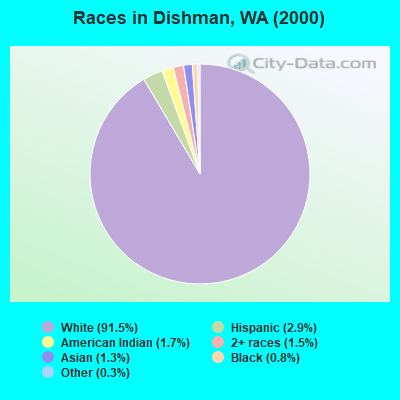
Race distribution in Dishman

- 9,17691.5%White alone
- 2902.9%Hispanic
- 1721.7%American Indian alone
- 1521.5%Two or more races
- 1301.3%Asian alone
- 810.8%Black alone
- 270.3%Other race alone
- 30.03%Native Hawaiian and Other
Pacific Islander alone
2000
2022
-
- 4,652,49078.9%White alone
- 441,5097.5%Hispanic
- 319,4015.4%Asian alone
- 184,6313.1%Black alone
- 175,9263.0%Two or more races
- 85,3961.4%American Indian alone
- 22,7790.4%Native Hawaiian and Other
Pacific Islander alone - 11,9890.2%Other race alone

-
- 4,941,45663.5%White alone
- 1,093,31314.0%Hispanic
- 755,8329.7%Asian alone
- 523,4486.7%Two or more races
- 299,5373.8%Black alone
- 69,0240.9%American Indian alone
- 52,2310.7%Native Hawaiian and Other
Pacific Islander alone - 50,9450.7%Other race alone

Income and house value in Dishman
- Median household income in 2022
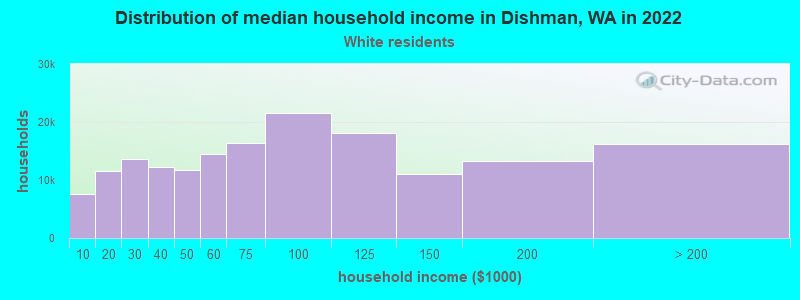
- $61,493White non-Hispanic householders
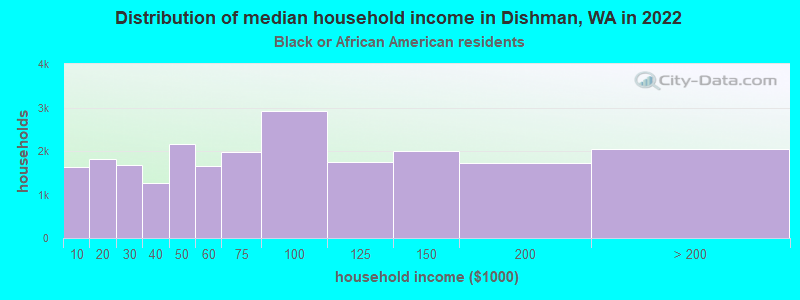
- $11,594Black householders
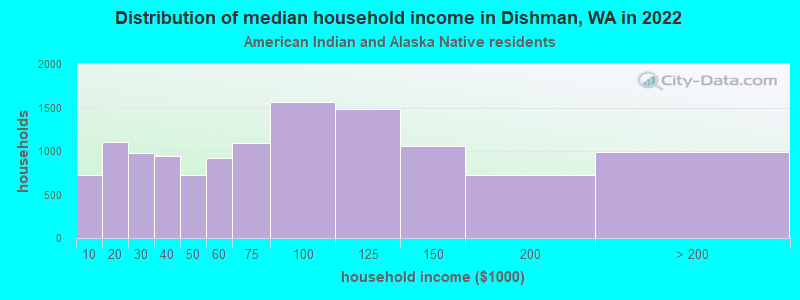
- $60,154American Indian and Alaska Native householders
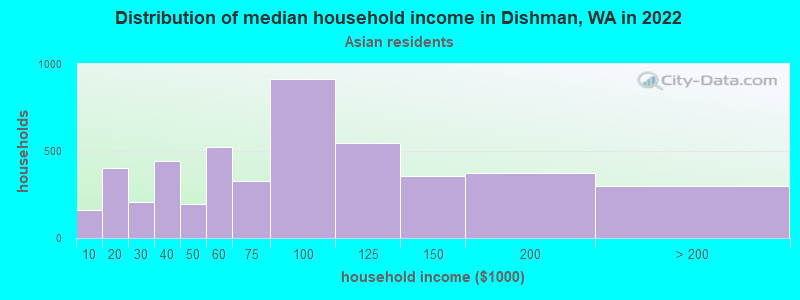
- $100,535Asian householders
- $39,306Some other race householders
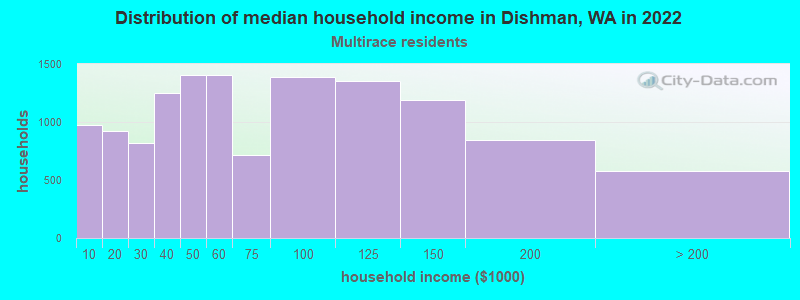
- $56,121Two or more races householders
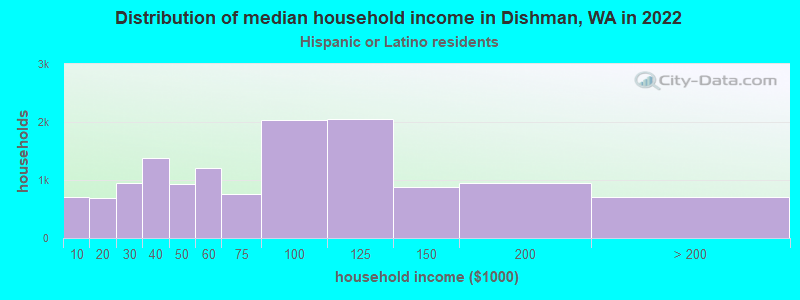
- $99,151Hispanic or Latino race householders
- Median 2022 house value
- $378,508White Non-Hispanic householders
- $242,873Black or African American householders
- $362,815American Indian or Alaska Native householders
- $420,357Some other race householders
- $392,333Two or more races householders
- $432,687Hispanic or Latino householders
Household income for White non-Hispanic householders
Household income for Black householders
Household income for American Indian and Alaska Native householders
Household income for Asian householders
Household income for Two or more races householders
Household income for Hispanic or Latino race householders
Foreign-born residents in Dishman
246 residents are foreign born (0.9% Asia, 0.8% Europe, 0.5% Latin America, 0.3% North America).
| This city: | 2.5% |
| Washington: | 10.4% |
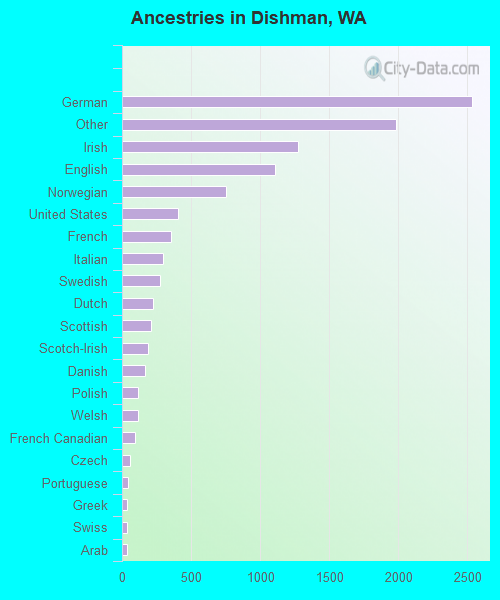
Ancestries in Dishman

- 2,53224.4%German
- 1,98519.2%Other
- 1,27312.3%Irish
- 1,10510.7%English
- 7537.3%Norwegian
- 4063.9%United States
- 3583.5%French
- 2972.9%Italian
- 2752.7%Swedish
- 2252.2%Dutch
- 2072.0%Scottish
- 1851.8%Scotch-Irish
- 1681.6%Danish
- 1191.1%Polish
- 1151.1%Welsh
- 920.9%French Canadian
- 590.6%Czech
- 450.4%Portuguese
- 390.4%Greek
- 380.4%Swiss
- 360.3%Arab
- 200.2%Russian
- 70.07%Hungarian
- 70.07%Ukrainian
- 60.06%Lithuanian
- 50.05%Slovak
Zip codes: 99206.