Races in District 2, Uniontown, Maryland (MD) Detailed Stats
Ancestries, Foreign-born residents, place of birth
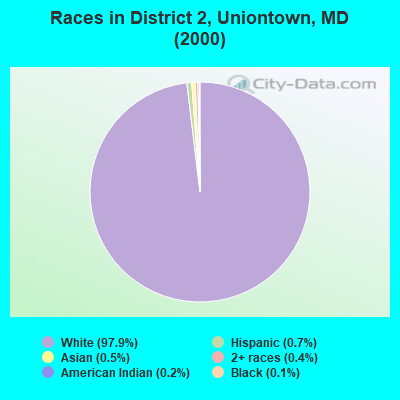
Race distribution in District 2, Uniontown

- 4,10297.9%White alone
- 280.7%Hispanic
- 210.5%Asian alone
- 170.4%Two or more races
- 90.2%American Indian alone
- 60.1%Black alone
- 30.07%Other race alone
- 20.05%Native Hawaiian and Other
Pacific Islander alone
2000
2022
-
- 3,286,54762.1%White alone
- 1,464,73527.7%Black alone
- 227,9164.3%Hispanic
- 209,7384.0%Asian alone
- 82,9461.6%Two or more races
- 13,3120.3%American Indian alone
- 9,3790.2%Other race alone
- 1,9130.04%Native Hawaiian and Other
Pacific Islander alone

-
- 2,906,49247.1%White alone
- 1,800,91429.2%Black alone
- 705,84211.4%Hispanic
- 401,8186.5%Asian alone
- 291,3174.7%Two or more races
- 46,9300.8%Other race alone
- 8,9300.1%American Indian alone
- 2,4170.04%Native Hawaiian and Other
Pacific Islander alone

Income and house value in District 2, Uniontown
- Median household income in 2022
- $100,255White non-Hispanic householders
- $60,162Two or more races householders
- $4,538Hispanic or Latino race householders
- Median 2022 house value
- $432,859White Non-Hispanic householders
- $700,214Two or more races householders
- $891,181Hispanic or Latino householders
Household income for White non-Hispanic householders

Household income for American Indian and Alaska Native householders

Household income for Two or more races householders

Household income for Hispanic or Latino race householders

Zip code: 21158