Races in Dix Hills, New York (NY) Detailed Stats
Data:
Races - White alone (%)
Races - White alone (% change since 2000)
Races - Black alone (%)
Races - Black alone (% change since 2000)
Races - American Indian alone (%)
Races - American Indian alone (% change since 2000)
Races - Asian alone (%)
Races - Asian alone (% change since 2000)
Races - Hispanic (%)
Races - Hispanic (% change since 2000)
Races - Native Hawaiian and Other Pacific Islander alone (%)
Races - Native Hawaiian and Other Pacific Islander alone (% change since 2000)
Races - Two or more races(%)
Races - Two or more races(% change since 2000)
Races - Other race alone (%)
Races - Other race alone (% change since 2000)
Racial diversity
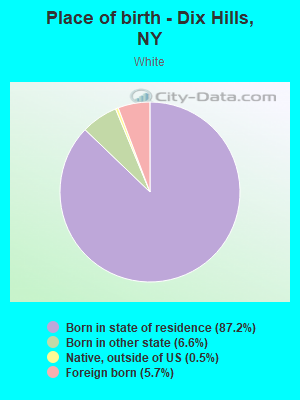
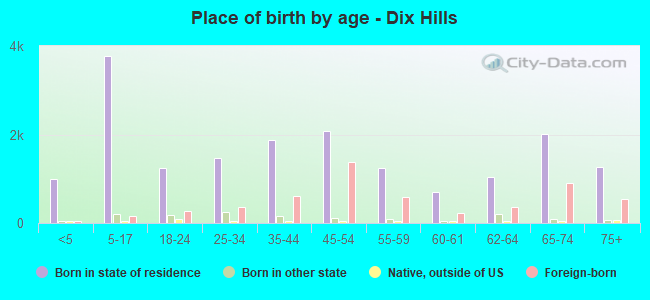
Place of birth - Born in state of residence (%)
Place of birth - Born in state of residence (%) - White
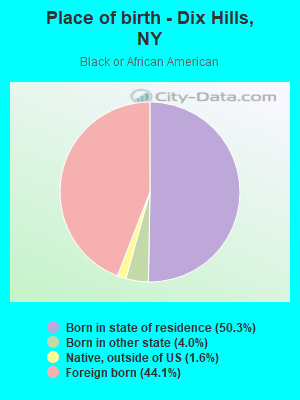
Place of birth - Born in state of residence (%) - Black or African American
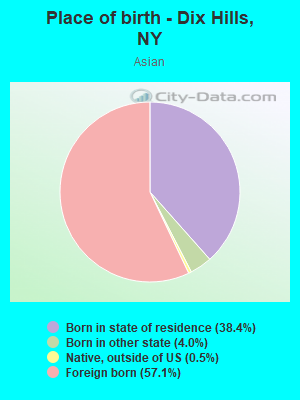
Place of birth - Born in state of residence (%) - Asian
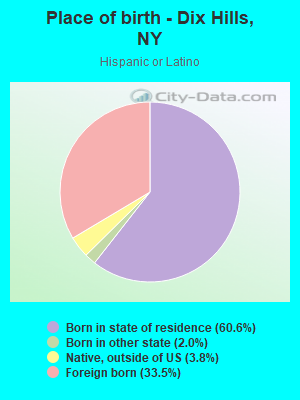
Place of birth - Born in state of residence (%) - Hispanic or Latino
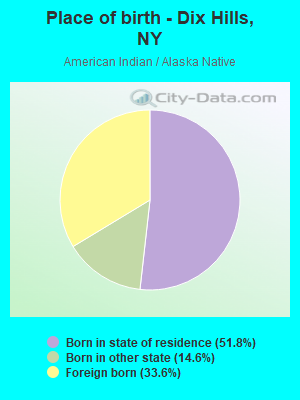
Place of birth - Born in state of residence (%) - American Indian and Alaska Native
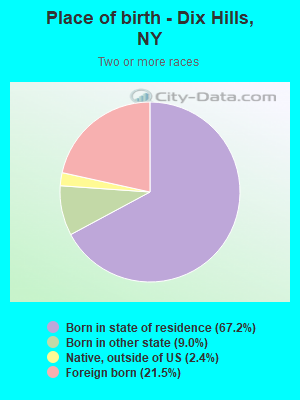
Place of birth - Born in state of residence (%) - Multirace
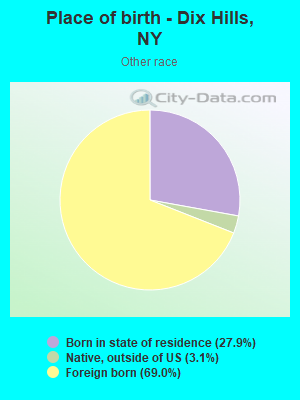
Place of birth - Born in state of residence (%) - Other Race
Place of birth - Born in other state (%)
Place of birth - Born in other state (%) - White
Place of birth - Born in other state (%) - Black or African American
Place of birth - Born in other state (%) - Asian
Place of birth - Born in other state (%) - Hispanic or Latino
Place of birth - Born in other state (%) - American Indian and Alaska Native
Place of birth - Born in other state (%) - Multirace
Place of birth - Born in other state (%) - Other Race
Place of birth - Native, outside of US (%)
Place of birth - Native, outside of US (%) - White
Place of birth - Native, outside of US (%) - Black or African American
Place of birth - Native, outside of US (%) - Asian
Place of birth - Native, outside of US (%) - Hispanic or Latino
Place of birth - Native, outside of US (%) - American Indian and Alaska Native
Place of birth - Native, outside of US (%) - Multirace
Place of birth - Native, outside of US (%) - Other Race
Place of birth - Foreign born (%)
Place of birth - Foreign born (%) - White
Place of birth - Foreign born (%) - Black or African American
Place of birth - Foreign born (%) - Asian
Place of birth - Foreign born (%) - Hispanic or Latino
Place of birth - Foreign born (%) - American Indian and Alaska Native
Place of birth - Foreign born (%) - Multirace
Place of birth - Foreign born (%) - Other Race
Residents speaking English at home (%)
Residents speaking English at home - Born in the United States (%)
Residents speaking English at home - Native, born elsewhere (%)
Residents speaking English at home - Foreign born (%)
Residents speaking Spanish at home (%)
Residents speaking Spanish at home - Born in the United States (%)
Residents speaking Spanish at home - Native, born elsewhere (%)
Residents speaking Spanish at home - Foreign born (%)
Residents speaking other language at home (%)
Residents speaking other language at home - Born in the United States (%)
Residents speaking other language at home - Native, born elsewhere (%)
Residents speaking other language at home - Foreign born (%)
Marital status - Never married (%)
Marital status - Now married (%)
Marital status - Separated (%)
Marital status - Widowed (%)
Marital status - Divorced (%)
Ancestries Reported - Arab (%)
Ancestries Reported - Czech (%)
Ancestries Reported - Danish (%)
Ancestries Reported - Dutch (%)
Ancestries Reported - English (%)
Ancestries Reported - French (%)
Ancestries Reported - French Canadian (%)
Ancestries Reported - German (%)
Ancestries Reported - Greek (%)
Ancestries Reported - Hungarian (%)
Ancestries Reported - Irish (%)
Ancestries Reported - Italian (%)
Ancestries Reported - Lithuanian (%)
Ancestries Reported - Norwegian (%)
Ancestries Reported - Polish (%)
Ancestries Reported - Portuguese (%)
Ancestries Reported - Russian (%)
Ancestries Reported - Scotch-Irish (%)
Ancestries Reported - Scottish (%)
Ancestries Reported - Slovak (%)
Ancestries Reported - Subsaharan African (%)
Ancestries Reported - Swedish (%)
Ancestries Reported - Swiss (%)
Ancestries Reported - Ukrainian (%)
Ancestries Reported - United States (%)
Ancestries Reported - Welsh (%)
Ancestries Reported - West Indian (%)
Ancestries Reported - Other (%)
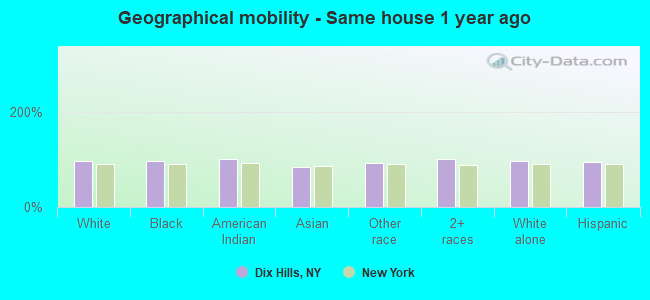
Geographical mobility - Same house 1 year ago (%)
Geographical mobility - Same house 1 year ago (%) - White
Geographical mobility - Same house 1 year ago (%) - Black or African American
Geographical mobility - Same house 1 year ago (%) - Asian
Geographical mobility - Same house 1 year ago (%) - Hispanic or Latino
Geographical mobility - Same house 1 year ago (%) - American Indian and Alaska Native
Geographical mobility - Same house 1 year ago (%) - Multirace
Geographical mobility - Same house 1 year ago (%) - Other Race
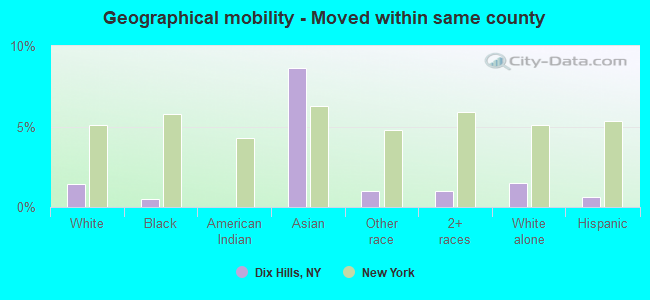
Geographical mobility - Moved within same county (%)
Geographical mobility - Moved within same county (%) - White
Geographical mobility - Moved within same county (%) - Black or African American
Geographical mobility - Moved within same county (%) - Asian
Geographical mobility - Moved within same county (%) - Hispanic or Latino
Geographical mobility - Moved within same county (%) - American Indian and Alaska Native
Geographical mobility - Moved within same county (%) - Multirace
Geographical mobility - Moved within same county (%) - Other Race
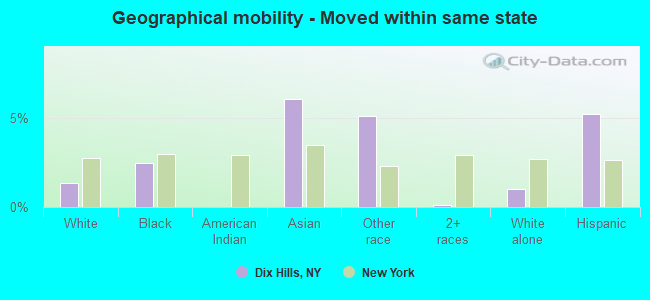
Geographical mobility - Moved from different county within same state (%)
Geographical mobility - Moved from different county within same state (%) - White
Geographical mobility - Moved from different county within same state (%) - Black or African American
Geographical mobility - Moved from different county within same state (%) - Asian
Geographical mobility - Moved from different county within same state (%) - Hispanic or Latino
Geographical mobility - Moved from different county within same state (%) - American Indian and Alaska Native
Geographical mobility - Moved from different county within same state (%) - Multirace
Geographical mobility - Moved from different county within same state (%) - Other Race
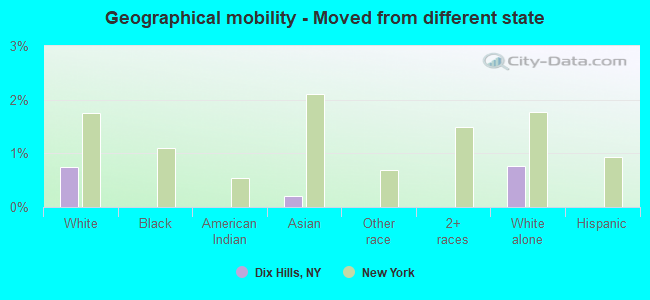
Geographical mobility - Moved from different state (%)
Geographical mobility - Moved from different state (%) - White
Geographical mobility - Moved from different state (%) - Black or African American
Geographical mobility - Moved from different state (%) - Asian
Geographical mobility - Moved from different state (%) - Hispanic or Latino
Geographical mobility - Moved from different state (%) - American Indian and Alaska Native
Geographical mobility - Moved from different state (%) - Multirace
Geographical mobility - Moved from different state (%) - Other Race
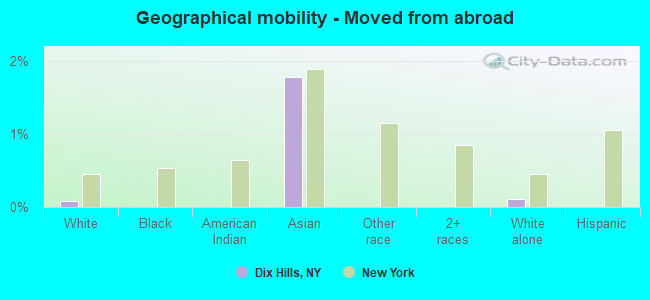
Geographical mobility - Moved from abroad (%)
Geographical mobility - Moved from abroad (%) - White
Geographical mobility - Moved from abroad (%) - Black or African American
Geographical mobility - Moved from abroad (%) - Asian
Geographical mobility - Moved from abroad (%) - Hispanic or Latino
Geographical mobility - Moved from abroad (%) - American Indian and Alaska Native
Geographical mobility - Moved from abroad (%) - Multirace
Geographical mobility - Moved from abroad (%) - Other Race
Place of birth for the foreign-born population - Ireland (%)
Place of birth for the foreign-born population - Denmark (%)
Place of birth for the foreign-born population - Norway (%)
Place of birth for the foreign-born population - Sweden (%)
Place of birth for the foreign-born population - United Kingdom (%)
Place of birth for the foreign-born population - England (%)
Place of birth for the foreign-born population - Scotland (%)
Place of birth for the foreign-born population - Other Northern Europe (%)
Place of birth for the foreign-born population - Austria (%)
Place of birth for the foreign-born population - Belgium (%)
Place of birth for the foreign-born population - France (%)
Place of birth for the foreign-born population - Germany (%)
Place of birth for the foreign-born population - Netherlands (%)
Place of birth for the foreign-born population - Switzerland (%)
Place of birth for the foreign-born population - Other Western Europe (%)
Place of birth for the foreign-born population - Greece (%)
Place of birth for the foreign-born population - Italy (%)
Place of birth for the foreign-born population - Portugal (%)
Place of birth for the foreign-born population - Spain (%)
Place of birth for the foreign-born population - Other Southern Europe (%)
Place of birth for the foreign-born population - Albania (%)
Place of birth for the foreign-born population - Belarus (%)
Place of birth for the foreign-born population - Bosnia and Herzegovina (%)
Place of birth for the foreign-born population - Bulgaria (%)
Place of birth for the foreign-born population - Croatia (%)
Place of birth for the foreign-born population - Czechoslovakia (%)
Place of birth for the foreign-born population - Hungary (%)
Place of birth for the foreign-born population - Latvia (%)
Place of birth for the foreign-born population - Lithuania (%)
Place of birth for the foreign-born population - North Macedonia (Macedonia) (%)
Place of birth for the foreign-born population - Moldova (%)
Place of birth for the foreign-born population - Poland (%)
Place of birth for the foreign-born population - Romania (%)
Place of birth for the foreign-born population - Russia (%)
Place of birth for the foreign-born population - Serbia (%)
Place of birth for the foreign-born population - Ukraine (%)
Place of birth for the foreign-born population - Other Eastern Europe (%)
Place of birth for the foreign-born population - China (%)
Place of birth for the foreign-born population - Hong Kong (%)
Place of birth for the foreign-born population - Taiwan (%)
Place of birth for the foreign-born population - Japan (%)
Place of birth for the foreign-born population - Korea (%)
Place of birth for the foreign-born population - Other Eastern Asia (%)
Place of birth for the foreign-born population - Afghanistan (%)
Place of birth for the foreign-born population - Bangladesh (%)
Place of birth for the foreign-born population - India (%)
Place of birth for the foreign-born population - Iran (%)
Place of birth for the foreign-born population - Kazakhstan (%)
Place of birth for the foreign-born population - Nepal (%)
Place of birth for the foreign-born population - Pakistan (%)
Place of birth for the foreign-born population - Sri Lanka (%)
Place of birth for the foreign-born population - Uzbekistan (%)
Place of birth for the foreign-born population - Other South Central Asia (%)
Place of birth for the foreign-born population - Burma (%)
Place of birth for the foreign-born population - Cambodia (%)
Place of birth for the foreign-born population - Indonesia (%)
Place of birth for the foreign-born population - Laos (%)
Place of birth for the foreign-born population - Malaysia (%)
Place of birth for the foreign-born population - Philippines (%)
Place of birth for the foreign-born population - Singapore (%)
Place of birth for the foreign-born population - Thailand (%)
Place of birth for the foreign-born population - Vietnam (%)
Place of birth for the foreign-born population - Other South Eastern Asia (%)
Place of birth for the foreign-born population - Armenia (%)
Place of birth for the foreign-born population - Iraq (%)
Place of birth for the foreign-born population - Israel (%)
Place of birth for the foreign-born population - Jordan (%)
Place of birth for the foreign-born population - Kuwait (%)
Place of birth for the foreign-born population - Lebanon (%)
Place of birth for the foreign-born population - Saudi Arabia (%)
Place of birth for the foreign-born population - Syria (%)
Place of birth for the foreign-born population - Turkey (%)
Place of birth for the foreign-born population - Yemen (%)
Place of birth for the foreign-born population - Other Western Asia (%)
Place of birth for the foreign-born population - Eritrea (%)
Place of birth for the foreign-born population - Ethiopia (%)
Place of birth for the foreign-born population - Kenya (%)
Place of birth for the foreign-born population - Somalia (%)
Place of birth for the foreign-born population - Uganda (%)
Place of birth for the foreign-born population - Zimbabwe (%)
Place of birth for the foreign-born population - Other Eastern Africa (%)
Place of birth for the foreign-born population - Cameroon (%)
Place of birth for the foreign-born population - Congo (%)
Place of birth for the foreign-born population - Democratic Republic of Congo (Zaire) (%)
Place of birth for the foreign-born population - Other Middle Africa (%)
Place of birth for the foreign-born population - Egypt (%)
Place of birth for the foreign-born population - Morocco (%)
Place of birth for the foreign-born population - Sudan (%)
Place of birth for the foreign-born population - Other Northern Africa (%)
Place of birth for the foreign-born population - South Africa (%)
Place of birth for the foreign-born population - Other Southern Africa (%)
Place of birth for the foreign-born population - Cabo Verde (%)
Place of birth for the foreign-born population - Ghana (%)
Place of birth for the foreign-born population - Liberia (%)
Place of birth for the foreign-born population - Nigeria (%)
Place of birth for the foreign-born population - Senegal (%)
Place of birth for the foreign-born population - Sierra Leone (%)
Place of birth for the foreign-born population - Other Western Africa (%)
Place of birth for the foreign-born population - Australia (%)
Place of birth for the foreign-born population - New Zealand (%)
Place of birth for the foreign-born population - Fiji (%)
Place of birth for the foreign-born population - Micronesia (%)
Place of birth for the foreign-born population - Bahamas (%)
Place of birth for the foreign-born population - Barbados (%)
Place of birth for the foreign-born population - Cuba (%)
Place of birth for the foreign-born population - Dominica (%)
Place of birth for the foreign-born population - Dominican Republic (%)
Place of birth for the foreign-born population - Grenada (%)
Place of birth for the foreign-born population - Haiti (%)
Place of birth for the foreign-born population - Jamaica (%)
Place of birth for the foreign-born population - St. Vincent and the Grenadines (%)
Place of birth for the foreign-born population - Trinidad and Tobago (%)
Place of birth for the foreign-born population - West Indies (%)
Place of birth for the foreign-born population - Other Caribbean (%)
Place of birth for the foreign-born population - Belize (%)
Place of birth for the foreign-born population - Costa Rica (%)
Place of birth for the foreign-born population - El Salvador (%)
Place of birth for the foreign-born population - Guatemala (%)
Place of birth for the foreign-born population - Honduras (%)
Place of birth for the foreign-born population - Mexico (%)
Place of birth for the foreign-born population - Nicaragua (%)
Place of birth for the foreign-born population - Panama (%)
Place of birth for the foreign-born population - Other Central America (%)
Place of birth for the foreign-born population - Argentina (%)
Place of birth for the foreign-born population - Bolivia (%)
Place of birth for the foreign-born population - Brazil (%)
Place of birth for the foreign-born population - Chile (%)
Place of birth for the foreign-born population - Colombia (%)
Place of birth for the foreign-born population - Ecuador (%)
Place of birth for the foreign-born population - Guyana (%)
Place of birth for the foreign-born population - Peru (%)
Place of birth for the foreign-born population - Uruguay (%)
Place of birth for the foreign-born population - Venezuela (%)
Place of birth for the foreign-born population - Other South America (%)
Place of birth for the foreign-born population - Canada (%)
Place of birth for the foreign-born population - Other Northern America (%)
Place of birth for the foreign-born population - Other (%)
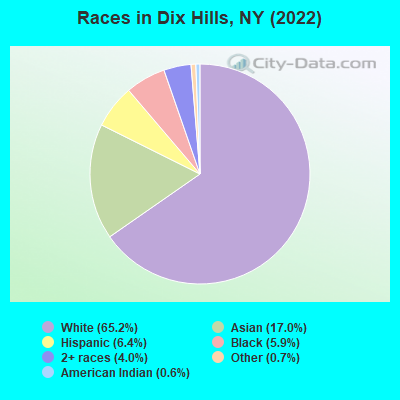
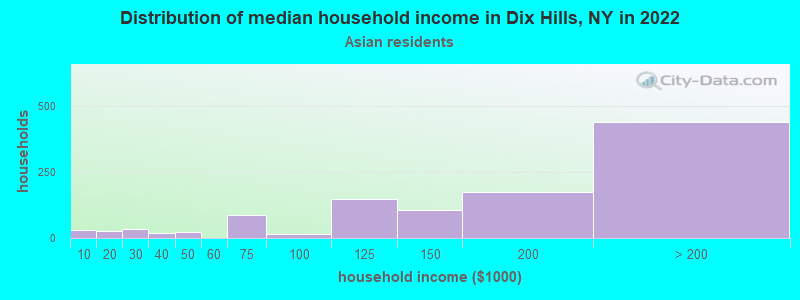
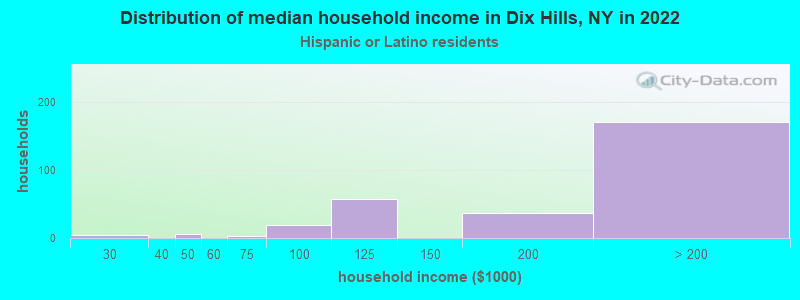
According to 2022 data, the most numerous races in Dix Hills, NY are White alone (16,074 residents), Hispanic (1,578 residents), and Black alone (1,446 residents). 71.4% of Dix Hills residents speak English at home. 19.9% of Dix Hills, NY residents are foreign-born (11.3% born in Asia, 4.1% born in Latin America, 3.1% born in Europe), which is 10.4% less than the foreign-born rate of 22.0% across the entire state of New York.
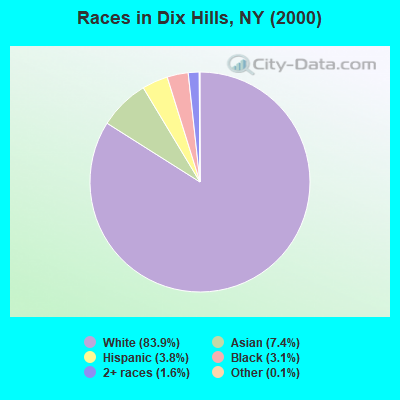
Race distribution in Dix Hills
2000 2022
11,760,981 62.0% White alone 2,867,583 15.1% Hispanic 2,812,623 14.8% Black alone 1,035,926 5.5% Asian alone 366,116 1.9% Two or more races 75,499 0.4% Other race alone 52,499 0.3% American Indian alone 5,230 0.03% Native Hawaiian and Other
10,408,933 52.9% White alone 3,867,299 19.7% Hispanic 2,633,840 13.4% Black alone 1,776,286 9.0% Asian alone 732,670 3.7% Two or more races 216,110 1.1% Other race alone 35,082 0.2% American Indian alone 6,931 0.04% Native Hawaiian and Other
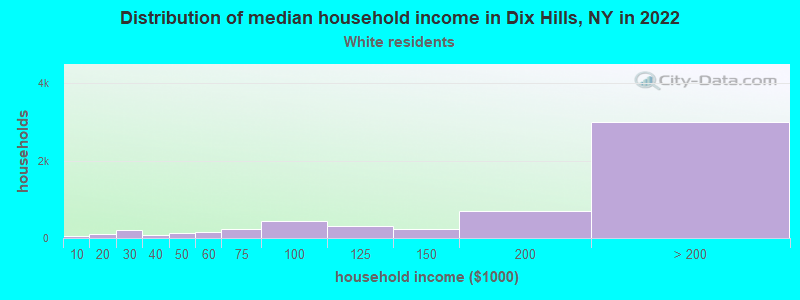
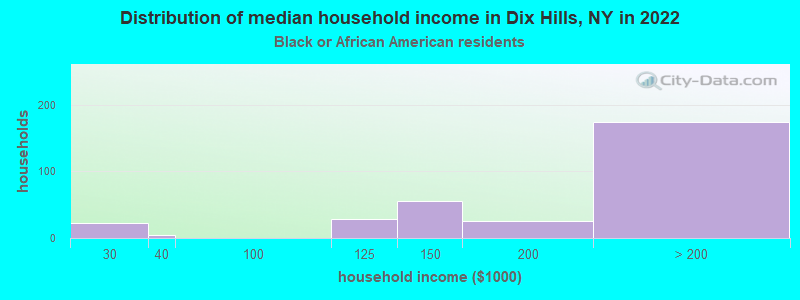
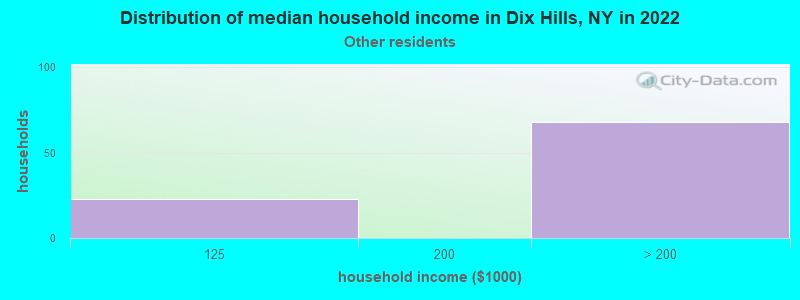
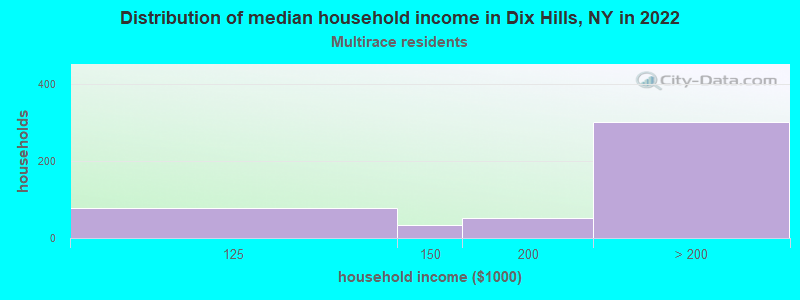
Income and house value in Dix Hills Median household income in 2022 over $200,000 White non-Hispanic householdersover $200,000 Black householders$184,156 Asian householdersover $200,000 Some other race householdersover $200,000 Two or more races householdersover $200,000 Hispanic or Latino race householdersMedian 2022 house value $934,959 White Non-Hispanic householders$873,952 Black or African American householders$544,707 American Indian or Alaska Native householders over $1,000,000 Asian householders$860,153 Some other race householdersover $1,000,000 Two or more races householders$814,397 Hispanic or Latino householders
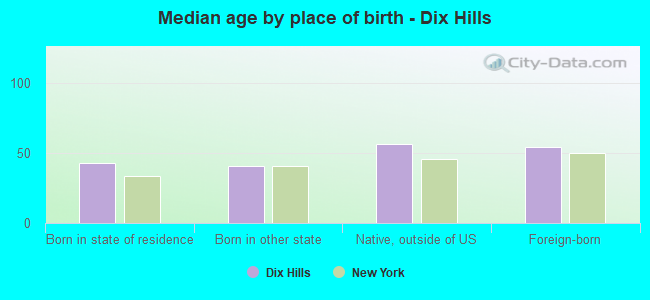
Median age by race in Dix Hills
52.3 Median age for White residents50.9 54.4 49.7 Median age for Black or African American residents43.9 52.3 31.3 Median age for American Indian / Alaska Native residents-807,017,543.1 -513,692,161.9 43.5 Median age for Asian residents41.6 44.4 -742,816,091.2 Median age for Native Hawaiian / Pacific Islander residents-831,187,409.8 -771,300,447.7 29.2 Median age for Other race residents42.2 26.2 23.2 Median age for Two or more races residents15.8 27.8 51.0 Median age for White alone residents49.8 53.7 33.3 Median age for Hispanic or Latino residents31.5 39.4
Owner/renter occupied households by race in Dix Hills
House owners and renters - White residents 5,470 97.0% Owner occupied172 3.0% Renter occupiedHouse owners and renters - Black or African American residents 341 95.6% Owner occupied16 4.4% Renter occupiedHouse owners and renters - American Indian / Alaska Native residents 32 100.0% Owner occupiedHouse owners and renters - Asian residents 1,102 96.2% Owner occupied43 3.8% Renter occupiedHouse owners and renters - Other race residents 93 100.0% Owner occupiedHouse owners and renters - Two or more races residents 441 95.6% Owner occupied20 4.4% Renter occupiedHouse owners and renters - White alone residents 5,589 97.1% Owner occupied167 2.9% Renter occupiedHouse owners and renters - Hispanic or Latino residents 269 87.9% Owner occupied37 12.1% Renter occupied
Language usage in Dix Hills
English speakers - Total 71.4% of residents of Dix Hills speak English at home.
3.4% of residents speak Spanish at home 632 77.8% Speak English very well180 22.2% Speak English less than very well26.5% of residents speak other language at home 4,982 79.6% Speak English very well1,275 20.4% Speak English less than very well
English speakers - Born in the United States 88.3% of residents of Dix Hills speak English at home.
0.3% of residents speak Spanish at home 5 100.0% Speak English very well13.1% of residents speak other language at home 148 79.1% Speak English very well39 20.9% Speak English less than very well
English speakers - Native, born elsewhere 70.4% of residents of Dix Hills speak English at home.
17.1% of residents speak Spanish at home 37 100.0% Speak English very well26.4% of residents speak other language at home 57 100.0% Speak English very well
English speakers - Foreign-born 16.5% of residents of Dix Hills speak English at home.
8.6% of residents speak Spanish at home 299 65.1% Speak English very well160 34.9% Speak English less than very well72.3% of residents speak other language at home 2,821 73.2% Speak English very well1,033 26.8% Speak English less than very well
White (Caucasian) - Speak only English Native:
94.0% (13,126)Foreign-born:
40.8% (363)
White (Caucasian) - Speak another language Native:
5.8% (803)Foreign-born:
62.6% (557)
Black or African American - Speak only English Native:
86.1% (725)Foreign-born:
34.3% (229)
Black or African American - Speak another language Native:
14.6% (123)Foreign-born:
61.7% (412)
American Indian / Alaska Native - Speak another language Native:
30.2% (62)Foreign-born:
100.0% (118)
Asian - Speak only English Native:
45.3% (767)Foreign-born:
5.3% (128)
Asian - Speak another language Native:
54.7% (926)Foreign-born:
99.0% (2,380)
Other race - Speak only English Native:
5.8% (9)Foreign-born:
12.2% (45)
Other race - Speak another language Native:
90.3% (140)Foreign-born:
86.7% (320)
Two or more races - Speak only English Native:
83.0% (1,236)Foreign-born:
11.8% (53)
Two or more races - Speak another language Native:
17.7% (263)Foreign-born:
88.3% (395)
White alone - Speak only English Native:
92.5% (13,174)Foreign-born:
33.7% (367)
White alone - Speak another language Native:
7.7% (1,102)Foreign-born:
66.3% (722)
Hispanic or Latino - Speak only English Native:
67.4% (676)Foreign-born:
7.0% (37)
Hispanic or Latino - Speak another language Native:
33.7% (338)Foreign-born:
93.0% (490)
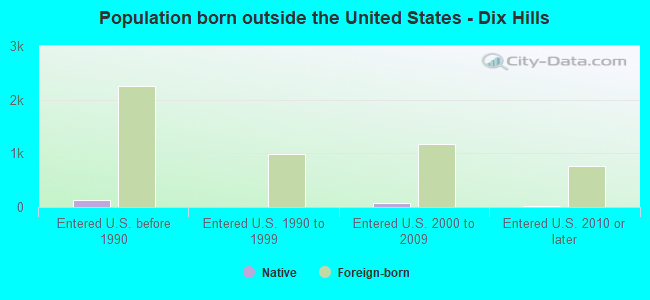
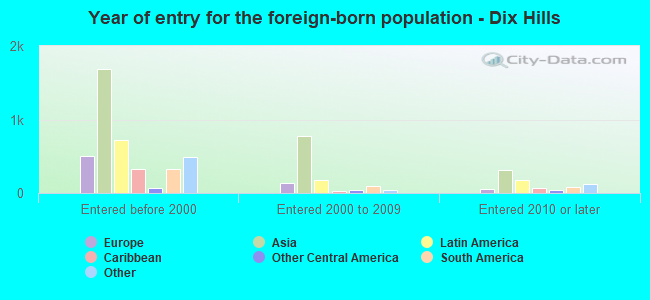
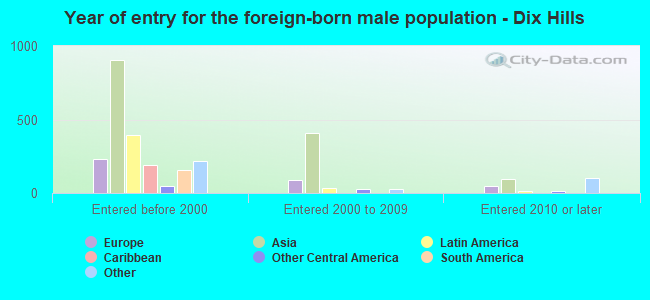
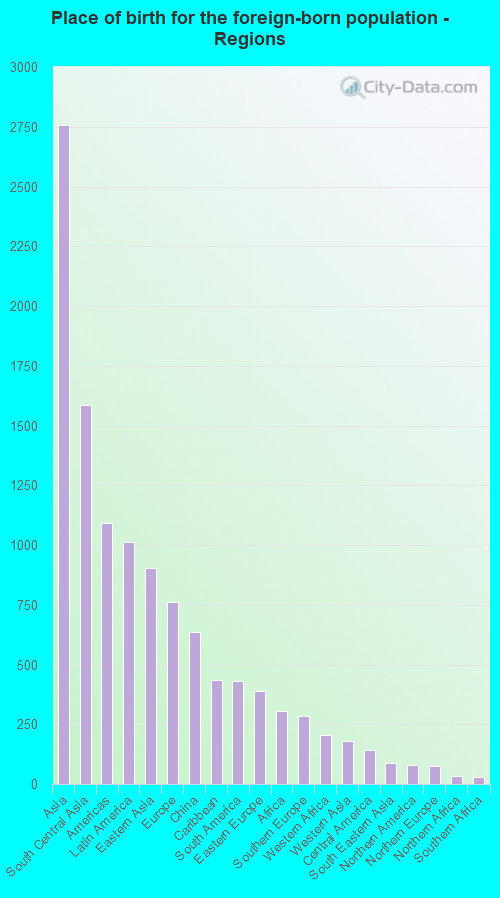
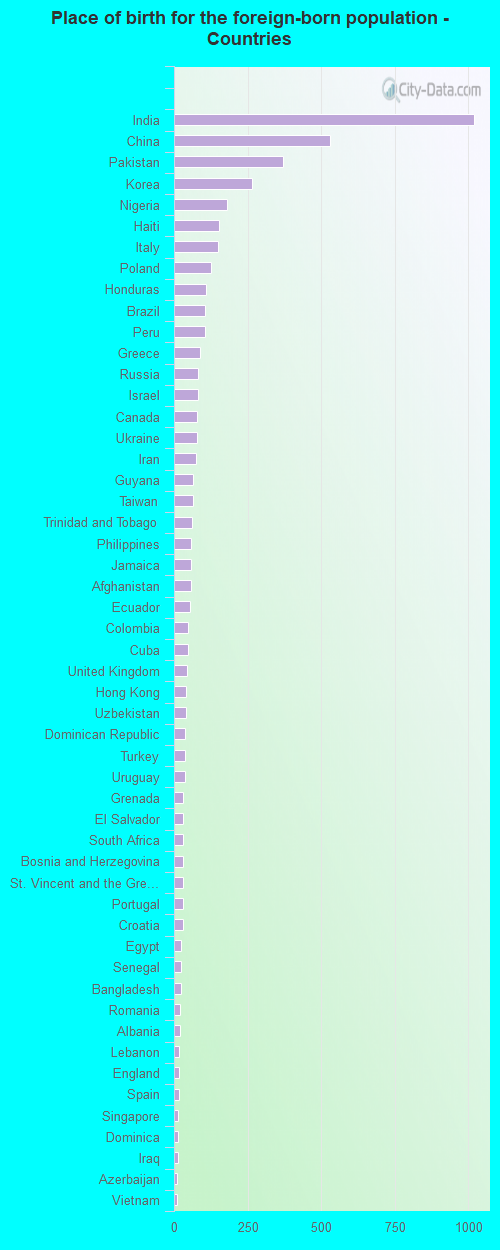
Foreign-born residents in Dix Hills 4,914 residents are foreign born (11.3% Asia , 4.1% Latin America , 3.1% Europe ).
This city:
19.9%New York:
22.6%
Marital status for residents in Dix Hills Marital status - White (Caucasian) population 15 years and over
Males 24.3% Never married66.8% Now married0.7% Separated1.7% Widowed6.6% DivorcedFemales 19.2% Never married64.7% Now married0.3% Separated8.0% Widowed7.8% DivorcedWomen who gave birth in the past 12 months Now married:
87.2% (148)Unmarried:
12.8% (22)
Women who did not give birth in the past 12 months Now married:
52.0% (1,240)Unmarried:
48.0% (1,146)
Marital status - Black or African American population 15 years and over
Males 44.6% Never married50.5% Now married0.0% Separated3.3% Widowed1.6% DivorcedFemales 28.9% Never married57.1% Now married0.0% Separated12.2% Widowed1.8% DivorcedWomen who did not give birth in the past 12 months Now married:
36.3% (92)Unmarried:
63.7% (162)
Marital status - American Indian / Alaska Native population 15 years and over
Males 100.0% Never married0.0% Now married0.0% Separated0.0% Widowed0.0% DivorcedFemales 66.3% Never married0.0% Now married0.0% Separated33.7% Widowed0.0% DivorcedMarital status - Asian population 15 years and over
Males 28.9% Never married65.9% Now married0.0% Separated4.4% Widowed0.9% DivorcedFemales 15.9% Never married69.6% Now married4.1% Separated8.4% Widowed2.0% DivorcedWomen who gave birth in the past 12 months Now married:
100.0% (9)Unmarried:
0.0% (0)
Women who did not give birth in the past 12 months Now married:
68.9% (688)Unmarried:
31.1% (310)
Marital status - Other race population 15 years and over
Males 46.7% Never married32.6% Now married0.0% Separated0.0% Widowed20.7% DivorcedFemales 16.8% Never married72.8% Now married3.2% Separated0.0% Widowed7.2% DivorcedWomen who did not give birth in the past 12 months Now married:
67.6% (179)Unmarried:
32.4% (86)
Marital status - Two or more races population 15 years and over
Males 33.8% Never married64.2% Now married0.0% Separated2.0% Widowed0.0% DivorcedFemales 37.3% Never married44.7% Now married0.0% Separated13.1% Widowed4.9% DivorcedWomen who did not give birth in the past 12 months Now married:
44.1% (192)Unmarried:
55.9% (243)
Marital status - White alone, not Hispanic / Latino population 15 years and over
Males 24.2% Never married66.7% Now married0.7% Separated1.7% Widowed6.7% DivorcedFemales 18.7% Never married64.8% Now married0.3% Separated8.3% Widowed7.9% DivorcedWomen who gave birth in the past 12 months Now married:
87.2% (161)Unmarried:
12.8% (23)
Women who did not give birth in the past 12 months Now married:
52.3% (1,291)Unmarried:
47.7% (1,178)
Marital status - Hispanic or Latino population 15 years and over
Males 37.1% Never married59.1% Now married0.0% Separated0.0% Widowed3.8% DivorcedFemales 27.3% Never married56.5% Now married1.3% Separated9.0% Widowed5.8% DivorcedWomen who did not give birth in the past 12 months Now married:
49.2% (186)Unmarried:
50.8% (192)
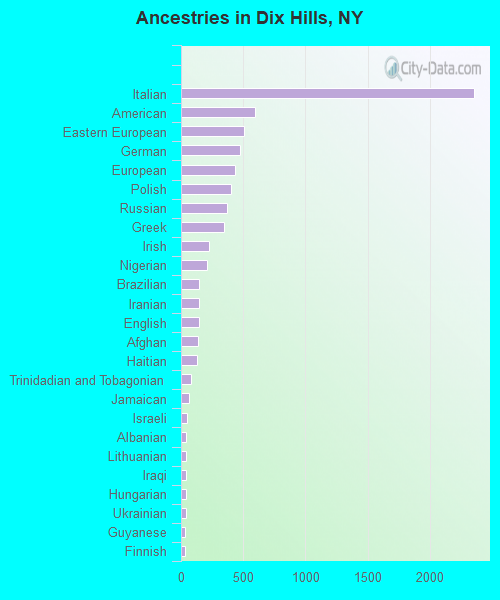
Ancestries in Dix Hills
2,357 18.9% Italian595 4.8% American509 4.1% Eastern European472 3.8% German435 3.5% European403 3.2% Polish368 2.9% Russian347 2.8% Greek229 1.8% Irish208 1.7% Nigerian148 1.2% Brazilian148 1.2% Iranian145 1.2% English137 1.1% Afghan126 1.0% Haitian82 0.7% Trinidadian and Tobagonian68 0.5% Jamaican51 0.4% Israeli43 0.3% Albanian42 0.3% Lithuanian38 0.3% Iraqi38 0.3% Hungarian38 0.3% Ukrainian35 0.3% Guyanese34 0.3% Finnish33 0.3% Portuguese32 0.3% Romanian30 0.2% Egyptian30 0.2% Palestinian30 0.2% Canadian29 0.2% Ghanaian28 0.2% Austrian27 0.2% British26 0.2% African24 0.2% French Canadian23 0.2% Scotch-Irish22 0.2% Norwegian21 0.2% Turkish21 0.2% Yugoslavian20 0.2% Moroccan18 0.1% Scandinavian17 0.1% Croatian14 0.1% Armenian10 0.08% Lebanese5 0.04% Czech2 0.02% Cape Verdean1 0.01% Danish
Geographical mobility in Dix Hills Same house 1 year ago 14,825 96.4% White (Caucasian)1,440 96.8% Black or African American282 100.0% American Indian / Alaska Native3,453 82.9% Asian484 92.8% Other race2,100 100.0% Two or more races15,349 96.5% White alone, not Hispanic / Latino1,493 94.5% Hispanic or LatinoMoved within same county 216 1.4% White / Caucasian7 0.5% Black or African American358 8.6% Asian5 1.0% Other race20 1.0% Two or more races233 1.5% White alone, not Hispanic / Latino10 0.6% Hispanic or LatinoMoved within same state 203 1.3% White / Caucasian37 2.5% Black or African American251 6.0% Asian27 5.1% Other race2 0.1% Two or more races156 1.0% White alone, not Hispanic / Latino82 5.2% Hispanic or LatinoMoved from different state 115 0.8% White / Caucasian9 0.2% Asian122 0.8% White alone, not Hispanic / LatinoMoved from abroad 13 0.1% White74 1.8% Asian17 0.1% White alone, not Hispanic / Latino
Children Nativity (place of birth) in Dix Hills
Children under 6 years - Living with two parents Both parents native 800 100.0% NativeBoth parents foreign-born 121 100.0% NativeOne native, one foreign-born parent 200 100.0% NativeChildren under 6 years - Living with one parent Native parent 34 100.0% NativeChildren 6 to 17 years - Living with two parents Both parents native 1,910 100.0% Native0 0.0% Foreign-bornBoth parents foreign-born 732 92.6% Native58 7.4% Foreign-bornOne native, one foreign-born parent 598 100.0% NativeChildren 6 to 17 years - Living with one parent Native parent 324 98.0% Native7 2.0% Foreign-bornForeign-born parent 44 69.2% Native20 30.8% Foreign-born
Grandparents responsible for own grandchildren in Dix Hills
Grandparents (30 to 59 years) White / Caucasian 35 100.0% Not responsible for grandchildrenTwo or more races 20 100.0% Not responsible for grandchildrenWhite alone, not Hispanic / Latino 30 100.0% Not responsible for grandchildrenHispanic or Latino 20 100.0% Not responsible for grandchildrenGrandparents (60 years and over) White / Caucasian 55 34.6% Responsible for grandchildren103 65.4% Not responsible for grandchildrenTwo or more races 98 100.0% Not responsible for grandchildrenWhite alone, not Hispanic / Latino 66 37.0% Responsible for grandchildren113 63.0% Not responsible for grandchildrenHispanic or Latino 30 100.0% Not responsible for grandchildren