Races in Dixon, Illinois (IL) Detailed Stats
Ancestries, Foreign-born residents, place of birth
Settings
X


Recent posts about races in Dixon, Illinois on our local forum with over 2,400,000 registered users:
 | Tourist visit....3 or 4 nights? (51 replies) |
| Moving to Illinois...literally anywhere but Chicago or it’s suburbs (52 replies) |
| Even the suburban residents are fleeing Illinois.. (294 replies) |
| Chicken Joint near Sterling IL (6 replies) |
| Mayor Emmanuel not seeking re-election (145 replies) |
| School registration fees (55 replies) |
Latest news about races in Dixon, IL collected exclusively by city-data.com from local newspapers, TV, and radio stations
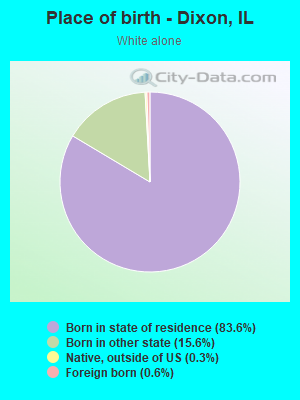
According to 2022 data, the most numerous races in Dixon, IL are White alone (11,901 residents), Hispanic (1,210 residents), and Black alone (1,506 residents). 94.8% of Dixon residents speak English at home. 3.1% of Dixon, IL residents are foreign-born (1.7% born in Latin America, 0.8% born in Asia, 0.5% born in Europe), which is 346.1% less than the foreign-born rate of 14.0% across the entire state of Illinois.
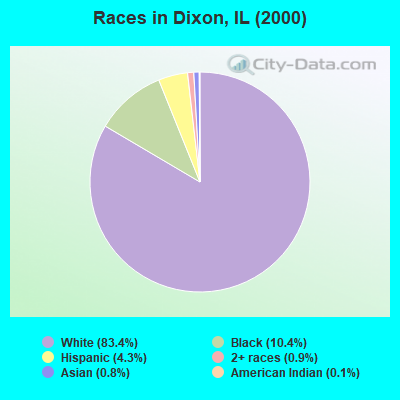
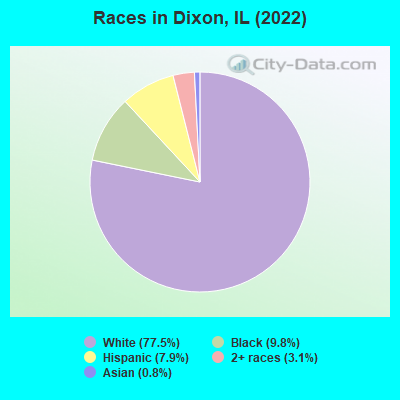
Race distribution in Dixon
2000
2022

- 13,29083.4%White alone
- 1,66010.4%Black alone
- 6854.3%Hispanic
- 1440.9%Two or more races
- 1300.8%Asian alone
- 180.1%American Indian alone
- 90.06%Other race alone
- 50.03%Native Hawaiian and Other
Pacific Islander alone
-
- 11,90177.5%White alone
- 1,5069.8%Black alone
- 1,2107.9%Hispanic
- 4793.1%Two or more races
- 1270.8%Asian alone
- 20.01%American Indian alone
2000
2022
-
- 8,424,14067.8%White alone
- 1,856,15214.9%Black alone
- 1,530,26212.3%Hispanic
- 419,9163.4%Asian alone
- 153,9961.2%Two or more races
- 13,4790.1%Other race alone
- 18,2320.1%American Indian alone
- 3,1160.03%Native Hawaiian and Other
Pacific Islander alone

-
- 7,356,30158.5%White alone
- 2,299,72618.3%Hispanic
- 1,660,42313.2%Black alone
- 747,2965.9%Asian alone
- 458,5993.6%Two or more races
- 45,3860.4%Other race alone
- 10,4050.08%American Indian alone
- 3,8960.03%Native Hawaiian and Other
Pacific Islander alone

Income and house value in Dixon
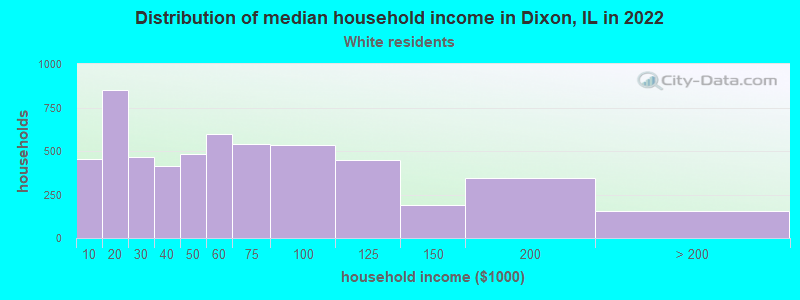
- Median household income in 2022
- $51,455White non-Hispanic householders
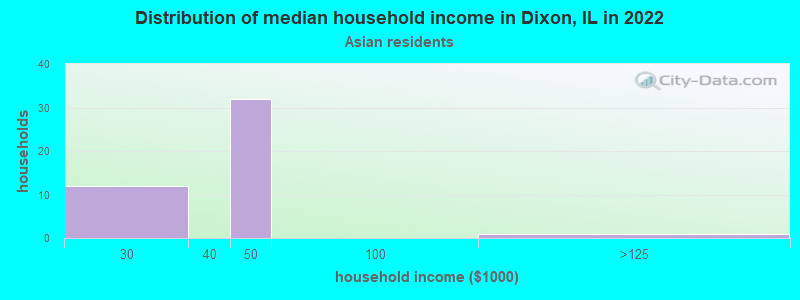
- $40,004Asian householders
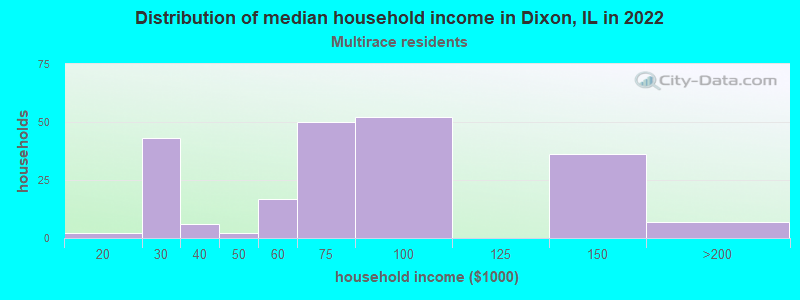
- $66,428Two or more races householders
- Median 2022 house value
- $117,847White Non-Hispanic householders
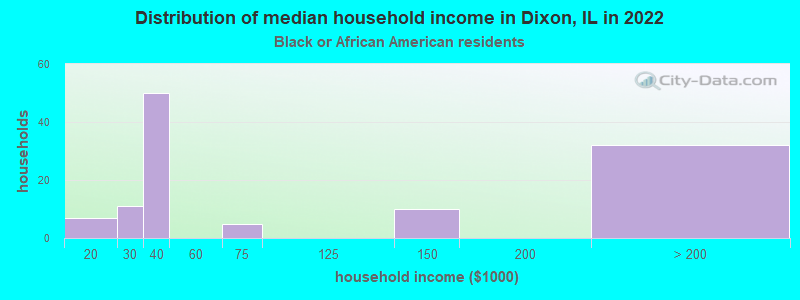
- $114,552Black or African American householders
- $112,983Asian householders
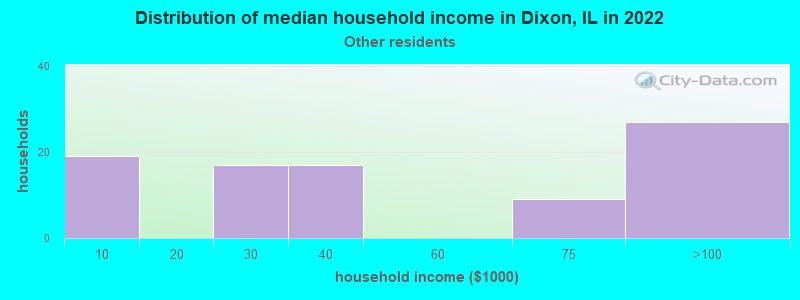
- $107,961Some other race householders
- $154,724Two or more races householders
- $111,100Hispanic or Latino householders
Household income for White non-Hispanic householders
Household income for Black householders
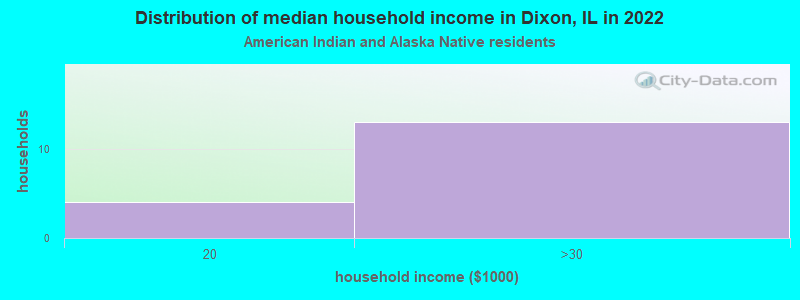
Household income for American Indian and Alaska Native householders
Household income for Asian householders
Household income for Some other race householders
Household income for Two or more races householders
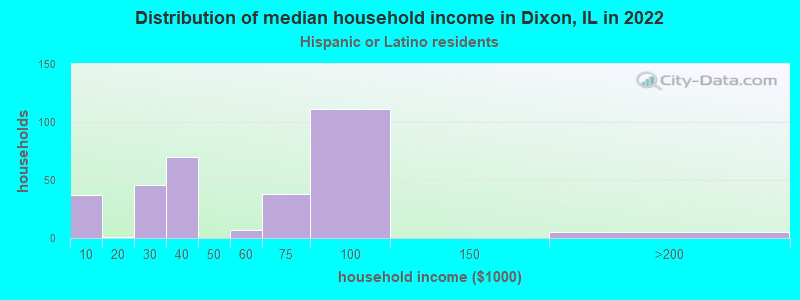
Household income for Hispanic or Latino race householders
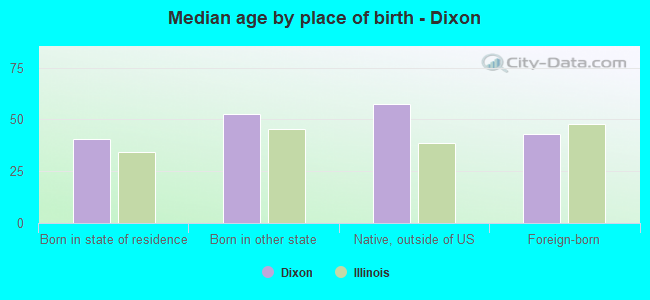
Median age by race in Dixon
- 43.8Median age for White residents
- 41.4Males
- 48.1Females
- 38.7Median age for Black or African American residents
- 38.7Males
- 38.1Females
- -696,696,696.0Median age for American Indian / Alaska Native residents
- -720,238,094.5Males
- -688,956,432.9Females
- 48.1Median age for Asian residents
- 47.4Males
- 55.9Females
- -593,236,714.4Median age for Native Hawaiian / Pacific Islander residents
- -658,536,584.7Males
- -576,015,108.0Females
- 43.1Median age for Other race residents
- 42.6Males
- 63.2Females
- 30.3Median age for Two or more races residents
- 32.7Males
- 19.7Females
- 44.8Median age for White alone residents
- 41.9Males
- 48.4Females
- 32.7Median age for Hispanic or Latino residents
- 30.9Males
- 34.3Females
Owner/renter occupied households by race in Dixon
- House owners and renters - White residents
- 3,36662.1%Owner occupied
- 2,05337.9%Renter occupied
- House owners and renters - Black or African American residents
- 7661.2%Owner occupied
- 4838.8%Renter occupied
- House owners and renters - American Indian / Alaska Native residents
- 1276.5%Owner occupied
- 423.5%Renter occupied
- House owners and renters - Asian residents
- 4297.8%Owner occupied
- 12.2%Renter occupied
- House owners and renters - Other race residents
- 5762.4%Owner occupied
- 3537.6%Renter occupied
- House owners and renters - Two or more races residents
- 8338.2%Owner occupied
- 13461.8%Renter occupied
- House owners and renters - White alone residents
- 3,34260.5%Owner occupied
- 2,17839.5%Renter occupied
- House owners and renters - Hispanic or Latino residents
- 22970.5%Owner occupied
- 9629.5%Renter occupied
Language usage in Dixon
- English speakers - Total
- 94.8% of residents of Dixon speak English at home.
- 2.9% of residents speak Spanish at home
- 24055.8%Speak English very well
- 19044.2%Speak English less than very well
- 1.8% of residents speak other language at home
- 15659.3%Speak English very well
- 10740.7%Speak English less than very well
- English speakers - Born in the United States
- 97.8% of residents of Dixon speak English at home.
- 1.8% of residents speak Spanish at home
- 2668.4%Speak English very well
- 1231.6%Speak English less than very well
- English speakers - Native, born elsewhere
- 60.3% of residents of Dixon speak English at home.
- 36.5% of residents speak Spanish at home
- 1356.5%Speak English very well
- 1043.5%Speak English less than very well
- English speakers - Foreign-born
- 20.5% of residents of Dixon speak English at home.
- 58.1% of residents speak Spanish at home
- 12645.0%Speak English very well
- 15455.0%Speak English less than very well
- 20.5% of residents speak other language at home
- 7979.8%Speak English very well
- 2020.2%Speak English less than very well
White (Caucasian) - Speak only English
| Native: | 100.0% (11,411) |
| Foreign-born: | 49.9% (45) |
White (Caucasian) - Speak another language
| Native: | 1.4% (164) |
| Foreign-born: | 54.0% (48) |
Black or African American - Speak only English
| Native: | 100.0% (1,506) |
| Foreign-born: | 100.0% (4) |
Asian - Speak only English
| Native: | 98.7% (8) |
| Foreign-born: | 23.9% (28) |
Two or more races - Speak only English
| Native: | 86.3% (700) |
| Foreign-born: | 12.0% (23) |
Two or more races - Speak another language
| Native: | 12.3% (100) |
| Foreign-born: | 87.7% (166) |
White alone - Speak only English
| Native: | 98.3% (11,159) |
| Foreign-born: | 74.5% (49) |
White alone - Speak another language
| Native: | 1.6% (184) |
| Foreign-born: | 20.1% (13) |
Hispanic or Latino - Speak only English
| Native: | 87.3% (734) |
| Foreign-born: | 5.3% (16) |
Hispanic or Latino - Speak another language
| Native: | 15.2% (128) |
| Foreign-born: | 94.7% (282) |
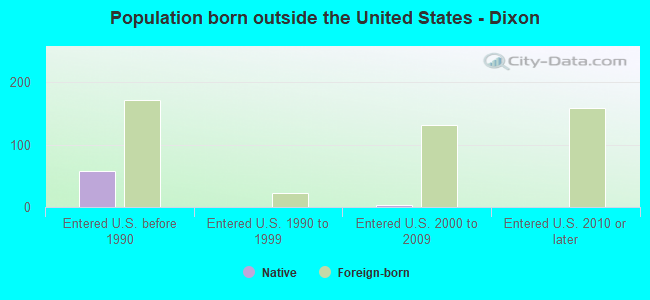
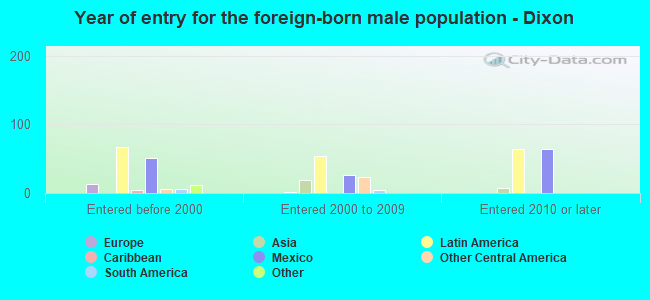
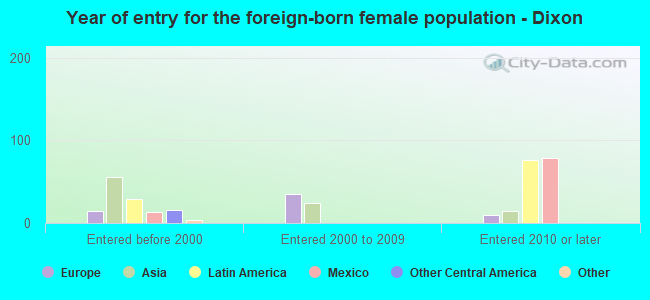
Foreign-born residents in Dixon
482 residents are foreign born (1.7% Latin America, 0.8% Asia, 0.5% Europe).
| This city: | 3.1% |
| Illinois: | 14.1% |
Marital status for residents in Dixon
Marital status - White (Caucasian) population 15 years and over
- Males
- 41.1%Never married
- 39.8%Now married
- 0.9%Separated
- 3.5%Widowed
- 14.7%Divorced
- Females
- 31.1%Never married
- 35.1%Now married
- 1.5%Separated
- 16.2%Widowed
- 16.2%Divorced
Women who gave birth in the past 12 months
| Now married: | 100.0% (81) |
| Unmarried: | 0.0% (0) |
Women who did not give birth in the past 12 months
| Now married: | 33.7% (751) |
| Unmarried: | 66.3% (1,481) |
Marital status - Black or African American population 15 years and over
- Males
- 76.2%Never married
- 11.6%Now married
- 2.3%Separated
- 1.8%Widowed
- 8.2%Divorced
- Females
- 15.3%Never married
- 44.1%Now married
- 0.8%Separated
- 28.0%Widowed
- 11.9%Divorced
Women who gave birth in the past 12 months
| Now married: | 100.0% (17) |
| Unmarried: | 0.0% (0) |
Women who did not give birth in the past 12 months
| Now married: | 73.2% (28) |
| Unmarried: | 26.8% (10) |
Marital status - American Indian / Alaska Native population 15 years and over
- Males
- 0.0%Never married
- 0.0%Now married
- 0.0%Separated
- 0.0%Widowed
- 100.0%Divorced
- Females
- 100.0%Never married
- 0.0%Now married
- 0.0%Separated
- 0.0%Widowed
- 0.0%Divorced
Marital status - Asian population 15 years and over
- Males
- 75.0%Never married
- 25.0%Now married
- 0.0%Separated
- 0.0%Widowed
- 0.0%Divorced
- Females
- 0.0%Never married
- 52.6%Now married
- 0.0%Separated
- 47.4%Widowed
- 0.0%Divorced
Women who did not give birth in the past 12 months
| Now married: | 100.0% (20) |
| Unmarried: | 0.0% (0) |
Marital status - Other race population 15 years and over
- Males
- 5.1%Never married
- 94.9%Now married
- 0.0%Separated
- 0.0%Widowed
- 0.0%Divorced
- Females
- 0.0%Never married
- 21.4%Now married
- 0.0%Separated
- 44.3%Widowed
- 34.3%Divorced
Marital status - Two or more races population 15 years and over
- Males
- 51.6%Never married
- 28.8%Now married
- 2.7%Separated
- 1.7%Widowed
- 15.1%Divorced
- Females
- 66.5%Never married
- 30.6%Now married
- 2.9%Separated
- 0.0%Widowed
- 0.0%Divorced
Women who did not give birth in the past 12 months
| Now married: | 32.2% (96) |
| Unmarried: | 67.8% (202) |
Marital status - White alone, not Hispanic / Latino population 15 years and over
- Males
- 40.1%Never married
- 39.9%Now married
- 1.0%Separated
- 3.7%Widowed
- 15.4%Divorced
- Females
- 29.8%Never married
- 35.5%Now married
- 1.6%Separated
- 16.7%Widowed
- 16.4%Divorced
Women who gave birth in the past 12 months
| Now married: | 100.0% (87) |
| Unmarried: | 0.0% (0) |
Women who did not give birth in the past 12 months
| Now married: | 34.2% (763) |
| Unmarried: | 65.8% (1,465) |
Marital status - Hispanic or Latino population 15 years and over
- Males
- 48.5%Never married
- 45.1%Now married
- 2.0%Separated
- 1.3%Widowed
- 3.2%Divorced
- Females
- 52.6%Never married
- 28.2%Now married
- 0.0%Separated
- 8.0%Widowed
- 11.1%Divorced
Women who did not give birth in the past 12 months
| Now married: | 32.2% (95) |
| Unmarried: | 67.8% (201) |
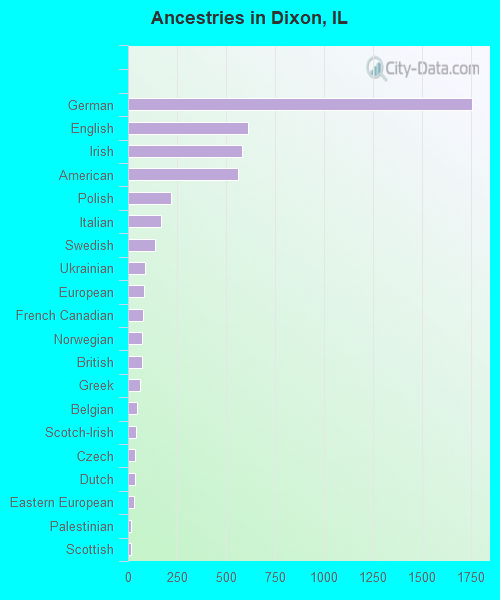
Ancestries in Dixon

- 1,75524.6%German
- 6138.6%English
- 5838.2%Irish
- 5607.9%American
- 2203.1%Polish
- 1672.3%Italian
- 1381.9%Swedish
- 861.2%Ukrainian
- 801.1%European
- 761.1%French Canadian
- 731.0%Norwegian
- 701.0%British
- 610.9%Greek
- 440.6%Belgian
- 390.5%Scotch-Irish
- 370.5%Czech
- 360.5%Dutch
- 310.4%Eastern European
- 170.2%Palestinian
- 170.2%Scottish
- 120.2%Pennsylvania German
- 100.1%Haitian
- 90.1%French
- 80.1%Lebanese
- 80.1%Welsh
- 80.1%Jamaican
- 70.10%Australian
- 50.07%Danish
- 40.06%Hungarian
- 30.04%Russian
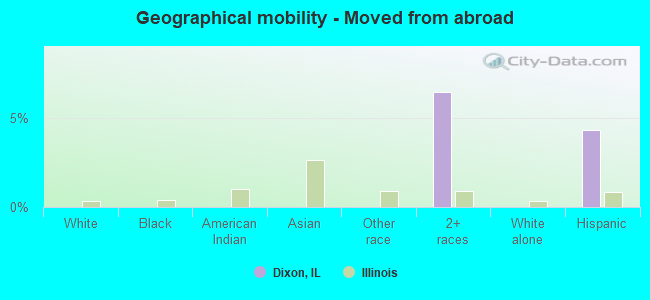
Geographical mobility in Dixon

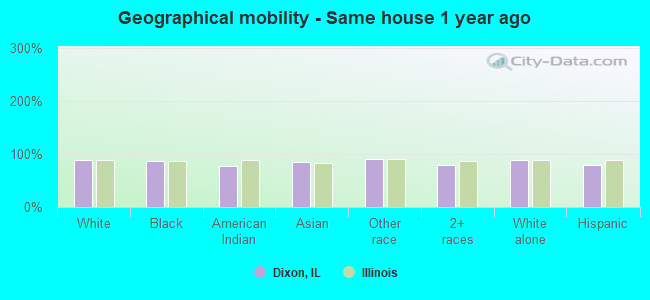
- Same house 1 year ago
- 10,30787.9%White (Caucasian)
- 1,31587.2%Black or African American
- 1177.5%American Indian / Alaska Native
- 10884.3%Asian
- 17990.4%Other race
- 92479.5%Two or more races
- 10,54288.9%White alone, not Hispanic / Latino
- 95078.8%Hispanic or Latino
-
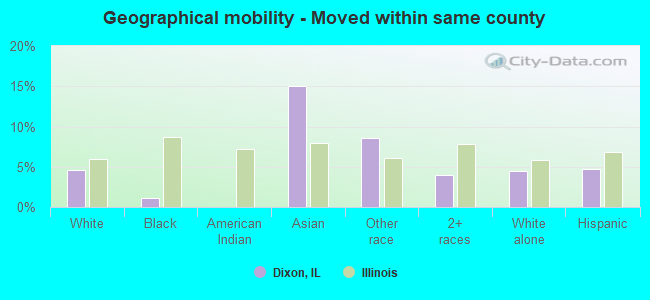
- Moved within same county
- 5384.6%White / Caucasian
- 161.1%Black or African American
- 1915.1%Asian
- 178.6%Other race
- 464.0%Two or more races
- 5324.5%White alone, not Hispanic / Latino
- 574.8%Hispanic or Latino
-
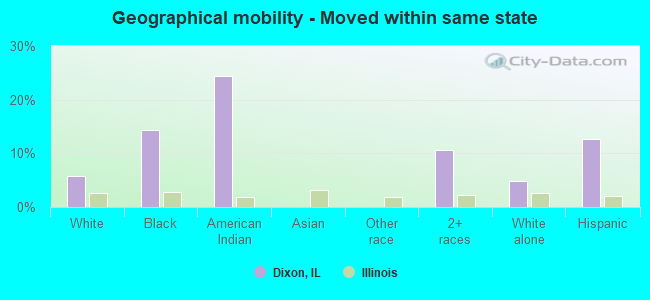
- Moved within same state
- 6695.7%White / Caucasian
- 21514.3%Black or African American
- 324.4%American Indian / Alaska Native
- 12410.7%Two or more races
- 5644.8%White alone, not Hispanic / Latino
- 15312.7%Hispanic or Latino
-
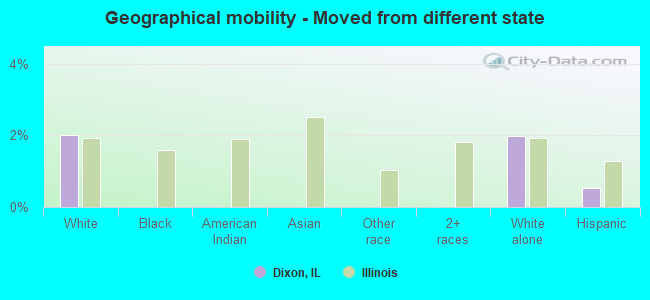
- Moved from different state
- 2352.0%White / Caucasian
- 2372.0%White alone, not Hispanic / Latino
- 60.5%Hispanic or Latino
-
- Moved from abroad
- 756.4%Two or more races
- 524.3%Hispanic or Latino
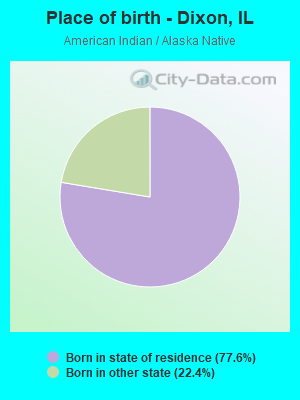
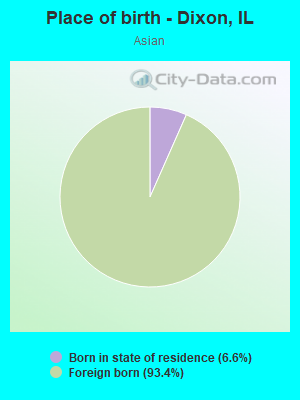
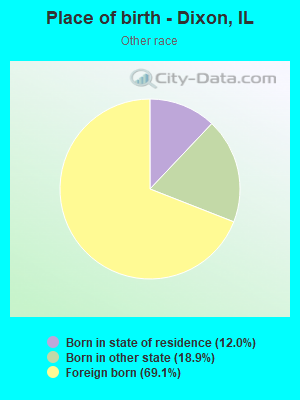
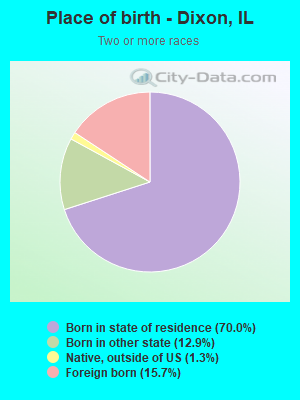
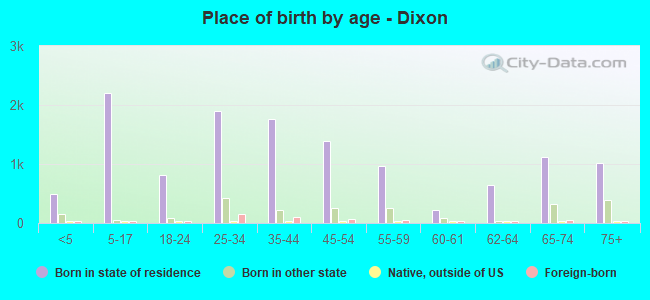
Children Nativity (place of birth) in Dixon
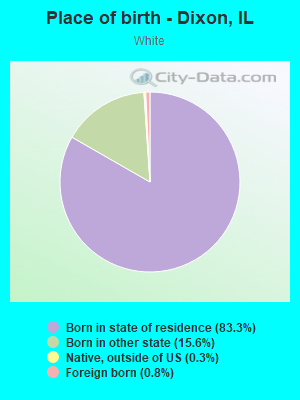
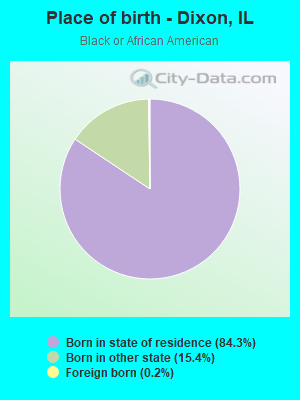
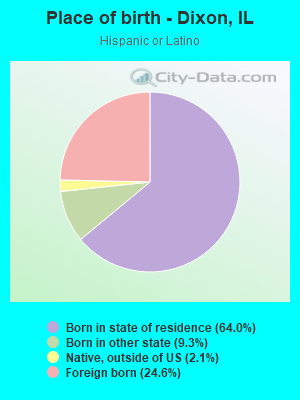
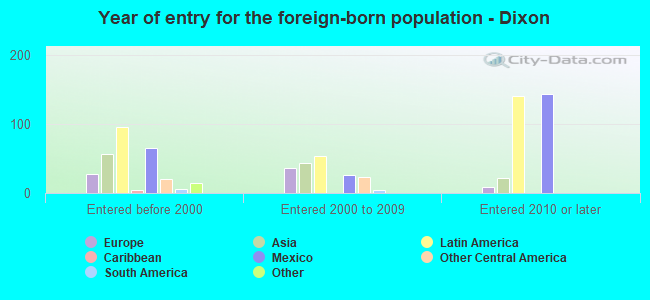
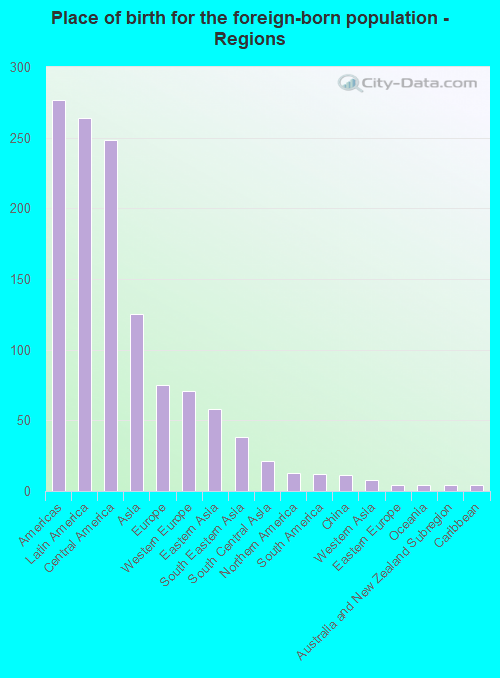
Place of birth for residents in Dixon
![Place of birth for the foreign-born population - Regions]()
- 277Americas
- 264Latin America
- 248Central America
- 125Asia
- 75Europe
- 71Western Europe
- 58Eastern Asia
- 38South Eastern Asia
- 21South Central Asia
- 13Northern America
- 12South America
- 11China
- 8Western Asia
- 4Eastern Europe
- 4Oceania
- 4Australia and New Zealand Subregion
- 4Caribbean
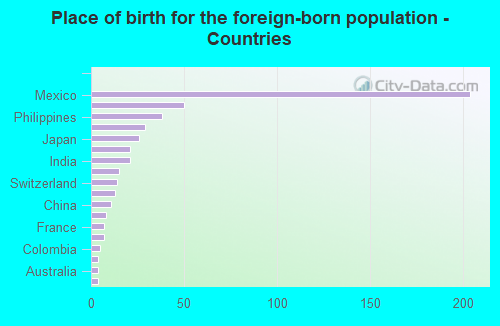
![Place of birth for the foreign-born population - Countries]()
- 204Mexico
- 50Germany
- 38Philippines
- 29El Salvador
- 26Japan
- 21Korea
- 21India
- 15Guatemala
- 14Switzerland
- 13Canada
- 11China
- 8Saudi Arabia
- 7France
- 7Argentina
- 5Colombia
- 4Ukraine
- 4Australia
- 4Jamaica
Grandparents responsible for own grandchildren in Dixon
Zip codes: 61021.