Races in Doctor Phillips, Florida (FL) Detailed Stats
Data:
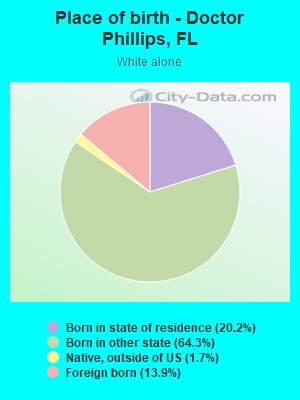
Races - White alone (%)
Races - White alone (% change since 2000)
Races - Black alone (%)
Races - Black alone (% change since 2000)
Races - American Indian alone (%)
Races - American Indian alone (% change since 2000)
Races - Asian alone (%)
Races - Asian alone (% change since 2000)
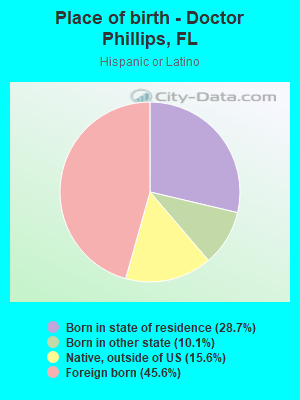
Races - Hispanic (%)
Races - Hispanic (% change since 2000)
Races - Native Hawaiian and Other Pacific Islander alone (%)
Races - Native Hawaiian and Other Pacific Islander alone (% change since 2000)
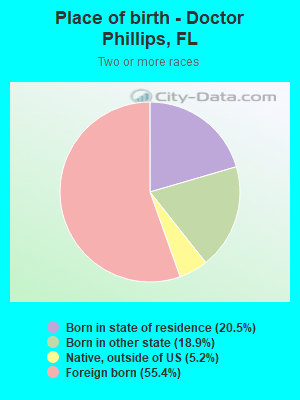
Races - Two or more races(%)
Races - Two or more races(% change since 2000)
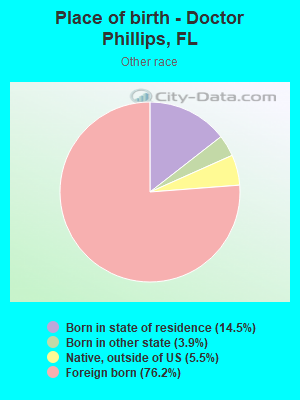
Races - Other race alone (%)
Races - Other race alone (% change since 2000)
Racial diversity
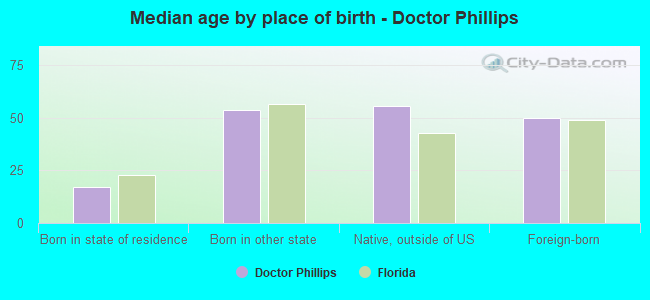
Place of birth - Born in state of residence (%)
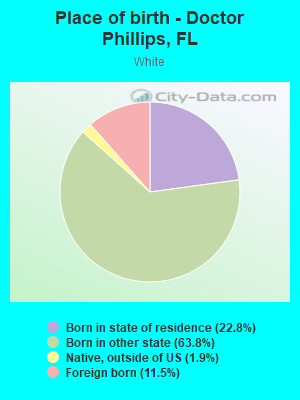
Place of birth - Born in state of residence (%) - White
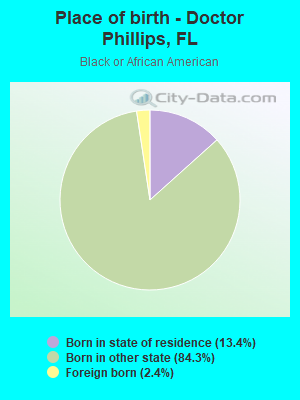
Place of birth - Born in state of residence (%) - Black or African American
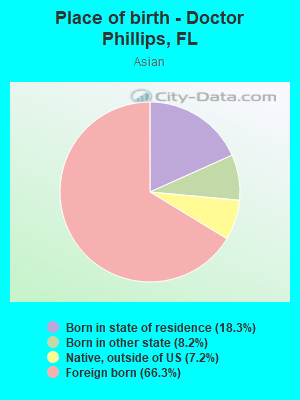
Place of birth - Born in state of residence (%) - Asian
Place of birth - Born in state of residence (%) - Hispanic or Latino
Place of birth - Born in state of residence (%) - American Indian and Alaska Native
Place of birth - Born in state of residence (%) - Multirace
Place of birth - Born in state of residence (%) - Other Race
Place of birth - Born in other state (%)
Place of birth - Born in other state (%) - White
Place of birth - Born in other state (%) - Black or African American
Place of birth - Born in other state (%) - Asian
Place of birth - Born in other state (%) - Hispanic or Latino
Place of birth - Born in other state (%) - American Indian and Alaska Native
Place of birth - Born in other state (%) - Multirace
Place of birth - Born in other state (%) - Other Race
Place of birth - Native, outside of US (%)
Place of birth - Native, outside of US (%) - White
Place of birth - Native, outside of US (%) - Black or African American
Place of birth - Native, outside of US (%) - Asian
Place of birth - Native, outside of US (%) - Hispanic or Latino
Place of birth - Native, outside of US (%) - American Indian and Alaska Native
Place of birth - Native, outside of US (%) - Multirace
Place of birth - Native, outside of US (%) - Other Race
Place of birth - Foreign born (%)
Place of birth - Foreign born (%) - White
Place of birth - Foreign born (%) - Black or African American
Place of birth - Foreign born (%) - Asian
Place of birth - Foreign born (%) - Hispanic or Latino
Place of birth - Foreign born (%) - American Indian and Alaska Native
Place of birth - Foreign born (%) - Multirace
Place of birth - Foreign born (%) - Other Race
Residents speaking English at home (%)
Residents speaking English at home - Born in the United States (%)
Residents speaking English at home - Native, born elsewhere (%)
Residents speaking English at home - Foreign born (%)
Residents speaking Spanish at home (%)
Residents speaking Spanish at home - Born in the United States (%)
Residents speaking Spanish at home - Native, born elsewhere (%)
Residents speaking Spanish at home - Foreign born (%)
Residents speaking other language at home (%)
Residents speaking other language at home - Born in the United States (%)
Residents speaking other language at home - Native, born elsewhere (%)
Residents speaking other language at home - Foreign born (%)
Marital status - Never married (%)
Marital status - Now married (%)
Marital status - Separated (%)
Marital status - Widowed (%)
Marital status - Divorced (%)
Ancestries Reported - Arab (%)
Ancestries Reported - Czech (%)
Ancestries Reported - Danish (%)
Ancestries Reported - Dutch (%)
Ancestries Reported - English (%)
Ancestries Reported - French (%)
Ancestries Reported - French Canadian (%)
Ancestries Reported - German (%)
Ancestries Reported - Greek (%)
Ancestries Reported - Hungarian (%)
Ancestries Reported - Irish (%)
Ancestries Reported - Italian (%)
Ancestries Reported - Lithuanian (%)
Ancestries Reported - Norwegian (%)
Ancestries Reported - Polish (%)
Ancestries Reported - Portuguese (%)
Ancestries Reported - Russian (%)
Ancestries Reported - Scotch-Irish (%)
Ancestries Reported - Scottish (%)
Ancestries Reported - Slovak (%)
Ancestries Reported - Subsaharan African (%)
Ancestries Reported - Swedish (%)
Ancestries Reported - Swiss (%)
Ancestries Reported - Ukrainian (%)
Ancestries Reported - United States (%)
Ancestries Reported - Welsh (%)
Ancestries Reported - West Indian (%)
Ancestries Reported - Other (%)
Geographical mobility - Same house 1 year ago (%)
Geographical mobility - Same house 1 year ago (%) - White
Geographical mobility - Same house 1 year ago (%) - Black or African American
Geographical mobility - Same house 1 year ago (%) - Asian
Geographical mobility - Same house 1 year ago (%) - Hispanic or Latino
Geographical mobility - Same house 1 year ago (%) - American Indian and Alaska Native
Geographical mobility - Same house 1 year ago (%) - Multirace
Geographical mobility - Same house 1 year ago (%) - Other Race
Geographical mobility - Moved within same county (%)
Geographical mobility - Moved within same county (%) - White
Geographical mobility - Moved within same county (%) - Black or African American
Geographical mobility - Moved within same county (%) - Asian
Geographical mobility - Moved within same county (%) - Hispanic or Latino
Geographical mobility - Moved within same county (%) - American Indian and Alaska Native
Geographical mobility - Moved within same county (%) - Multirace
Geographical mobility - Moved within same county (%) - Other Race
Geographical mobility - Moved from different county within same state (%)
Geographical mobility - Moved from different county within same state (%) - White
Geographical mobility - Moved from different county within same state (%) - Black or African American
Geographical mobility - Moved from different county within same state (%) - Asian
Geographical mobility - Moved from different county within same state (%) - Hispanic or Latino
Geographical mobility - Moved from different county within same state (%) - American Indian and Alaska Native
Geographical mobility - Moved from different county within same state (%) - Multirace
Geographical mobility - Moved from different county within same state (%) - Other Race
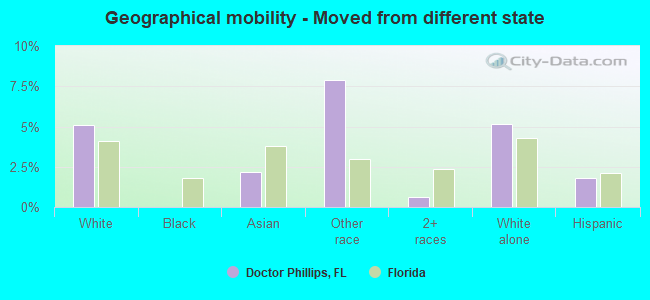
Geographical mobility - Moved from different state (%)
Geographical mobility - Moved from different state (%) - White
Geographical mobility - Moved from different state (%) - Black or African American
Geographical mobility - Moved from different state (%) - Asian
Geographical mobility - Moved from different state (%) - Hispanic or Latino
Geographical mobility - Moved from different state (%) - American Indian and Alaska Native
Geographical mobility - Moved from different state (%) - Multirace
Geographical mobility - Moved from different state (%) - Other Race
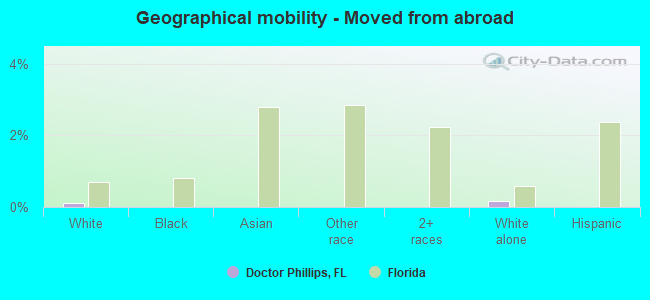
Geographical mobility - Moved from abroad (%)
Geographical mobility - Moved from abroad (%) - White
Geographical mobility - Moved from abroad (%) - Black or African American
Geographical mobility - Moved from abroad (%) - Asian
Geographical mobility - Moved from abroad (%) - Hispanic or Latino
Geographical mobility - Moved from abroad (%) - American Indian and Alaska Native
Geographical mobility - Moved from abroad (%) - Multirace
Geographical mobility - Moved from abroad (%) - Other Race
Place of birth for the foreign-born population - Ireland (%)
Place of birth for the foreign-born population - Denmark (%)
Place of birth for the foreign-born population - Norway (%)
Place of birth for the foreign-born population - Sweden (%)
Place of birth for the foreign-born population - United Kingdom (%)
Place of birth for the foreign-born population - England (%)
Place of birth for the foreign-born population - Scotland (%)
Place of birth for the foreign-born population - Other Northern Europe (%)
Place of birth for the foreign-born population - Austria (%)
Place of birth for the foreign-born population - Belgium (%)
Place of birth for the foreign-born population - France (%)
Place of birth for the foreign-born population - Germany (%)
Place of birth for the foreign-born population - Netherlands (%)
Place of birth for the foreign-born population - Switzerland (%)
Place of birth for the foreign-born population - Other Western Europe (%)
Place of birth for the foreign-born population - Greece (%)
Place of birth for the foreign-born population - Italy (%)
Place of birth for the foreign-born population - Portugal (%)
Place of birth for the foreign-born population - Spain (%)
Place of birth for the foreign-born population - Other Southern Europe (%)
Place of birth for the foreign-born population - Albania (%)
Place of birth for the foreign-born population - Belarus (%)
Place of birth for the foreign-born population - Bosnia and Herzegovina (%)
Place of birth for the foreign-born population - Bulgaria (%)
Place of birth for the foreign-born population - Croatia (%)
Place of birth for the foreign-born population - Czechoslovakia (%)
Place of birth for the foreign-born population - Hungary (%)
Place of birth for the foreign-born population - Latvia (%)
Place of birth for the foreign-born population - Lithuania (%)
Place of birth for the foreign-born population - North Macedonia (Macedonia) (%)
Place of birth for the foreign-born population - Moldova (%)
Place of birth for the foreign-born population - Poland (%)
Place of birth for the foreign-born population - Romania (%)
Place of birth for the foreign-born population - Russia (%)
Place of birth for the foreign-born population - Serbia (%)
Place of birth for the foreign-born population - Ukraine (%)
Place of birth for the foreign-born population - Other Eastern Europe (%)
Place of birth for the foreign-born population - China (%)
Place of birth for the foreign-born population - Hong Kong (%)
Place of birth for the foreign-born population - Taiwan (%)
Place of birth for the foreign-born population - Japan (%)
Place of birth for the foreign-born population - Korea (%)
Place of birth for the foreign-born population - Other Eastern Asia (%)
Place of birth for the foreign-born population - Afghanistan (%)
Place of birth for the foreign-born population - Bangladesh (%)
Place of birth for the foreign-born population - India (%)
Place of birth for the foreign-born population - Iran (%)
Place of birth for the foreign-born population - Kazakhstan (%)
Place of birth for the foreign-born population - Nepal (%)
Place of birth for the foreign-born population - Pakistan (%)
Place of birth for the foreign-born population - Sri Lanka (%)
Place of birth for the foreign-born population - Uzbekistan (%)
Place of birth for the foreign-born population - Other South Central Asia (%)
Place of birth for the foreign-born population - Burma (%)
Place of birth for the foreign-born population - Cambodia (%)
Place of birth for the foreign-born population - Indonesia (%)
Place of birth for the foreign-born population - Laos (%)
Place of birth for the foreign-born population - Malaysia (%)
Place of birth for the foreign-born population - Philippines (%)
Place of birth for the foreign-born population - Singapore (%)
Place of birth for the foreign-born population - Thailand (%)
Place of birth for the foreign-born population - Vietnam (%)
Place of birth for the foreign-born population - Other South Eastern Asia (%)
Place of birth for the foreign-born population - Armenia (%)
Place of birth for the foreign-born population - Iraq (%)
Place of birth for the foreign-born population - Israel (%)
Place of birth for the foreign-born population - Jordan (%)
Place of birth for the foreign-born population - Kuwait (%)
Place of birth for the foreign-born population - Lebanon (%)
Place of birth for the foreign-born population - Saudi Arabia (%)
Place of birth for the foreign-born population - Syria (%)
Place of birth for the foreign-born population - Turkey (%)
Place of birth for the foreign-born population - Yemen (%)
Place of birth for the foreign-born population - Other Western Asia (%)
Place of birth for the foreign-born population - Eritrea (%)
Place of birth for the foreign-born population - Ethiopia (%)
Place of birth for the foreign-born population - Kenya (%)
Place of birth for the foreign-born population - Somalia (%)
Place of birth for the foreign-born population - Uganda (%)
Place of birth for the foreign-born population - Zimbabwe (%)
Place of birth for the foreign-born population - Other Eastern Africa (%)
Place of birth for the foreign-born population - Cameroon (%)
Place of birth for the foreign-born population - Congo (%)
Place of birth for the foreign-born population - Democratic Republic of Congo (Zaire) (%)
Place of birth for the foreign-born population - Other Middle Africa (%)
Place of birth for the foreign-born population - Egypt (%)
Place of birth for the foreign-born population - Morocco (%)
Place of birth for the foreign-born population - Sudan (%)
Place of birth for the foreign-born population - Other Northern Africa (%)
Place of birth for the foreign-born population - South Africa (%)
Place of birth for the foreign-born population - Other Southern Africa (%)
Place of birth for the foreign-born population - Cabo Verde (%)
Place of birth for the foreign-born population - Ghana (%)
Place of birth for the foreign-born population - Liberia (%)
Place of birth for the foreign-born population - Nigeria (%)
Place of birth for the foreign-born population - Senegal (%)
Place of birth for the foreign-born population - Sierra Leone (%)
Place of birth for the foreign-born population - Other Western Africa (%)
Place of birth for the foreign-born population - Australia (%)
Place of birth for the foreign-born population - New Zealand (%)
Place of birth for the foreign-born population - Fiji (%)
Place of birth for the foreign-born population - Micronesia (%)
Place of birth for the foreign-born population - Bahamas (%)
Place of birth for the foreign-born population - Barbados (%)
Place of birth for the foreign-born population - Cuba (%)
Place of birth for the foreign-born population - Dominica (%)
Place of birth for the foreign-born population - Dominican Republic (%)
Place of birth for the foreign-born population - Grenada (%)
Place of birth for the foreign-born population - Haiti (%)
Place of birth for the foreign-born population - Jamaica (%)
Place of birth for the foreign-born population - St. Vincent and the Grenadines (%)
Place of birth for the foreign-born population - Trinidad and Tobago (%)
Place of birth for the foreign-born population - West Indies (%)
Place of birth for the foreign-born population - Other Caribbean (%)
Place of birth for the foreign-born population - Belize (%)
Place of birth for the foreign-born population - Costa Rica (%)
Place of birth for the foreign-born population - El Salvador (%)
Place of birth for the foreign-born population - Guatemala (%)
Place of birth for the foreign-born population - Honduras (%)
Place of birth for the foreign-born population - Mexico (%)
Place of birth for the foreign-born population - Nicaragua (%)
Place of birth for the foreign-born population - Panama (%)
Place of birth for the foreign-born population - Other Central America (%)
Place of birth for the foreign-born population - Argentina (%)
Place of birth for the foreign-born population - Bolivia (%)
Place of birth for the foreign-born population - Brazil (%)
Place of birth for the foreign-born population - Chile (%)
Place of birth for the foreign-born population - Colombia (%)
Place of birth for the foreign-born population - Ecuador (%)
Place of birth for the foreign-born population - Guyana (%)
Place of birth for the foreign-born population - Peru (%)
Place of birth for the foreign-born population - Uruguay (%)
Place of birth for the foreign-born population - Venezuela (%)
Place of birth for the foreign-born population - Other South America (%)
Place of birth for the foreign-born population - Canada (%)
Place of birth for the foreign-born population - Other Northern America (%)
Place of birth for the foreign-born population - Other (%)
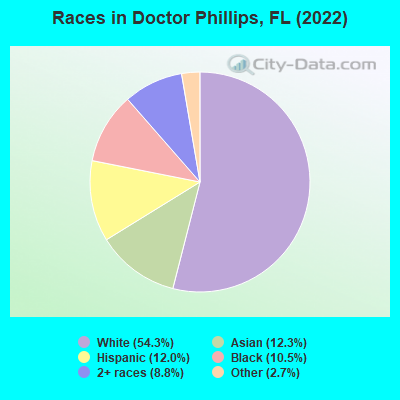
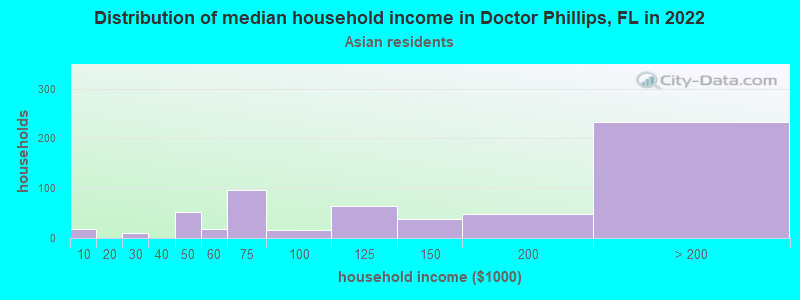
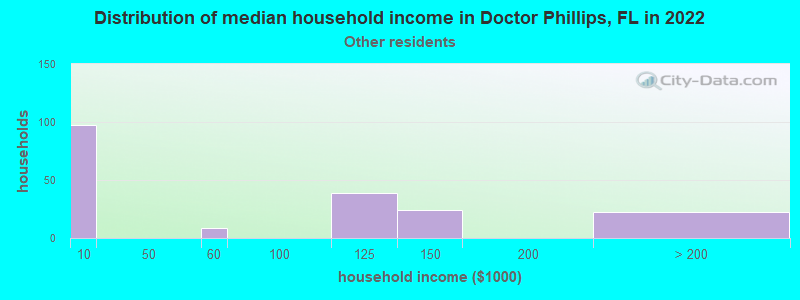
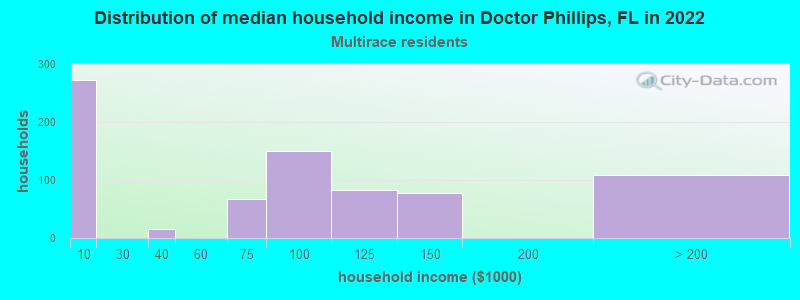
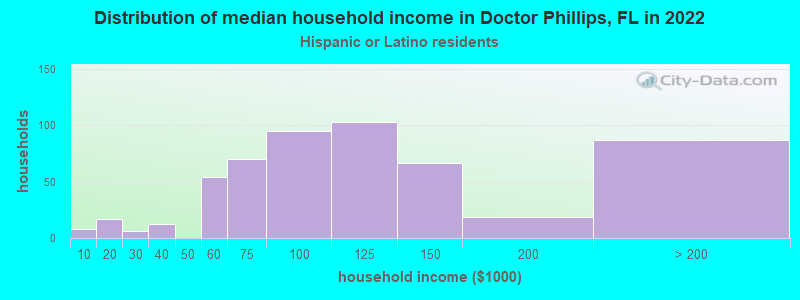
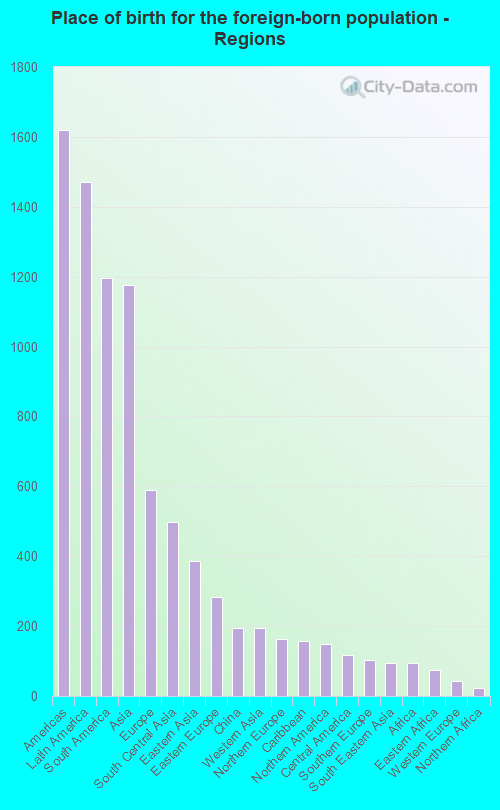
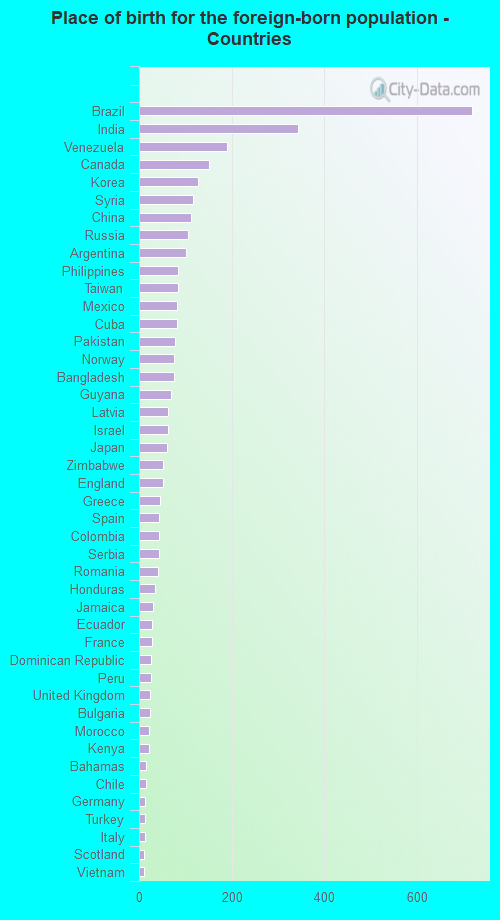
According to 2022 data, the most numerous races in Doctor Phillips, FL are White alone (6,791 residents), Hispanic (1,500 residents), and Black alone (1,307 residents). 66.6% of Doctor Phillips residents speak English at home. 27.9% of Doctor Phillips, FL residents are foreign-born (11.4% born in Latin America, 9.1% born in Asia, 4.6% born in Europe), which is 24.6% greater than the foreign-born rate of 21.0% across the entire state of Florida.
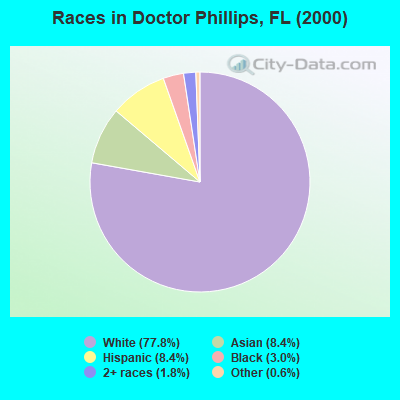
Race distribution in Doctor Phillips
2000 2022
10,458,509 65.4% White alone 2,682,715 16.8% Hispanic 2,264,268 14.2% Black alone 261,693 1.6% Asian alone 236,954 1.5% Two or more races 42,358 0.3% American Indian alone 28,994 0.2% Other race alone 6,887 0.04% Native Hawaiian and Other
11,309,403 50.8% White alone 6,025,039 27.1% Hispanic 3,241,015 14.6% Black alone 861,630 3.9% Two or more races 623,692 2.8% Asian alone 152,054 0.7% Other race alone 22,504 0.1% American Indian alone 9,486 0.04% Native Hawaiian and Other
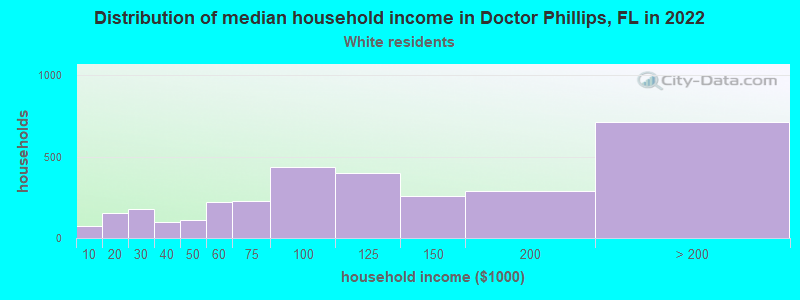
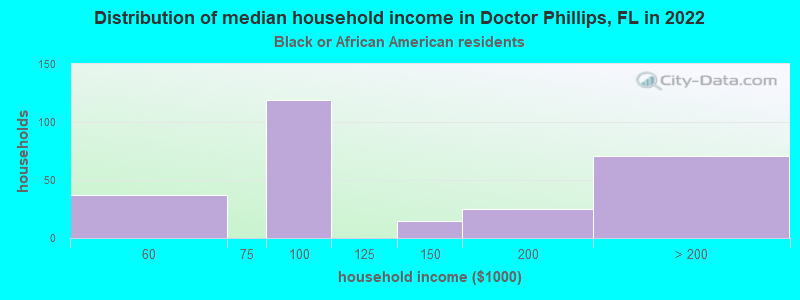
Income and house value in Doctor Phillips Median household income in 2022 $96,899 White non-Hispanic householders$89,461 Black householders$115,770 Asian householders$84,579 Two or more races householders$104,156 Hispanic or Latino race householdersMedian 2022 house value $528,429 White Non-Hispanic householders$511,109 Black or African American householders $633,028 Asian householders$573,257 Some other race householders$481,903 Two or more races householders$500,242 Hispanic or Latino householders
Median age by race in Doctor Phillips
52.7 Median age for White residents53.5 52.1 30.0 Median age for Black or African American residents41.3 30.1 -614,300,100.1 Median age for American Indian / Alaska Native residents-735,632,183.2 -529,680,364.8 39.3 Median age for Asian residents37.5 40.2 -679,790,025.6 Median age for Native Hawaiian / Pacific Islander residents-1,327,635,326.3 -611,111,110.5 40.1 Median age for Other race residents40.6 41.3 36.8 Median age for Two or more races residents30.4 38.1 52.4 Median age for White alone residents52.0 53.4 41.3 Median age for Hispanic or Latino residents37.6 42.1
Owner/renter occupied households by race in Doctor Phillips
House owners and renters - White residents 2,383 75.7% Owner occupied764 24.3% Renter occupiedHouse owners and renters - Black or African American residents 139 51.2% Owner occupied132 48.8% Renter occupiedHouse owners and renters - Asian residents 437 71.8% Owner occupied172 28.2% Renter occupiedHouse owners and renters - Other race residents 124 67.1% Owner occupied61 32.9% Renter occupiedHouse owners and renters - Two or more races residents 574 74.8% Owner occupied193 25.2% Renter occupiedHouse owners and renters - White alone residents 2,474 75.3% Owner occupied811 24.7% Renter occupiedHouse owners and renters - Hispanic or Latino residents 345 64.7% Owner occupied189 35.3% Renter occupied
Language usage in Doctor Phillips
English speakers - Total 66.6% of residents of Doctor Phillips speak English at home.
9.6% of residents speak Spanish at home 896 77.3% Speak English very well263 22.7% Speak English less than very well25.0% of residents speak other language at home 2,409 79.7% Speak English very well615 20.3% Speak English less than very well
English speakers - Born in the United States 89.4% of residents of Doctor Phillips speak English at home.
2.5% of residents speak Spanish at home 142 91.6% Speak English very well13 8.4% Speak English less than very well7.4% of residents speak other language at home 452 100.0% Speak English very well
English speakers - Native, born elsewhere 47.4% of residents of Doctor Phillips speak English at home.
56.4% of residents speak Spanish at home 207 89.2% Speak English very well25 10.8% Speak English less than very well
English speakers - Foreign-born 16.9% of residents of Doctor Phillips speak English at home.
20.0% of residents speak Spanish at home 468 66.2% Speak English very well239 33.8% Speak English less than very well62.8% of residents speak other language at home 1,604 72.2% Speak English very well619 27.8% Speak English less than very well
White (Caucasian) - Speak only English Native:
100.0% (5,430)Foreign-born:
39.2% (299)
White (Caucasian) - Speak another language Native:
4.9% (266)Foreign-born:
64.8% (494)
Black or African American - Speak only English Native:
83.8% (1,039)Foreign-born:
100.0% (31)
Asian - Speak only English Native:
49.2% (180)Foreign-born:
9.4% (98)
Asian - Speak another language Native:
48.6% (178)Foreign-born:
88.8% (923)
Other race - Speak only English Native:
50.7% (67)Foreign-born:
3.1% (13)
Other race - Speak another language Native:
51.9% (69)Foreign-born:
98.7% (423)
Two or more races - Speak only English Native:
62.8% (517)Foreign-born:
1.0% (11)
Two or more races - Speak another language Native:
36.2% (297)Foreign-born:
99.2% (1,090)
White alone - Speak only English Native:
95.6% (5,447)Foreign-born:
36.2% (347)
White alone - Speak another language Native:
4.3% (247)Foreign-born:
60.2% (577)
Hispanic or Latino - Speak only English Native:
45.3% (318)Foreign-born:
1.1% (7)
Hispanic or Latino - Speak another language Native:
56.5% (397)Foreign-born:
99.5% (689)
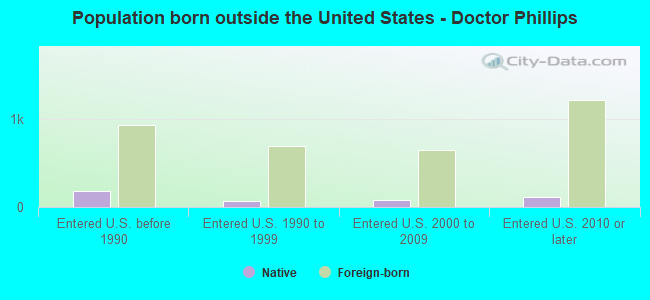
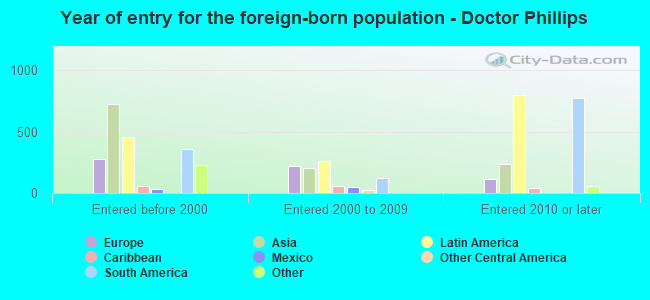
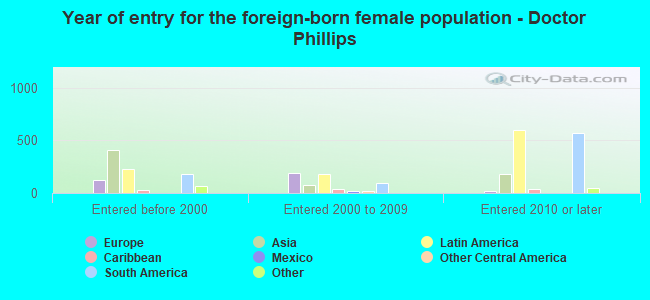
Foreign-born residents in Doctor Phillips 3,482 residents are foreign born (11.4% Latin America , 9.1% Asia , 4.6% Europe ).
This city:
27.9%Florida:
21.1%
Marital status for residents in Doctor Phillips Marital status - White (Caucasian) population 15 years and over
Males 31.2% Never married53.3% Now married1.2% Separated3.1% Widowed11.2% DivorcedFemales 20.1% Never married51.7% Now married0.7% Separated12.0% Widowed15.4% DivorcedWomen who gave birth in the past 12 months Now married:
100.0% (27)Unmarried:
0.0% (0)
Women who did not give birth in the past 12 months Now married:
39.8% (466)Unmarried:
60.2% (706)
Marital status - Black or African American population 15 years and over
Males 40.9% Never married59.1% Now married0.0% Separated0.0% Widowed0.0% DivorcedFemales 40.4% Never married59.6% Now married0.0% Separated0.0% Widowed0.0% DivorcedWomen who did not give birth in the past 12 months Now married:
44.1% (240)Unmarried:
55.9% (304)
Marital status - Asian population 15 years and over
Males 30.1% Never married64.0% Now married0.0% Separated0.0% Widowed5.9% DivorcedFemales 19.4% Never married70.6% Now married0.0% Separated3.5% Widowed6.4% DivorcedWomen who gave birth in the past 12 months Now married:
100.0% (48)Unmarried:
0.0% (0)
Women who did not give birth in the past 12 months Now married:
47.3% (115)Unmarried:
52.7% (128)
Marital status - Other race population 15 years and over
Males 43.7% Never married42.1% Now married0.0% Separated0.0% Widowed14.3% DivorcedFemales 32.7% Never married48.2% Now married0.0% Separated5.9% Widowed13.2% DivorcedWomen who gave birth in the past 12 months Now married:
100.0% (10)Unmarried:
0.0% (0)
Women who did not give birth in the past 12 months Now married:
45.6% (99)Unmarried:
54.4% (119)
Marital status - Two or more races population 15 years and over
Males 26.7% Never married70.5% Now married0.0% Separated0.0% Widowed2.8% DivorcedFemales 38.5% Never married53.8% Now married0.0% Separated0.9% Widowed6.7% DivorcedWomen who gave birth in the past 12 months Now married:
100.0% (39)Unmarried:
0.0% (0)
Women who did not give birth in the past 12 months Now married:
41.7% (258)Unmarried:
58.3% (361)
Marital status - White alone, not Hispanic / Latino population 15 years and over
Males 29.7% Never married54.5% Now married1.4% Separated3.4% Widowed11.0% DivorcedFemales 21.9% Never married49.7% Now married0.8% Separated11.6% Widowed15.9% DivorcedWomen who gave birth in the past 12 months Now married:
100.0% (32)Unmarried:
0.0% (0)
Women who did not give birth in the past 12 months Now married:
32.4% (398)Unmarried:
67.6% (828)
Marital status - Hispanic or Latino population 15 years and over
Males 40.0% Never married49.6% Now married0.0% Separated0.0% Widowed10.4% DivorcedFemales 8.1% Never married65.6% Now married0.0% Separated10.2% Widowed16.1% DivorcedWomen who gave birth in the past 12 months Now married:
100.0% (34)Unmarried:
0.0% (0)
Women who did not give birth in the past 12 months Now married:
84.4% (241)Unmarried:
15.6% (45)
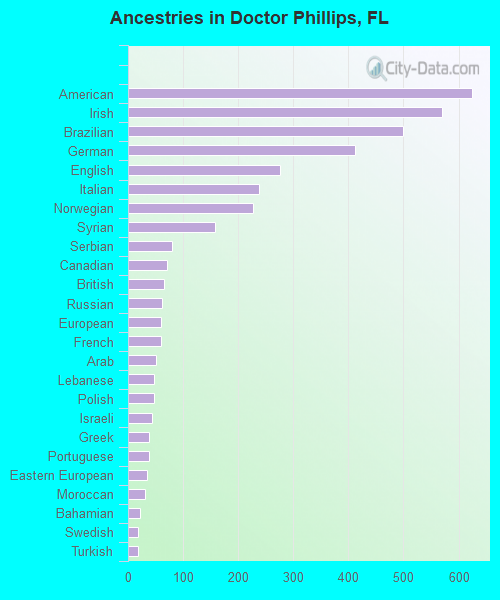
Ancestries in Doctor Phillips
624 9.8% American570 8.9% Irish499 7.8% Brazilian412 6.5% German276 4.3% English237 3.7% Italian226 3.5% Norwegian158 2.5% Syrian80 1.3% Serbian70 1.1% Canadian65 1.0% British62 1.0% Russian59 0.9% European59 0.9% French50 0.8% Arab48 0.8% Lebanese47 0.7% Polish43 0.7% Israeli39 0.6% Greek39 0.6% Portuguese34 0.5% Eastern European30 0.5% Moroccan22 0.3% Bahamian18 0.3% Swedish18 0.3% Turkish17 0.3% Austrian17 0.3% Bulgarian12 0.2% Romanian12 0.2% Scotch-Irish10 0.2% Welsh9 0.1% Ukrainian8 0.1% Scottish8 0.1% Northern European5 0.08% Dutch5 0.08% Albanian4 0.06% Czech
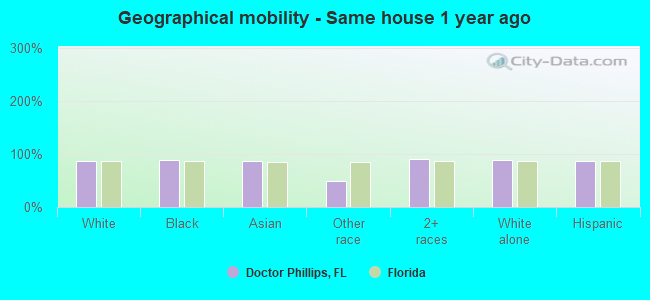
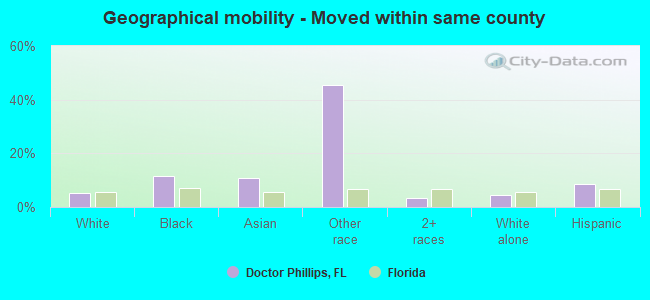
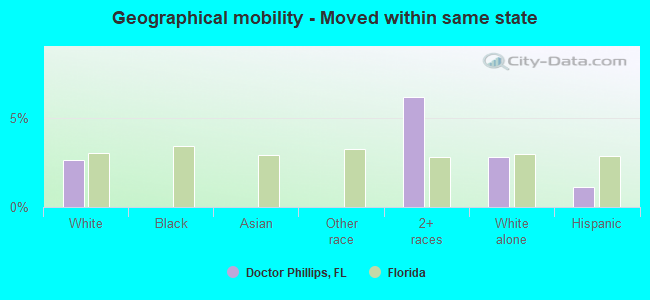
Geographical mobility in Doctor Phillips Same house 1 year ago 5,626 87.6% White (Caucasian)1,144 88.2% Black or African American1,342 86.9% Asian279 49.7% Other race1,750 90.8% Two or more races5,953 88.1% White alone, not Hispanic / Latino1,301 87.6% Hispanic or LatinoMoved within same county 335 5.2% White / Caucasian152 11.7% Black or African American169 10.9% Asian255 45.5% Other race62 3.2% Two or more races296 4.4% White alone, not Hispanic / Latino130 8.7% Hispanic or LatinoMoved within same state 169 2.6% White / Caucasian118 6.1% Two or more races189 2.8% White alone, not Hispanic / Latino17 1.1% Hispanic or LatinoMoved from different state 329 5.1% White / Caucasian34 2.2% Asian44 7.9% Other race12 0.6% Two or more races350 5.2% White alone, not Hispanic / Latino27 1.8% Hispanic or LatinoMoved from abroad 7 0.1% White10 0.2% White alone, not Hispanic / Latino
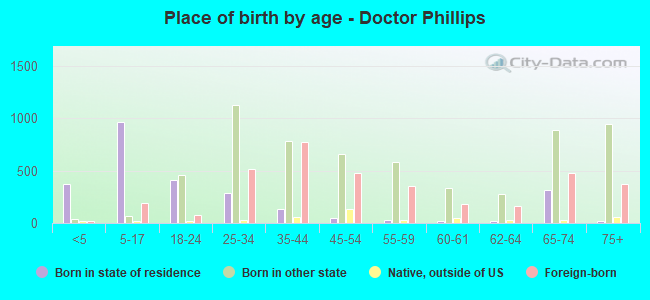
Children Nativity (place of birth) in Doctor Phillips
Children under 6 years - Living with two parents Both parents native 161 100.0% NativeBoth parents foreign-born 31 100.0% NativeOne native, one foreign-born parent 226 100.0% NativeChildren under 6 years - Living with one parent Native parent 27 100.0% NativeChildren 6 to 17 years - Living with two parents Both parents native 336 100.0% NativeBoth parents foreign-born 194 52.3% Native177 47.7% Foreign-bornOne native, one foreign-born parent 157 87.0% Native23 13.0% Foreign-bornChildren 6 to 17 years - Living with one parent Native parent 182 100.0% NativeForeign-born parent 96 49.1% Native99 50.9% Foreign-born
Grandparents responsible for own grandchildren in Doctor Phillips
Grandparents (30 to 59 years) White / Caucasian 19 100.0% Not responsible for grandchildrenWhite alone, not Hispanic / Latino 27 100.0% Not responsible for grandchildren
Grandparents (60 years and over) White / Caucasian 23 100.0% Not responsible for grandchildrenWhite alone, not Hispanic / Latino 9 100.0% Not responsible for grandchildren