Races in Doraville, Georgia (GA) Detailed Stats
Data:
Races - White alone (%)
Races - White alone (% change since 2000)
Races - Black alone (%)
Races - Black alone (% change since 2000)
Races - American Indian alone (%)
Races - American Indian alone (% change since 2000)
Races - Asian alone (%)
Races - Asian alone (% change since 2000)
Races - Hispanic (%)
Races - Hispanic (% change since 2000)
Races - Native Hawaiian and Other Pacific Islander alone (%)
Races - Native Hawaiian and Other Pacific Islander alone (% change since 2000)
Races - Two or more races(%)
Races - Two or more races(% change since 2000)
Races - Other race alone (%)
Races - Other race alone (% change since 2000)
Racial diversity
Place of birth - Born in state of residence (%)
Place of birth - Born in state of residence (%) - White
Place of birth - Born in state of residence (%) - Black or African American
Place of birth - Born in state of residence (%) - Asian
Place of birth - Born in state of residence (%) - Hispanic or Latino
Place of birth - Born in state of residence (%) - American Indian and Alaska Native
Place of birth - Born in state of residence (%) - Multirace
Place of birth - Born in state of residence (%) - Other Race
Place of birth - Born in other state (%)
Place of birth - Born in other state (%) - White
Place of birth - Born in other state (%) - Black or African American
Place of birth - Born in other state (%) - Asian
Place of birth - Born in other state (%) - Hispanic or Latino
Place of birth - Born in other state (%) - American Indian and Alaska Native
Place of birth - Born in other state (%) - Multirace
Place of birth - Born in other state (%) - Other Race
Place of birth - Native, outside of US (%)
Place of birth - Native, outside of US (%) - White
Place of birth - Native, outside of US (%) - Black or African American
Place of birth - Native, outside of US (%) - Asian
Place of birth - Native, outside of US (%) - Hispanic or Latino
Place of birth - Native, outside of US (%) - American Indian and Alaska Native
Place of birth - Native, outside of US (%) - Multirace
Place of birth - Native, outside of US (%) - Other Race
Place of birth - Foreign born (%)
Place of birth - Foreign born (%) - White
Place of birth - Foreign born (%) - Black or African American
Place of birth - Foreign born (%) - Asian
Place of birth - Foreign born (%) - Hispanic or Latino
Place of birth - Foreign born (%) - American Indian and Alaska Native
Place of birth - Foreign born (%) - Multirace
Place of birth - Foreign born (%) - Other Race
Residents speaking English at home (%)
Residents speaking English at home - Born in the United States (%)
Residents speaking English at home - Native, born elsewhere (%)
Residents speaking English at home - Foreign born (%)
Residents speaking Spanish at home (%)
Residents speaking Spanish at home - Born in the United States (%)
Residents speaking Spanish at home - Native, born elsewhere (%)
Residents speaking Spanish at home - Foreign born (%)
Residents speaking other language at home (%)
Residents speaking other language at home - Born in the United States (%)
Residents speaking other language at home - Native, born elsewhere (%)
Residents speaking other language at home - Foreign born (%)
Marital status - Never married (%)
Marital status - Now married (%)
Marital status - Separated (%)
Marital status - Widowed (%)
Marital status - Divorced (%)
Ancestries Reported - Arab (%)
Ancestries Reported - Czech (%)
Ancestries Reported - Danish (%)
Ancestries Reported - Dutch (%)
Ancestries Reported - English (%)
Ancestries Reported - French (%)
Ancestries Reported - French Canadian (%)
Ancestries Reported - German (%)
Ancestries Reported - Greek (%)
Ancestries Reported - Hungarian (%)
Ancestries Reported - Irish (%)
Ancestries Reported - Italian (%)
Ancestries Reported - Lithuanian (%)
Ancestries Reported - Norwegian (%)
Ancestries Reported - Polish (%)
Ancestries Reported - Portuguese (%)
Ancestries Reported - Russian (%)
Ancestries Reported - Scotch-Irish (%)
Ancestries Reported - Scottish (%)
Ancestries Reported - Slovak (%)
Ancestries Reported - Subsaharan African (%)
Ancestries Reported - Swedish (%)
Ancestries Reported - Swiss (%)
Ancestries Reported - Ukrainian (%)
Ancestries Reported - United States (%)
Ancestries Reported - Welsh (%)
Ancestries Reported - West Indian (%)
Ancestries Reported - Other (%)
Geographical mobility - Same house 1 year ago (%)
Geographical mobility - Same house 1 year ago (%) - White
Geographical mobility - Same house 1 year ago (%) - Black or African American
Geographical mobility - Same house 1 year ago (%) - Asian
Geographical mobility - Same house 1 year ago (%) - Hispanic or Latino
Geographical mobility - Same house 1 year ago (%) - American Indian and Alaska Native
Geographical mobility - Same house 1 year ago (%) - Multirace
Geographical mobility - Same house 1 year ago (%) - Other Race
Geographical mobility - Moved within same county (%)
Geographical mobility - Moved within same county (%) - White
Geographical mobility - Moved within same county (%) - Black or African American
Geographical mobility - Moved within same county (%) - Asian
Geographical mobility - Moved within same county (%) - Hispanic or Latino
Geographical mobility - Moved within same county (%) - American Indian and Alaska Native
Geographical mobility - Moved within same county (%) - Multirace
Geographical mobility - Moved within same county (%) - Other Race
Geographical mobility - Moved from different county within same state (%)
Geographical mobility - Moved from different county within same state (%) - White
Geographical mobility - Moved from different county within same state (%) - Black or African American
Geographical mobility - Moved from different county within same state (%) - Asian
Geographical mobility - Moved from different county within same state (%) - Hispanic or Latino
Geographical mobility - Moved from different county within same state (%) - American Indian and Alaska Native
Geographical mobility - Moved from different county within same state (%) - Multirace
Geographical mobility - Moved from different county within same state (%) - Other Race
Geographical mobility - Moved from different state (%)
Geographical mobility - Moved from different state (%) - White
Geographical mobility - Moved from different state (%) - Black or African American
Geographical mobility - Moved from different state (%) - Asian
Geographical mobility - Moved from different state (%) - Hispanic or Latino
Geographical mobility - Moved from different state (%) - American Indian and Alaska Native
Geographical mobility - Moved from different state (%) - Multirace
Geographical mobility - Moved from different state (%) - Other Race
Geographical mobility - Moved from abroad (%)
Geographical mobility - Moved from abroad (%) - White
Geographical mobility - Moved from abroad (%) - Black or African American
Geographical mobility - Moved from abroad (%) - Asian
Geographical mobility - Moved from abroad (%) - Hispanic or Latino
Geographical mobility - Moved from abroad (%) - American Indian and Alaska Native
Geographical mobility - Moved from abroad (%) - Multirace
Geographical mobility - Moved from abroad (%) - Other Race
Place of birth for the foreign-born population - Ireland (%)
Place of birth for the foreign-born population - Denmark (%)
Place of birth for the foreign-born population - Norway (%)
Place of birth for the foreign-born population - Sweden (%)
Place of birth for the foreign-born population - United Kingdom (%)
Place of birth for the foreign-born population - England (%)
Place of birth for the foreign-born population - Scotland (%)
Place of birth for the foreign-born population - Other Northern Europe (%)
Place of birth for the foreign-born population - Austria (%)
Place of birth for the foreign-born population - Belgium (%)
Place of birth for the foreign-born population - France (%)
Place of birth for the foreign-born population - Germany (%)
Place of birth for the foreign-born population - Netherlands (%)
Place of birth for the foreign-born population - Switzerland (%)
Place of birth for the foreign-born population - Other Western Europe (%)
Place of birth for the foreign-born population - Greece (%)
Place of birth for the foreign-born population - Italy (%)
Place of birth for the foreign-born population - Portugal (%)
Place of birth for the foreign-born population - Spain (%)
Place of birth for the foreign-born population - Other Southern Europe (%)
Place of birth for the foreign-born population - Albania (%)
Place of birth for the foreign-born population - Belarus (%)
Place of birth for the foreign-born population - Bosnia and Herzegovina (%)
Place of birth for the foreign-born population - Bulgaria (%)
Place of birth for the foreign-born population - Croatia (%)
Place of birth for the foreign-born population - Czechoslovakia (%)
Place of birth for the foreign-born population - Hungary (%)
Place of birth for the foreign-born population - Latvia (%)
Place of birth for the foreign-born population - Lithuania (%)
Place of birth for the foreign-born population - North Macedonia (Macedonia) (%)
Place of birth for the foreign-born population - Moldova (%)
Place of birth for the foreign-born population - Poland (%)
Place of birth for the foreign-born population - Romania (%)
Place of birth for the foreign-born population - Russia (%)
Place of birth for the foreign-born population - Serbia (%)
Place of birth for the foreign-born population - Ukraine (%)
Place of birth for the foreign-born population - Other Eastern Europe (%)
Place of birth for the foreign-born population - China (%)
Place of birth for the foreign-born population - Hong Kong (%)
Place of birth for the foreign-born population - Taiwan (%)
Place of birth for the foreign-born population - Japan (%)
Place of birth for the foreign-born population - Korea (%)
Place of birth for the foreign-born population - Other Eastern Asia (%)
Place of birth for the foreign-born population - Afghanistan (%)
Place of birth for the foreign-born population - Bangladesh (%)
Place of birth for the foreign-born population - India (%)
Place of birth for the foreign-born population - Iran (%)
Place of birth for the foreign-born population - Kazakhstan (%)
Place of birth for the foreign-born population - Nepal (%)
Place of birth for the foreign-born population - Pakistan (%)
Place of birth for the foreign-born population - Sri Lanka (%)
Place of birth for the foreign-born population - Uzbekistan (%)
Place of birth for the foreign-born population - Other South Central Asia (%)
Place of birth for the foreign-born population - Burma (%)
Place of birth for the foreign-born population - Cambodia (%)
Place of birth for the foreign-born population - Indonesia (%)
Place of birth for the foreign-born population - Laos (%)
Place of birth for the foreign-born population - Malaysia (%)
Place of birth for the foreign-born population - Philippines (%)
Place of birth for the foreign-born population - Singapore (%)
Place of birth for the foreign-born population - Thailand (%)
Place of birth for the foreign-born population - Vietnam (%)
Place of birth for the foreign-born population - Other South Eastern Asia (%)
Place of birth for the foreign-born population - Armenia (%)
Place of birth for the foreign-born population - Iraq (%)
Place of birth for the foreign-born population - Israel (%)
Place of birth for the foreign-born population - Jordan (%)
Place of birth for the foreign-born population - Kuwait (%)
Place of birth for the foreign-born population - Lebanon (%)
Place of birth for the foreign-born population - Saudi Arabia (%)
Place of birth for the foreign-born population - Syria (%)
Place of birth for the foreign-born population - Turkey (%)
Place of birth for the foreign-born population - Yemen (%)
Place of birth for the foreign-born population - Other Western Asia (%)
Place of birth for the foreign-born population - Eritrea (%)
Place of birth for the foreign-born population - Ethiopia (%)
Place of birth for the foreign-born population - Kenya (%)
Place of birth for the foreign-born population - Somalia (%)
Place of birth for the foreign-born population - Uganda (%)
Place of birth for the foreign-born population - Zimbabwe (%)
Place of birth for the foreign-born population - Other Eastern Africa (%)
Place of birth for the foreign-born population - Cameroon (%)
Place of birth for the foreign-born population - Congo (%)
Place of birth for the foreign-born population - Democratic Republic of Congo (Zaire) (%)
Place of birth for the foreign-born population - Other Middle Africa (%)
Place of birth for the foreign-born population - Egypt (%)
Place of birth for the foreign-born population - Morocco (%)
Place of birth for the foreign-born population - Sudan (%)
Place of birth for the foreign-born population - Other Northern Africa (%)
Place of birth for the foreign-born population - South Africa (%)
Place of birth for the foreign-born population - Other Southern Africa (%)
Place of birth for the foreign-born population - Cabo Verde (%)
Place of birth for the foreign-born population - Ghana (%)
Place of birth for the foreign-born population - Liberia (%)
Place of birth for the foreign-born population - Nigeria (%)
Place of birth for the foreign-born population - Senegal (%)
Place of birth for the foreign-born population - Sierra Leone (%)
Place of birth for the foreign-born population - Other Western Africa (%)
Place of birth for the foreign-born population - Australia (%)
Place of birth for the foreign-born population - New Zealand (%)
Place of birth for the foreign-born population - Fiji (%)
Place of birth for the foreign-born population - Micronesia (%)
Place of birth for the foreign-born population - Bahamas (%)
Place of birth for the foreign-born population - Barbados (%)
Place of birth for the foreign-born population - Cuba (%)
Place of birth for the foreign-born population - Dominica (%)
Place of birth for the foreign-born population - Dominican Republic (%)
Place of birth for the foreign-born population - Grenada (%)
Place of birth for the foreign-born population - Haiti (%)
Place of birth for the foreign-born population - Jamaica (%)
Place of birth for the foreign-born population - St. Vincent and the Grenadines (%)
Place of birth for the foreign-born population - Trinidad and Tobago (%)
Place of birth for the foreign-born population - West Indies (%)
Place of birth for the foreign-born population - Other Caribbean (%)
Place of birth for the foreign-born population - Belize (%)
Place of birth for the foreign-born population - Costa Rica (%)
Place of birth for the foreign-born population - El Salvador (%)
Place of birth for the foreign-born population - Guatemala (%)
Place of birth for the foreign-born population - Honduras (%)
Place of birth for the foreign-born population - Mexico (%)
Place of birth for the foreign-born population - Nicaragua (%)
Place of birth for the foreign-born population - Panama (%)
Place of birth for the foreign-born population - Other Central America (%)
Place of birth for the foreign-born population - Argentina (%)
Place of birth for the foreign-born population - Bolivia (%)
Place of birth for the foreign-born population - Brazil (%)
Place of birth for the foreign-born population - Chile (%)
Place of birth for the foreign-born population - Colombia (%)
Place of birth for the foreign-born population - Ecuador (%)
Place of birth for the foreign-born population - Guyana (%)
Place of birth for the foreign-born population - Peru (%)
Place of birth for the foreign-born population - Uruguay (%)
Place of birth for the foreign-born population - Venezuela (%)
Place of birth for the foreign-born population - Other South America (%)
Place of birth for the foreign-born population - Canada (%)
Place of birth for the foreign-born population - Other Northern America (%)
Place of birth for the foreign-born population - Other (%)
Latest news about races in Doraville, GA collected exclusively by city-data.com from local newspapers, TV, and radio stations
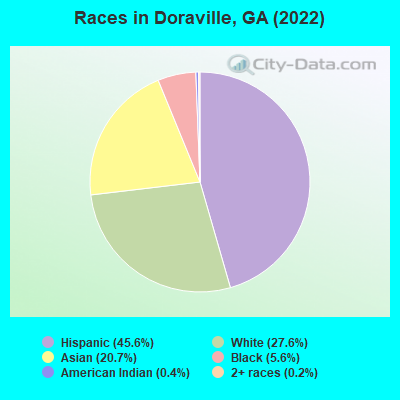
According to 2022 data, the most numerous races in Doraville, GA are White alone (2,959 residents), Black alone (599 residents), and Hispanic (4,888 residents). 34.3% of Doraville residents speak English at home. 43.0% of Doraville, GA residents are foreign-born (25.5% born in Latin America, 13.8% born in Asia), which is 76.8% greater than the foreign-born rate of 10.0% across the entire state of Georgia.
Race distribution in Doraville
2000 2022
5,128,661 62.6% White alone 2,331,465 28.5% Black alone 435,227 5.3% Hispanic 171,513 2.1% Asian alone 87,364 1.1% Two or more races 17,670 0.2% American Indian alone 11,275 0.1% Other race alone 3,278 0.04% Native Hawaiian and Other
5,415,657 49.6% White alone 3,349,240 30.7% Black alone 1,132,604 10.4% Hispanic 479,156 4.4% Asian alone 462,923 4.2% Two or more races 54,416 0.5% Other race alone 11,923 0.1% American Indian alone 6,957 0.06% Native Hawaiian and Other
Income and house value in Doraville Median household income in 2022 $69,421 White non-Hispanic householders$60,207 American Indian and Alaska Native householders$81,953 Asian householders$25,809 Some other race householders$55,057 Two or more races householders$36,088 Hispanic or Latino race householdersMedian 2022 house value $310,312 White Non-Hispanic householders$361,038 Black or African American householders $306,061 Asian householders$269,220 Native Hawaiian and other Pacific Islander householders$365,289 Some other race householders$338,651 Two or more races householders$330,432 Hispanic or Latino householders
Median age by race in Doraville
38.0 Median age for White residents34.2 41.2 33.5 Median age for Black or African American residents33.3 34.1 45.0 Median age for American Indian / Alaska Native residents47.6 33.1 38.3 Median age for Asian residents31.1 45.0 -657,243,815.6 Median age for Native Hawaiian / Pacific Islander residents-693,227,090.9 -776,776,776.0 27.5 Median age for Other race residents26.2 30.5 37.7 Median age for Two or more races residents32.6 37.9 51.8 Median age for White alone residents49.2 51.9 25.3 Median age for Hispanic or Latino residents22.7 29.7
Owner/renter occupied households by race in Doraville
House owners and renters - White residents 1,337 75.7% Owner occupied430 24.3% Renter occupiedHouse owners and renters - Black or African American residents 143 58.5% Owner occupied102 41.5% Renter occupiedHouse owners and renters - American Indian / Alaska Native residents 91 51.5% Owner occupied86 48.5% Renter occupiedHouse owners and renters - Asian residents 448 73.0% Owner occupied166 27.0% Renter occupiedHouse owners and renters - Other race residents 311 33.4% Owner occupied621 66.6% Renter occupiedHouse owners and renters - Two or more races residents 127 26.9% Owner occupied344 73.1% Renter occupiedHouse owners and renters - White alone residents 1,259 82.3% Owner occupied270 17.7% Renter occupiedHouse owners and renters - Hispanic or Latino residents 540 35.2% Owner occupied997 64.8% Renter occupied
Language usage in Doraville
English speakers - Total 34.3% of residents of Doraville speak English at home.
34.6% of residents speak Spanish at home 1,092 31.4% Speak English very well2,387 68.6% Speak English less than very well26.7% of residents speak other language at home 1,956 72.9% Speak English very well727 27.1% Speak English less than very well
English speakers - Born in the United States 86.9% of residents of Doraville speak English at home.
10.8% of residents speak Spanish at home 25 12.8% Speak English very well170 87.2% Speak English less than very well2.9% of residents speak other language at home 52 100.0% Speak English very well
English speakers - Native, born elsewhere 18.2% of residents of Doraville speak English at home.
3.7% of residents speak Spanish at home 6 85.7% Speak English very well1 14.3% Speak English less than very well149.2% of residents speak other language at home 279 100.0% Speak English very well
English speakers - Foreign-born 5.5% of residents of Doraville speak English at home.
49.4% of residents speak Spanish at home 326 15.4% Speak English very well1,796 84.6% Speak English less than very well36.6% of residents speak other language at home 920 58.6% Speak English very well650 41.4% Speak English less than very well
White (Caucasian) - Speak only English Native:
77.7% (2,571)Foreign-born:
16.4% (84)
White (Caucasian) - Speak another language Native:
14.9% (494)Foreign-born:
78.7% (405)
Black or African American - Speak another language Native:
14.4% (69)Foreign-born:
98.8% (133)
American Indian / Alaska Native - Speak another language Native:
42.0% (66)Foreign-born:
99.9% (96)
Asian - Speak only English Native:
19.1% (161)Foreign-born:
2.4% (33)
Asian - Speak another language Native:
79.4% (671)Foreign-born:
99.1% (1,347)
Other race - Speak only English Native:
5.5% (50)Foreign-born:
0.9% (16)
Other race - Speak another language Native:
100.0% (909)Foreign-born:
100.0% (1,780)
Two or more races - Speak only English Native:
11.0% (44)Foreign-born:
8.9% (64)
Two or more races - Speak another language Native:
75.3% (298)Foreign-born:
88.7% (631)
White alone - Speak only English Native:
89.9% (2,554)Foreign-born:
31.5% (21)
White alone - Speak another language Native:
8.1% (231)Foreign-born:
69.0% (47)
Hispanic or Latino - Speak only English Native:
9.5% (175)Foreign-born:
7.2% (174)
Hispanic or Latino - Speak another language Native:
81.5% (1,499)Foreign-born:
92.9% (2,253)
Foreign-born residents in Doraville 4,612 residents are foreign born (25.5% Latin America , 13.8% Asia ).
This city:
43.0%Georgia:
10.4%
Marital status for residents in Doraville Marital status - White (Caucasian) population 15 years and over
Males 36.1% Never married47.1% Now married0.4% Separated5.3% Widowed11.2% DivorcedFemales 37.7% Never married35.6% Now married0.4% Separated9.9% Widowed16.5% DivorcedWomen who gave birth in the past 12 months Now married:
70.2% (31)Unmarried:
29.8% (13)
Women who did not give birth in the past 12 months Now married:
39.5% (317)Unmarried:
60.5% (486)
Marital status - Black or African American population 15 years and over
Males 50.4% Never married48.7% Now married0.0% Separated0.0% Widowed0.9% DivorcedFemales 76.4% Never married18.3% Now married0.0% Separated5.3% Widowed0.0% DivorcedWomen who gave birth in the past 12 months Now married:
100.0% (16)Unmarried:
0.0% (0)
Women who did not give birth in the past 12 months Now married:
6.8% (20)Unmarried:
93.2% (274)
Marital status - American Indian / Alaska Native population 15 years and over
Males 42.2% Never married28.9% Now married8.9% Separated0.0% Widowed20.0% DivorcedFemales 43.8% Never married39.4% Now married0.0% Separated0.0% Widowed16.8% DivorcedWomen who did not give birth in the past 12 months Now married:
17.8% (21)Unmarried:
82.2% (95)
Marital status - Asian population 15 years and over
Males 34.5% Never married62.6% Now married0.0% Separated0.0% Widowed2.9% DivorcedFemales 33.0% Never married52.7% Now married3.8% Separated5.3% Widowed5.2% DivorcedWomen who gave birth in the past 12 months Now married:
100.0% (8)Unmarried:
0.0% (0)
Women who did not give birth in the past 12 months Now married:
60.4% (467)Unmarried:
39.6% (307)
Marital status - Other race population 15 years and over
Males 48.7% Never married48.3% Now married3.0% Separated0.0% Widowed0.0% DivorcedFemales 28.4% Never married65.2% Now married6.5% Separated0.0% Widowed0.0% DivorcedWomen who gave birth in the past 12 months Now married:
100.0% (21)Unmarried:
0.0% (0)
Women who did not give birth in the past 12 months Now married:
57.6% (231)Unmarried:
42.4% (170)
Marital status - Two or more races population 15 years and over
Males 54.6% Never married42.5% Now married2.9% Separated0.0% Widowed0.0% DivorcedFemales 26.9% Never married71.0% Now married0.0% Separated0.2% Widowed1.9% DivorcedWomen who did not give birth in the past 12 months Now married:
74.6% (350)Unmarried:
25.4% (119)
Marital status - White alone, not Hispanic / Latino population 15 years and over
Males 28.1% Never married50.2% Now married0.5% Separated6.9% Widowed14.4% DivorcedFemales 33.0% Never married34.8% Now married0.5% Separated10.9% Widowed20.9% DivorcedWomen who gave birth in the past 12 months Now married:
100.0% (33)Unmarried:
0.0% (0)
Women who did not give birth in the past 12 months Now married:
40.0% (189)Unmarried:
60.0% (285)
Marital status - Hispanic or Latino population 15 years and over
Males 52.9% Never married42.7% Now married2.8% Separated0.0% Widowed1.6% DivorcedFemales 37.8% Never married57.2% Now married1.8% Separated2.0% Widowed1.1% DivorcedWomen who gave birth in the past 12 months Now married:
50.0% (15)Unmarried:
50.0% (15)
Women who did not give birth in the past 12 months Now married:
55.5% (674)Unmarried:
44.5% (540)
Ancestries in Doraville
621 7.7% American263 3.3% English249 3.1% German128 1.6% European78 1.0% Scottish39 0.5% Ethiopian38 0.5% Irish35 0.4% Polish24 0.3% British23 0.3% Russian15 0.2% African14 0.2% Italian13 0.2% Belgian10 0.1% Norwegian7 0.09% Arab6 0.07% Danish6 0.07% Scotch-Irish5 0.06% Swiss
Geographical mobility in Doraville Same house 1 year ago 3,782 89.4% White (Caucasian)419 67.0% Black or African American214 87.1% American Indian / Alaska Native2,002 91.4% Asian2,710 91.8% Other race1,058 80.9% Two or more races2,649 90.6% White alone, not Hispanic / Latino4,116 86.0% Hispanic or LatinoMoved within same county 174 4.1% White / Caucasian2 0.3% Black or African American1 0.5% American Indian / Alaska Native61 2.8% Asian266 20.3% Two or more races192 6.6% White alone, not Hispanic / Latino105 2.2% Hispanic or LatinoMoved within same state 221 5.2% White / Caucasian234 37.5% Black or African American88 4.0% Asian45 1.5% Other race6 0.5% Two or more races65 2.2% White alone, not Hispanic / Latino397 8.3% Hispanic or LatinoMoved from different state 12 0.3% White / Caucasian13 2.1% Black or African American38 1.8% Asian95 3.2% Other race20 1.5% Two or more races12 0.4% White alone, not Hispanic / Latino101 2.1% Hispanic or LatinoMoved from abroad 17 0.4% White33 0.7% Hispanic or Latino
Children Nativity (place of birth) in Doraville
Children under 6 years - Living with two parents Both parents native 206 100.0% NativeBoth parents foreign-born 466 100.0% NativeOne native, one foreign-born parent 13 100.0% NativeChildren under 6 years - Living with one parent Native parent 24 100.0% NativeForeign-born parent 146 100.0% NativeChildren 6 to 17 years - Living with two parents Both parents foreign-born 910 84.5% Native167 15.5% Foreign-bornOne native, one foreign-born parent 61 100.0% NativeChildren 6 to 17 years - Living with one parent Foreign-born parent 554 59.5% Native378 40.5% Foreign-born
Grandparents responsible for own grandchildren in Doraville
Grandparents (30 to 59 years) Other race 7 100.0% Responsible for grandchildrenHispanic or Latino 7 100.0% Responsible for grandchildren
Grandparents (60 years and over) Other race 10 100.0% Responsible for grandchildrenHispanic or Latino 9 100.0% Responsible for grandchildren