Races in Dormont, Pennsylvania (PA) Detailed Stats
Ancestries, Foreign-born residents, place of birth
Settings
X


Recent posts about races in Dormont, Pennsylvania on our local forum with over 2,400,000 registered users:
 | Unique Dormont infill housing and other updates (92 replies) |
| 5 People Shot Within 24 Hours In Allegheny County (3431 replies) |
| Squirrel Hill or Greensburg? (60 replies) |
| 2014 Dormont House Tour (0 replies) |
| Where should I move to in the Pittsburgh Area? (35 replies) |
| Possible move to Pittsburgh (58 replies) |
Latest news about races in Dormont, PA collected exclusively by city-data.com from local newspapers, TV, and radio stations
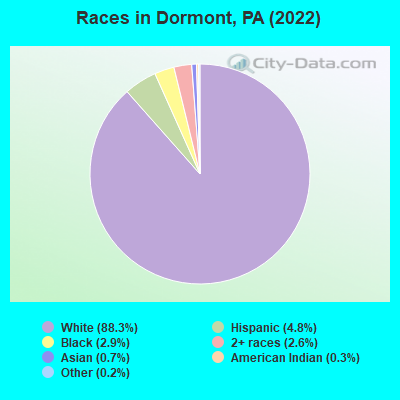
According to 2022 data, the most numerous races in Dormont, PA are White alone (7,169 residents), Black alone (232 residents), and Hispanic (387 residents). 94.6% of Dormont residents speak English at home. 2.9% of Dormont, PA residents are foreign-born (1.4% born in Europe, 0.5% born in Africa, 0.4% born in Asia, 0.4% born in Latin America), which is 140.8% less than the foreign-born rate of 7.0% across the entire state of Pennsylvania.
Race distribution in Dormont
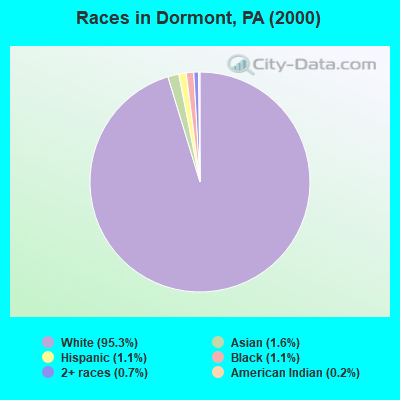
2000
2022

- 8,87095.3%White alone
- 1471.6%Asian alone
- 981.1%Black alone
- 991.1%Hispanic
- 690.7%Two or more races
- 160.2%American Indian alone
- 50.05%Native Hawaiian and Other
Pacific Islander alone - 10.01%Other race alone
-
- 7,16988.3%White alone
- 3874.8%Hispanic
- 2322.9%Black alone
- 2102.6%Two or more races
- 580.7%Asian alone
- 220.3%American Indian alone
- 140.2%Other race alone
2000
2022
-
- 10,322,45584.1%White alone
- 1,202,4379.8%Black alone
- 394,0883.2%Hispanic
- 218,2961.8%Asian alone
- 113,0970.9%Two or more races
- 13,0860.1%Other race alone
- 14,9040.1%American Indian alone
- 2,6910.02%Native Hawaiian and Other
Pacific Islander alone

-
- 9,487,22873.1%White alone
- 1,311,58110.1%Black alone
- 1,115,9978.6%Hispanic
- 493,9423.8%Two or more races
- 487,1243.8%Asian alone
- 63,5820.5%Other race alone
- 10,1300.08%American Indian alone
- 2,4240.02%Native Hawaiian and Other
Pacific Islander alone

Income and house value in Dormont
- Median household income in 2022
- $73,264White non-Hispanic householders
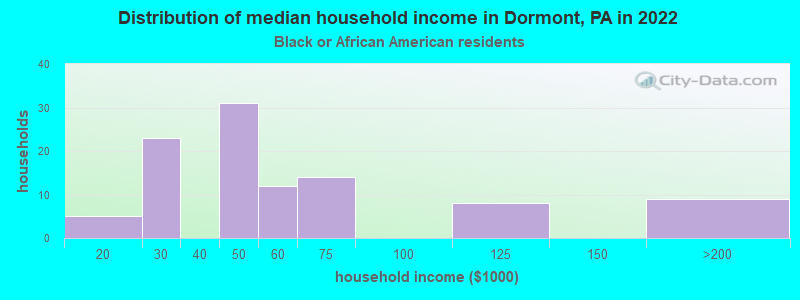
- $41,599Black householders
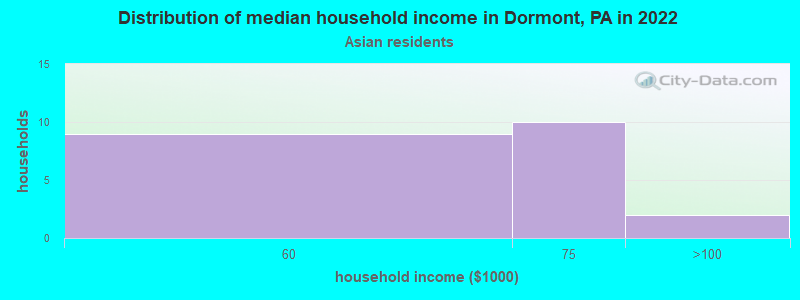
- $62,524Asian householders
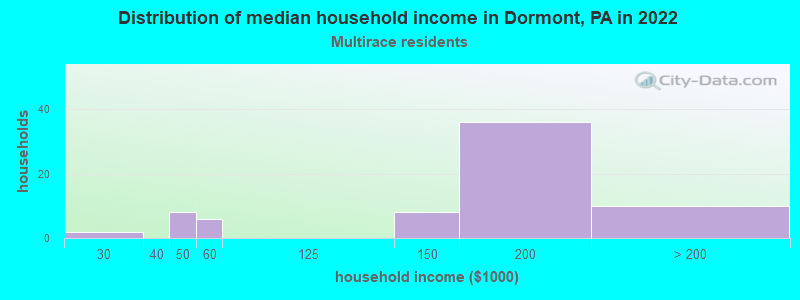
- $145,716Two or more races householders
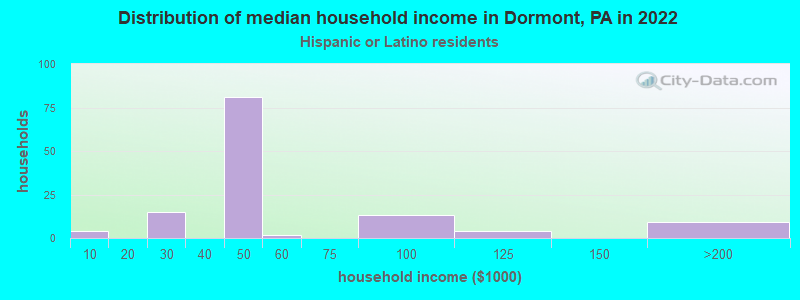
- $44,986Hispanic or Latino race householders
- Median 2022 house value
- $205,429White Non-Hispanic householders
- $44,714Black or African American householders
- $204,407Asian householders
- $242,734Some other race householders
- $217,183Two or more races householders
- $49,313Hispanic or Latino householders
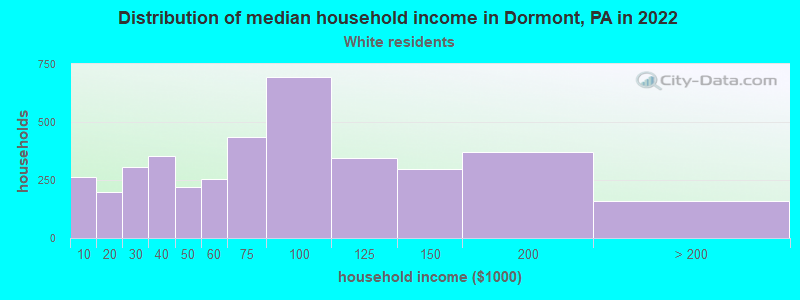
Household income for White non-Hispanic householders
Household income for Black householders
Household income for Asian householders
Household income for Some other race householders

Household income for Two or more races householders
Household income for Hispanic or Latino race householders
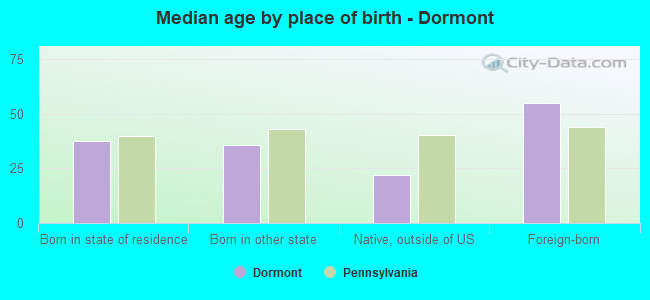
Median age by race in Dormont
- 38.0Median age for White residents
- 38.7Males
- 37.6Females
- 27.9Median age for Black or African American residents
- 28.8Males
- 25.5Females
- 20.6Median age for American Indian / Alaska Native residents
- -714,583,332.6Males
- -577,519,379.3Females
- 57.0Median age for Asian residents
- 58.9Males
- 57.8Females
- -656,534,953.8Median age for Native Hawaiian / Pacific Islander residents
- -919,148,935.3Males
- -747,474,746.7Females
- 33.1Median age for Other race residents
- -689,440,993.1Males
- 32.1Females
- 21.1Median age for Two or more races residents
- 23.0Males
- 15.7Females
- 37.8Median age for White alone residents
- 38.0Males
- 37.7Females
- 25.1Median age for Hispanic or Latino residents
- 41.6Males
- 17.4Females
Owner/renter occupied households by race in Dormont
- House owners and renters - White residents
- 2,29759.3%Owner occupied
- 1,57740.7%Renter occupied
- House owners and renters - Black or African American residents
- 87.6%Owner occupied
- 9592.4%Renter occupied
- House owners and renters - American Indian / Alaska Native residents
- 6100.0%Owner occupied
- House owners and renters - Asian residents
- 1483.9%Owner occupied
- 316.1%Renter occupied
- House owners and renters - Other race residents
- 7100.0%Renter occupied
- House owners and renters - Two or more races residents
- 3848.3%Owner occupied
- 4051.7%Renter occupied
- House owners and renters - White alone residents
- 2,22358.5%Owner occupied
- 1,57641.5%Renter occupied
- House owners and renters - Hispanic or Latino residents
- 9778.5%Owner occupied
- 2721.5%Renter occupied
Language usage in Dormont
- English speakers - Total
- 94.6% of residents of Dormont speak English at home.
- 2.5% of residents speak Spanish at home
- 11861.5%Speak English very well
- 7438.5%Speak English less than very well
- 2.7% of residents speak other language at home
- 14065.7%Speak English very well
- 7334.3%Speak English less than very well
- English speakers - Born in the United States
- 94.7% of residents of Dormont speak English at home.
- 2.5% of residents speak Spanish at home
- 36100.0%Speak English less than very well
- 1.4% of residents speak other language at home
- 20100.0%Speak English very well
- English speakers - Native, born elsewhere
- 5.7% of residents of Dormont speak English at home.
- 95.1% of residents speak Spanish at home
- 11598.3%Speak English very well
- 21.7%Speak English less than very well
- 37.4% of residents speak other language at home
- 3473.9%Speak English very well
- 1226.1%Speak English less than very well
- English speakers - Foreign-born
- 41.4% of residents of Dormont speak English at home.
- 7.1% of residents speak Spanish at home
- 15100.0%Speak English less than very well
- 50.0% of residents speak other language at home
- 4744.8%Speak English very well
- 5855.2%Speak English less than very well
White (Caucasian) - Speak only English
| Native: | 98.1% (6,757) |
| Foreign-born: | 49.5% (73) |
White (Caucasian) - Speak another language
| Native: | 1.9% (133) |
| Foreign-born: | 51.4% (76) |
Asian - Speak only English
| Native: | 28.0% (8) |
| Foreign-born: | 17.5% (7) |
Asian - Speak another language
| Native: | 74.9% (21) |
| Foreign-born: | 82.4% (35) |
Other race - Speak only English
| Native: | 81.7% (27) |
| Foreign-born: | 45.7% (2) |
White alone - Speak only English
| Native: | 97.9% (6,576) |
| Foreign-born: | 45.4% (65) |
White alone - Speak another language
| Native: | 2.1% (142) |
| Foreign-born: | 54.6% (78) |
Hispanic or Latino - Speak only English
| Native: | 65.1% (225) |
| Foreign-born: | 37.8% (14) |
Hispanic or Latino - Speak another language
| Native: | 34.8% (120) |
| Foreign-born: | 51.6% (19) |
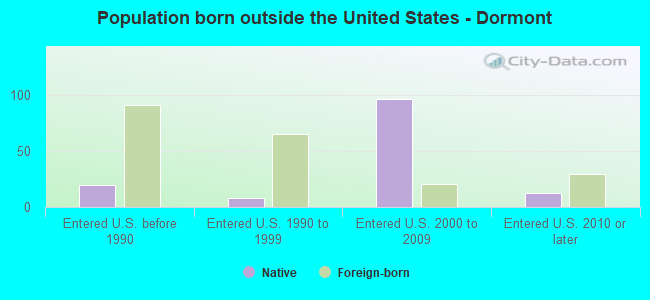
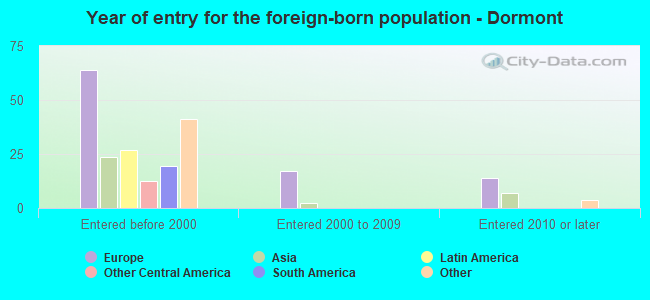
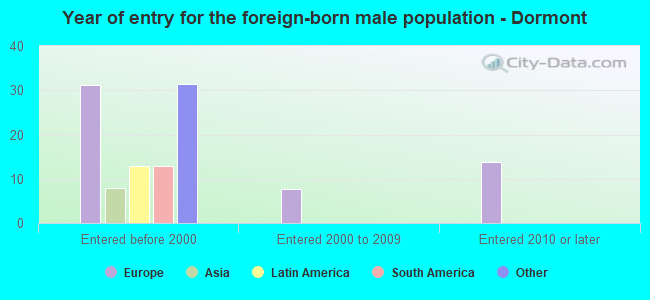
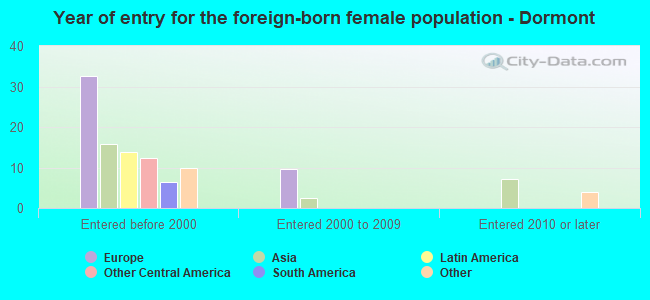
Foreign-born residents in Dormont
236 residents are foreign born (1.4% Europe, 0.5% Africa, 0.4% Asia, 0.4% Latin America).
| This city: | 2.9% |
| Pennsylvania: | 7.3% |

Marital status for residents in Dormont
Marital status - White (Caucasian) population 15 years and over
- Males
- 44.9%Never married
- 42.1%Now married
- 1.1%Separated
- 2.3%Widowed
- 9.6%Divorced
- Females
- 38.6%Never married
- 40.4%Now married
- 1.8%Separated
- 8.9%Widowed
- 10.3%Divorced
Women who gave birth in the past 12 months
| Now married: | 100.0% (61) |
| Unmarried: | 0.0% (0) |
Women who did not give birth in the past 12 months
| Now married: | 38.3% (693) |
| Unmarried: | 61.7% (1,116) |
Marital status - Black or African American population 15 years and over
- Males
- 52.3%Never married
- 18.7%Now married
- 28.9%Separated
- 0.0%Widowed
- 0.0%Divorced
- Females
- 68.8%Never married
- 25.0%Now married
- 0.0%Separated
- 0.0%Widowed
- 6.2%Divorced
Women who gave birth in the past 12 months
| Now married: | 100.0% (11) |
| Unmarried: | 0.0% (0) |
Women who did not give birth in the past 12 months
| Now married: | 0.0% (0) |
| Unmarried: | 100.0% (55) |
Marital status - American Indian / Alaska Native population 15 years and over
- Males
- 0.0%Never married
- 100.0%Now married
- 0.0%Separated
- 0.0%Widowed
- 0.0%Divorced
- Females
- 100.0%Never married
- 0.0%Now married
- 0.0%Separated
- 0.0%Widowed
- 0.0%Divorced
Women who did not give birth in the past 12 months
| Now married: | 0.0% (0) |
| Unmarried: | 100.0% (24) |
Marital status - Asian population 15 years and over
- Males
- 33.3%Never married
- 66.7%Now married
- 0.0%Separated
- 0.0%Widowed
- 0.0%Divorced
- Females
- 16.2%Never married
- 64.9%Now married
- 0.0%Separated
- 18.9%Widowed
- 0.0%Divorced
Women who did not give birth in the past 12 months
| Now married: | 60.0% (9) |
| Unmarried: | 40.0% (6) |
Marital status - Other race population 15 years and over
- Males
- 100.0%Never married
- 0.0%Now married
- 0.0%Separated
- 0.0%Widowed
- 0.0%Divorced
- Females
- 70.0%Never married
- 13.3%Now married
- 0.0%Separated
- 0.0%Widowed
- 16.7%Divorced
Women who did not give birth in the past 12 months
| Now married: | 13.3% (5) |
| Unmarried: | 86.7% (32) |
Marital status - Two or more races population 15 years and over
- Males
- 81.9%Never married
- 9.4%Now married
- 0.0%Separated
- 0.0%Widowed
- 8.7%Divorced
- Females
- 48.8%Never married
- 46.3%Now married
- 0.0%Separated
- 4.9%Widowed
- 0.0%Divorced
Women who did not give birth in the past 12 months
| Now married: | 35.5% (15) |
| Unmarried: | 64.5% (27) |
Marital status - White alone, not Hispanic / Latino population 15 years and over
- Males
- 44.6%Never married
- 42.3%Now married
- 1.1%Separated
- 2.4%Widowed
- 9.7%Divorced
- Females
- 37.7%Never married
- 41.0%Now married
- 1.9%Separated
- 9.0%Widowed
- 10.4%Divorced
Women who gave birth in the past 12 months
| Now married: | 100.0% (62) |
| Unmarried: | 0.0% (0) |
Women who did not give birth in the past 12 months
| Now married: | 39.3% (695) |
| Unmarried: | 60.7% (1,074) |
Marital status - Hispanic or Latino population 15 years and over
- Males
- 65.4%Never married
- 24.8%Now married
- 0.0%Separated
- 0.0%Widowed
- 9.8%Divorced
- Females
- 79.8%Never married
- 14.6%Now married
- 0.0%Separated
- 0.0%Widowed
- 5.6%Divorced
Women who did not give birth in the past 12 months
| Now married: | 5.0% (4) |
| Unmarried: | 95.0% (81) |
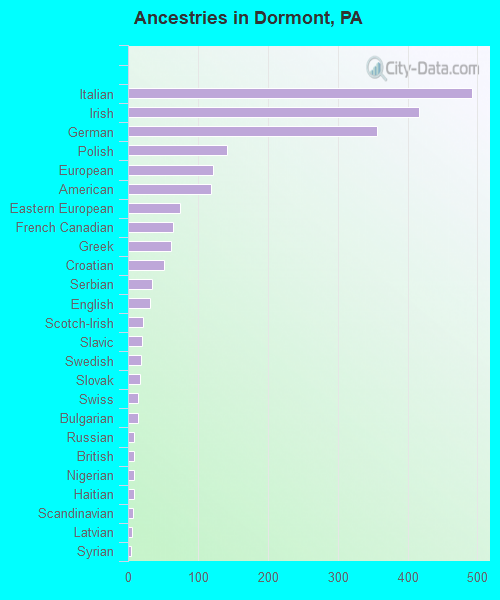
Ancestries in Dormont

- 49220.3%Italian
- 41617.2%Irish
- 35614.7%German
- 1425.9%Polish
- 1215.0%European
- 1194.9%American
- 743.1%Eastern European
- 652.7%French Canadian
- 612.5%Greek
- 522.1%Croatian
- 341.4%Serbian
- 311.3%English
- 220.9%Scotch-Irish
- 200.8%Slavic
- 180.7%Swedish
- 170.7%Slovak
- 150.6%Swiss
- 140.6%Bulgarian
- 90.4%Russian
- 80.3%British
- 80.3%Nigerian
- 80.3%Haitian
- 70.3%Scandinavian
- 60.2%Latvian
- 50.2%Syrian
- 40.2%Israeli
- 40.2%South African
- 30.1%Scottish
- 30.1%Ukrainian
- 10.04%French
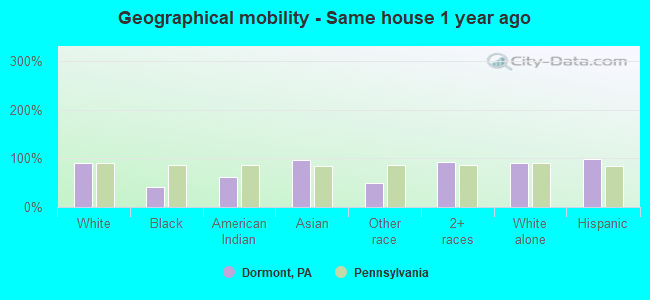
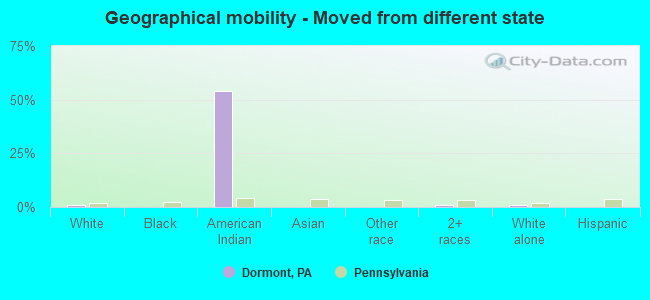
Geographical mobility in Dormont

- Same house 1 year ago
- 6,56490.0%White (Caucasian)
- 9540.9%Black or African American
- 1860.9%American Indian / Alaska Native
- 6696.8%Asian
- 1850.3%Other race
- 33993.0%Two or more races
- 6,38489.7%White alone, not Hispanic / Latino
- 38098.1%Hispanic or Latino
-
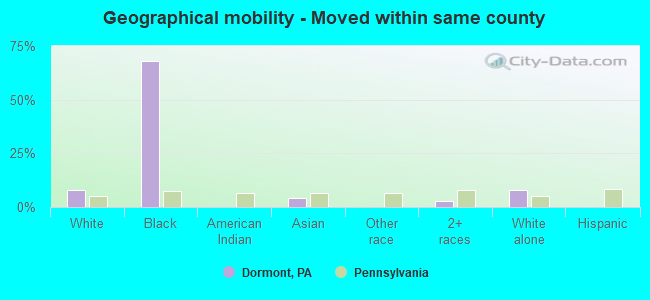
- Moved within same county
- 5637.7%White / Caucasian
- 15868.0%Black or African American
- 34.1%Asian
- 102.6%Two or more races
- 5668.0%White alone, not Hispanic / Latino
-
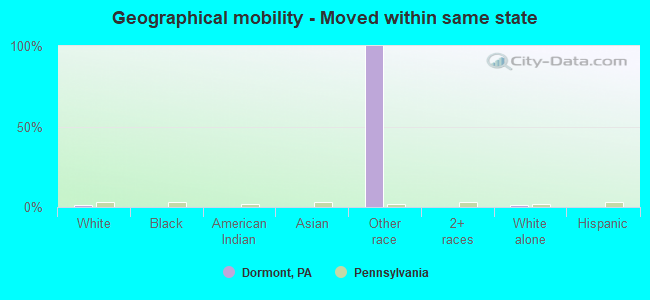
- Moved within same state
- 861.2%White / Caucasian
- 40100.0%Other race
- 871.2%White alone, not Hispanic / Latino
-
- Moved from different state
- 630.9%White / Caucasian
- 1654.1%American Indian / Alaska Native
- 30.8%Two or more races
- 640.9%White alone, not Hispanic / Latino
-
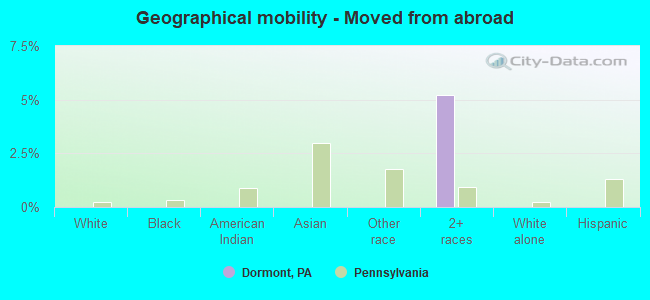
- Moved from abroad
- 195.2%Two or more races
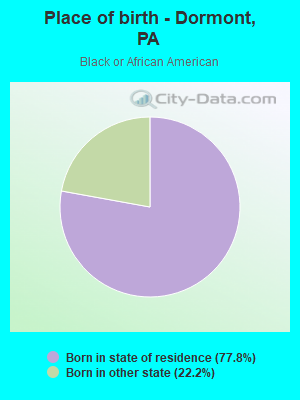
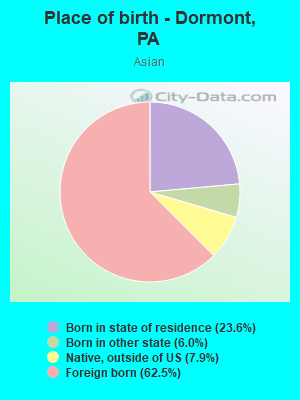
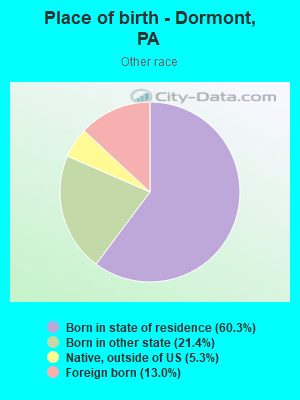
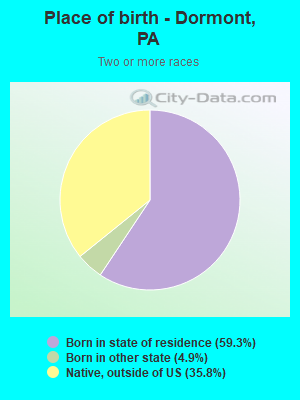
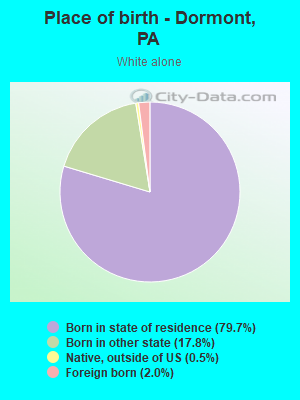
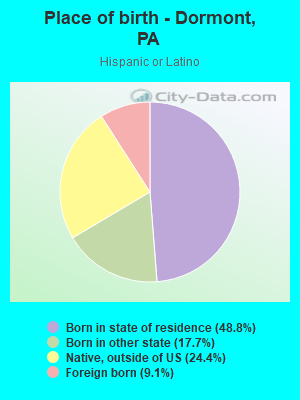
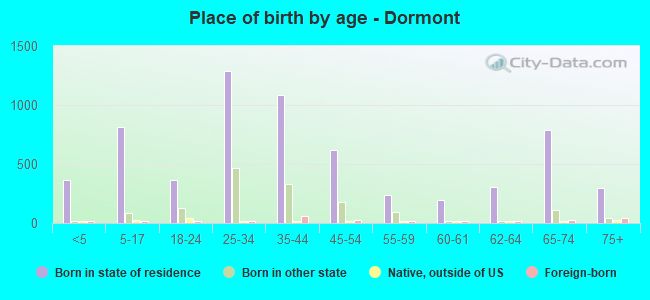
Children Nativity (place of birth) in Dormont
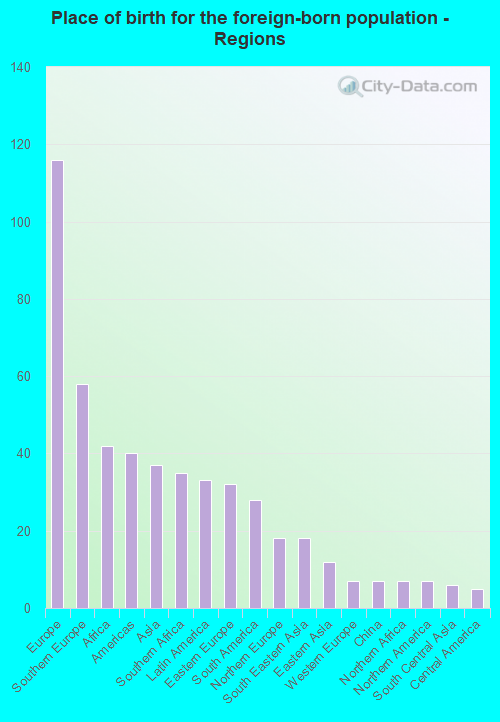
Place of birth for residents in Dormont
![Place of birth for the foreign-born population - Regions]()
- 116Europe
- 58Southern Europe
- 42Africa
- 40Americas
- 37Asia
- 35Southern Africa
- 33Latin America
- 32Eastern Europe
- 28South America
- 18Northern Europe
- 18South Eastern Asia
- 12Eastern Asia
- 7Western Europe
- 7China
- 7Northern Africa
- 7Northern America
- 6South Central Asia
- 5Central America
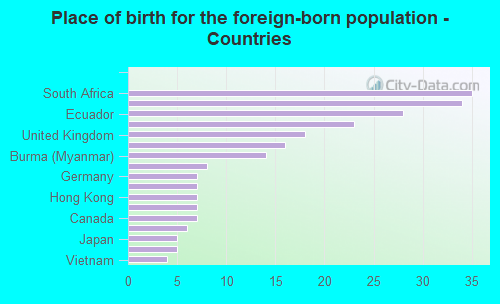
![Place of birth for the foreign-born population - Countries]()
- 35South Africa
- 34Italy
- 28Ecuador
- 23Greece
- 18United Kingdom
- 16Poland
- 14Burma (Myanmar)
- 8Latvia
- 7Germany
- 7Serbia
- 7Hong Kong
- 7Egypt
- 7Canada
- 6India
- 5Japan
- 5Guatemala
- 4Vietnam