Races in Dover, New Hampshire (NH) Detailed Stats
Ancestries, Foreign-born residents, place of birth
Settings
X


Recent posts about races in Dover, New Hampshire on our local forum with over 2,400,000 registered users:

Latest news about races in Dover, NH collected exclusively by city-data.com from local newspapers, TV, and radio stations
According to 2022 data, the most numerous races in Dover, NH are White alone (28,418 residents), Hispanic (1,500 residents), and Two or more races (1,242 residents). 91.7% of Dover residents speak English at home. 5.9% of Dover, NH residents are foreign-born (2.8% born in Asia, 1.4% born in Europe, 0.6% born in Latin America), which is 15.1% greater than the foreign-born rate of 5.0% across the entire state of New Hampshire.
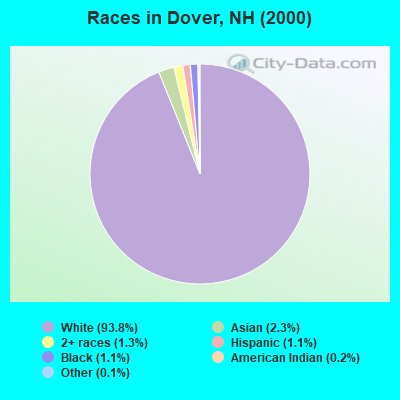
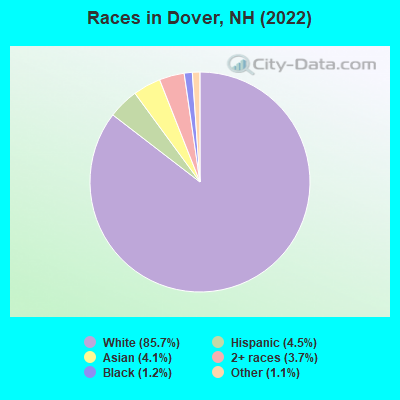
Race distribution in Dover
2000
2022

- 25,21793.8%White alone
- 6202.3%Asian alone
- 3601.3%Two or more races
- 3061.1%Hispanic
- 2891.1%Black alone
- 450.2%American Indian alone
- 320.1%Other race alone
- 150.06%Native Hawaiian and Other
Pacific Islander alone
-
- 28,41885.7%White alone
- 1,5004.5%Hispanic
- 1,3584.1%Asian alone
- 1,2423.7%Two or more races
- 3981.2%Black alone
- 3521.1%Other race alone
2000
2022
-
- 1,175,25295.1%White alone
- 20,4891.7%Hispanic
- 15,8031.3%Asian alone
- 11,6060.9%Two or more races
- 8,3540.7%Black alone
- 2,6980.2%American Indian alone
- 1,2540.1%Other race alone
- 3300.03%Native Hawaiian and Other
Pacific Islander alone

-
- 1,208,10186.6%White alone
- 63,4794.5%Hispanic
- 60,7244.4%Two or more races
- 36,5192.6%Asian alone
- 17,9311.3%Black alone
- 6,6150.5%Other race alone
- 1,0140.07%American Indian alone
- 8480.06%Native Hawaiian and Other
Pacific Islander alone

Income and house value in Dover
- Median household income in 2022
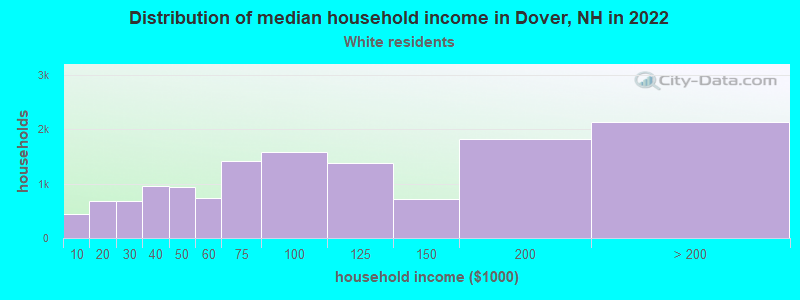
- $90,675White non-Hispanic householders
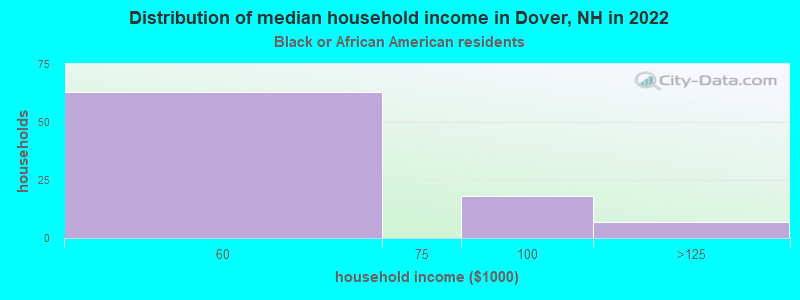
- $52,105Black householders
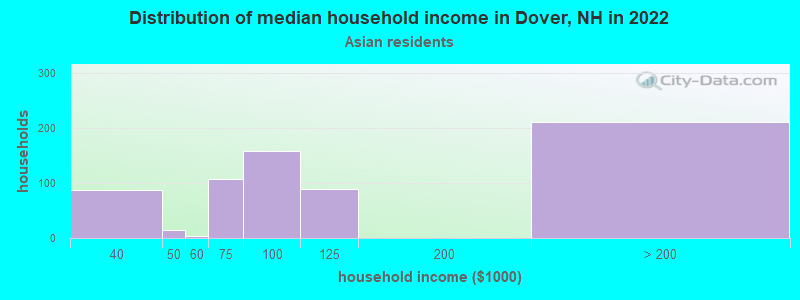
- $112,409Asian householders
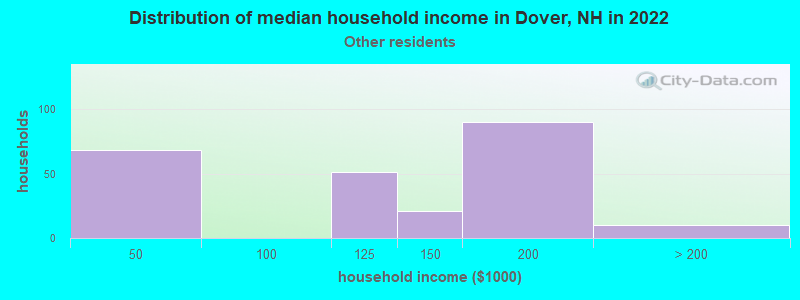
- $121,213Some other race householders
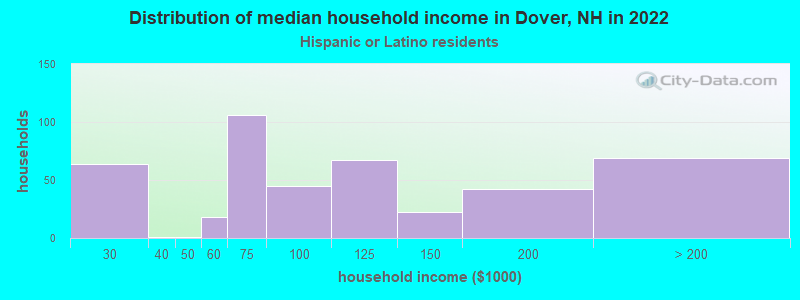
- $115,781Hispanic or Latino race householders
- Median 2022 house value
- $433,745White Non-Hispanic householders
- $449,434Black or African American householders
- $212,460American Indian or Alaska Native householders
- $525,920Asian householders
- $735,438Some other race householders
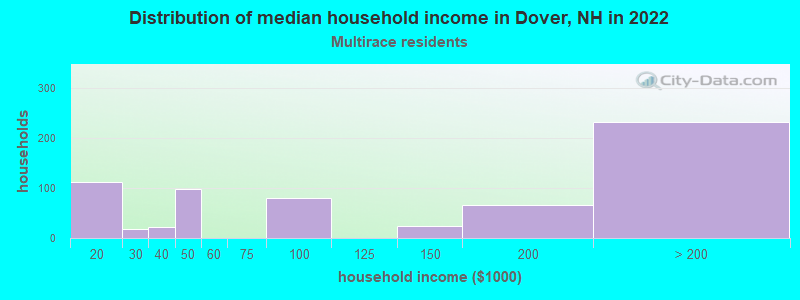
- $380,140Two or more races householders
- $694,580Hispanic or Latino householders
Household income for White non-Hispanic householders
Household income for Black householders
Household income for Asian householders
Household income for Some other race householders
Household income for Two or more races householders
Household income for Hispanic or Latino race householders
Median age by race in Dover
- 38.3Median age for White residents
- 37.8Males
- 39.7Females
- 36.5Median age for Black or African American residents
- 34.0Males
- 53.1Females
- -671,296,295.6Median age for American Indian / Alaska Native residents
- -772,357,722.8Males
- -763,157,894.0Females
- 44.9Median age for Asian residents
- 41.0Males
- 46.0Females
- -666,666,666.0Median age for Native Hawaiian / Pacific Islander residents
- -666,666,666.0Males
- -666,666,666.0Females
- 32.9Median age for Other race residents
- 43.9Males
- 31.2Females
- 30.9Median age for Two or more races residents
- 35.3Males
- 29.1Females
- 38.6Median age for White alone residents
- 38.6Males
- 39.3Females
- 32.6Median age for Hispanic or Latino residents
- 28.2Males
- 33.8Females
Owner/renter occupied households by race in Dover
- House owners and renters - White residents
- 7,28554.0%Owner occupied
- 6,20446.0%Renter occupied
- House owners and renters - Black or African American residents
- 98100.0%Renter occupied
- House owners and renters - Asian residents
- 9916.5%Owner occupied
- 50183.5%Renter occupied
- House owners and renters - Other race residents
- 8428.4%Owner occupied
- 21171.6%Renter occupied
- House owners and renters - Two or more races residents
- 23964.9%Owner occupied
- 12935.1%Renter occupied
- House owners and renters - White alone residents
- 7,15153.9%Owner occupied
- 6,12746.1%Renter occupied
- House owners and renters - Hispanic or Latino residents
- 25566.8%Owner occupied
- 12733.2%Renter occupied
Language usage in Dover
- English speakers - Total
- 91.7% of residents of Dover speak English at home.
- 2.6% of residents speak Spanish at home
- 59372.3%Speak English very well
- 22727.7%Speak English less than very well
- 5.9% of residents speak other language at home
- 1,43176.9%Speak English very well
- 42923.1%Speak English less than very well
- English speakers - Born in the United States
- 97.2% of residents of Dover speak English at home.
- 1.4% of residents speak Spanish at home
- 21496.8%Speak English very well
- 73.2%Speak English less than very well
- 1.3% of residents speak other language at home
- 10051.3%Speak English very well
- 9548.7%Speak English less than very well
- English speakers - Native, born elsewhere
- 57.5% of residents of Dover speak English at home.
- 12.4% of residents speak Spanish at home
- 7271.3%Speak English very well
- 2928.7%Speak English less than very well
- 9.2% of residents speak other language at home
- 75100.0%Speak English very well
- English speakers - Foreign-born
- 32.1% of residents of Dover speak English at home.
- 9.4% of residents speak Spanish at home
- 2310.4%Speak English very well
- 19989.6%Speak English less than very well
- 59.8% of residents speak other language at home
- 1,04273.4%Speak English very well
- 37726.6%Speak English less than very well
White (Caucasian) - Speak only English
| Native: | 98.0% (26,122) |
| Foreign-born: | 53.4% (569) |
White (Caucasian) - Speak another language
| Native: | 2.0% (529) |
| Foreign-born: | 45.3% (483) |
Black or African American - Speak only English
| Native: | 100.0% (283) |
| Foreign-born: | 26.6% (28) |
Black or African American - Speak another language
| Native: | 1.6% (4) |
| Foreign-born: | 60.6% (64) |
Asian - Speak only English
| Native: | 85.2% (277) |
| Foreign-born: | 16.4% (148) |
Asian - Speak another language
| Native: | 10.1% (33) |
| Foreign-born: | 82.9% (750) |
Other race - Speak another language
| Native: | 37.4% (166) |
| Foreign-born: | 100.0% (143) |
Two or more races - Speak another language
| Native: | 22.1% (409) |
| Foreign-born: | 92.7% (66) |
White alone - Speak only English
| Native: | 97.9% (25,585) |
| Foreign-born: | 56.2% (581) |
White alone - Speak another language
| Native: | 2.0% (531) |
| Foreign-born: | 43.5% (449) |
Hispanic or Latino - Speak another language
| Native: | 39.9% (493) |
| Foreign-born: | 100.0% (174) |
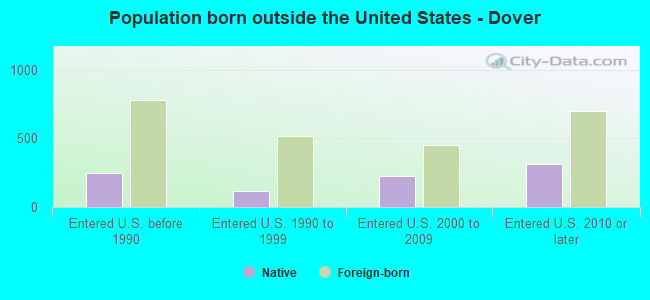
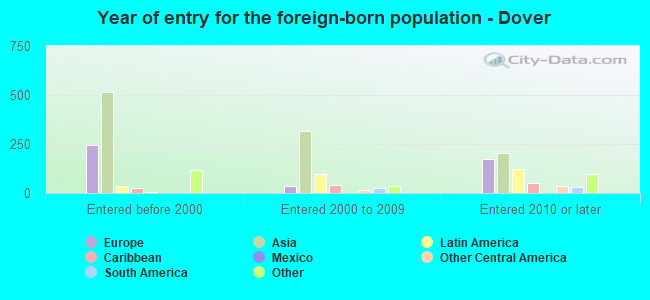
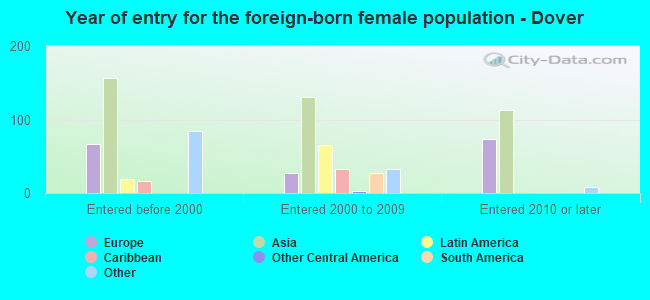
Foreign-born residents in Dover
1,953 residents are foreign born (2.8% Asia, 1.4% Europe, 0.6% Latin America).
| This city: | 5.9% |
| New Hampshire: | 6.0% |


Marital status for residents in Dover
Marital status - White (Caucasian) population 15 years and over
- Males
- 37.4%Never married
- 49.8%Now married
- 0.9%Separated
- 1.9%Widowed
- 10.0%Divorced
- Females
- 34.2%Never married
- 46.1%Now married
- 2.1%Separated
- 6.1%Widowed
- 11.5%Divorced
Women who gave birth in the past 12 months
| Now married: | 86.6% (284) |
| Unmarried: | 13.4% (44) |
Women who did not give birth in the past 12 months
| Now married: | 39.8% (2,732) |
| Unmarried: | 60.2% (4,125) |
Marital status - Black or African American population 15 years and over
- Males
- 44.7%Never married
- 25.9%Now married
- 0.0%Separated
- 0.0%Widowed
- 29.4%Divorced
- Females
- 62.1%Never married
- 24.2%Now married
- 0.0%Separated
- 0.0%Widowed
- 13.6%Divorced
Women who did not give birth in the past 12 months
| Now married: | 0.0% (0) |
| Unmarried: | 100.0% (40) |
Marital status - Asian population 15 years and over
- Males
- 44.4%Never married
- 55.6%Now married
- 0.0%Separated
- 0.0%Widowed
- 0.0%Divorced
- Females
- 41.9%Never married
- 58.1%Now married
- 0.0%Separated
- 0.0%Widowed
- 0.0%Divorced
Women who gave birth in the past 12 months
| Now married: | 100.0% (84) |
| Unmarried: | 0.0% (0) |
Women who did not give birth in the past 12 months
| Now married: | 35.8% (82) |
| Unmarried: | 64.2% (147) |
Marital status - Other race population 15 years and over
- Males
- 0.0%Never married
- 100.0%Now married
- 0.0%Separated
- 0.0%Widowed
- 0.0%Divorced
- Females
- 20.5%Never married
- 65.9%Now married
- 0.0%Separated
- 0.0%Widowed
- 13.6%Divorced
Women who did not give birth in the past 12 months
| Now married: | 49.4% (153) |
| Unmarried: | 50.6% (157) |
Marital status - Two or more races population 15 years and over
- Males
- 51.5%Never married
- 35.0%Now married
- 0.0%Separated
- 1.8%Widowed
- 11.7%Divorced
- Females
- 58.7%Never married
- 35.1%Now married
- 0.0%Separated
- 0.0%Widowed
- 6.1%Divorced
Women who did not give birth in the past 12 months
| Now married: | 37.8% (232) |
| Unmarried: | 62.2% (381) |
Marital status - White alone, not Hispanic / Latino population 15 years and over
- Males
- 37.1%Never married
- 50.2%Now married
- 0.9%Separated
- 1.9%Widowed
- 9.9%Divorced
- Females
- 33.9%Never married
- 46.1%Now married
- 2.2%Separated
- 6.2%Widowed
- 11.6%Divorced
Women who gave birth in the past 12 months
| Now married: | 86.6% (286) |
| Unmarried: | 13.4% (44) |
Women who did not give birth in the past 12 months
| Now married: | 40.2% (2,741) |
| Unmarried: | 59.8% (4,077) |
Marital status - Hispanic or Latino population 15 years and over
- Males
- 37.5%Never married
- 52.6%Now married
- 0.0%Separated
- 0.0%Widowed
- 9.9%Divorced
- Females
- 26.9%Never married
- 62.1%Now married
- 0.0%Separated
- 0.2%Widowed
- 10.7%Divorced
Women who did not give birth in the past 12 months
| Now married: | 50.2% (167) |
| Unmarried: | 49.8% (166) |
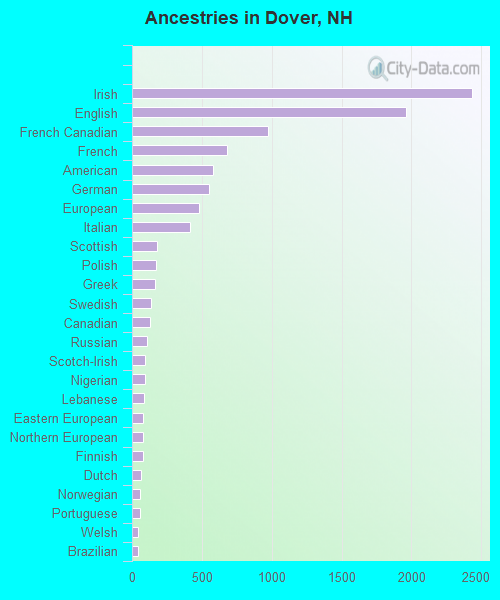
Ancestries in Dover

- 2,43319.9%Irish
- 1,96016.0%English
- 9727.9%French Canadian
- 6805.5%French
- 5774.7%American
- 5484.5%German
- 4823.9%European
- 4123.4%Italian
- 1821.5%Scottish
- 1691.4%Polish
- 1651.3%Greek
- 1391.1%Swedish
- 1301.1%Canadian
- 1060.9%Russian
- 940.8%Scotch-Irish
- 910.7%Nigerian
- 840.7%Lebanese
- 780.6%Eastern European
- 770.6%Northern European
- 770.6%Finnish
- 620.5%Dutch
- 550.4%Norwegian
- 540.4%Portuguese
- 410.3%Welsh
- 400.3%Brazilian
- 380.3%West Indian
- 380.3%Jamaican
- 300.2%African
- 250.2%Ukrainian
- 150.1%British
- 140.1%Basque
- 140.1%Hungarian
- 130.1%Swiss
- 100.08%Austrian
- 100.08%Danish
- 90.07%Lithuanian
- 70.06%Scandinavian
- 70.06%Celtic
- 70.06%Haitian
- 60.05%Albanian
- 50.04%Sudanese
- 10.01%Armenian
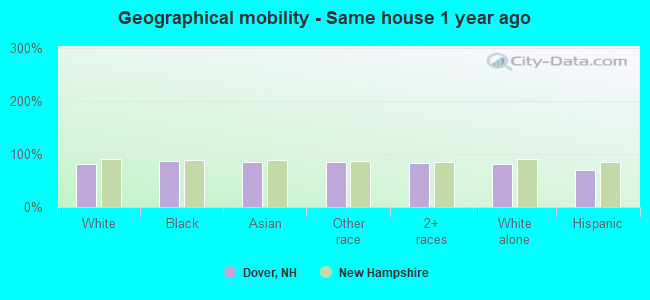
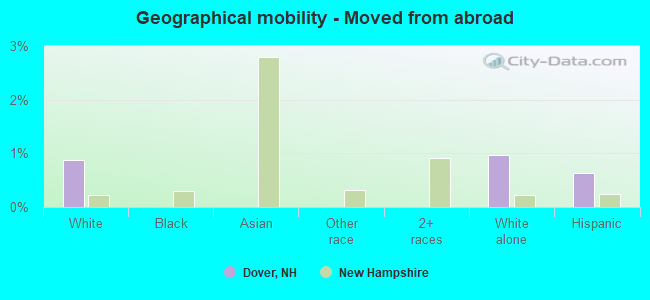
Geographical mobility in Dover

- Same house 1 year ago
- 23,49282.0%White (Caucasian)
- 34186.1%Black or African American
- 1,06984.0%Asian
- 55785.6%Other race
- 1,46683.8%Two or more races
- 22,98481.8%White alone, not Hispanic / Latino
- 1,00570.6%Hispanic or Latino
-
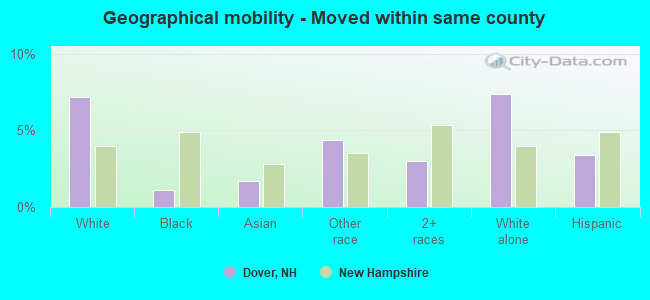
- Moved within same county
- 2,0577.2%White / Caucasian
- 41.1%Black or African American
- 211.7%Asian
- 284.4%Other race
- 533.0%Two or more races
- 2,0617.3%White alone, not Hispanic / Latino
- 483.4%Hispanic or Latino
-
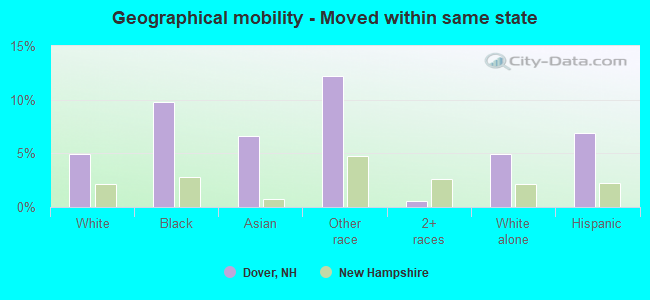
- Moved within same state
- 1,4084.9%White / Caucasian
- 399.8%Black or African American
- 846.6%Asian
- 7912.2%Other race
- 100.6%Two or more races
- 1,3925.0%White alone, not Hispanic / Latino
- 986.9%Hispanic or Latino
-
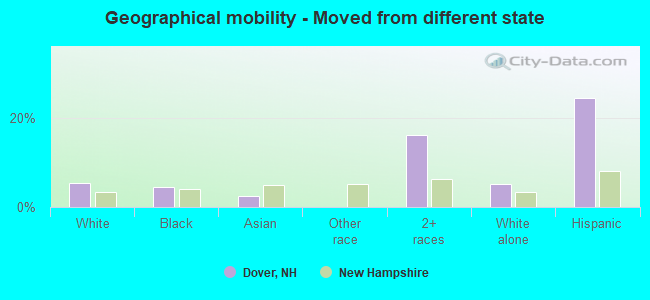
- Moved from different state
- 1,5105.3%White / Caucasian
- 184.5%Black or African American
- 312.4%Asian
- 28116.0%Two or more races
- 1,4665.2%White alone, not Hispanic / Latino
- 34724.3%Hispanic or Latino
-
- Moved from abroad
- 2500.9%White
- 2741.0%White alone, not Hispanic / Latino
- 90.6%Hispanic or Latino
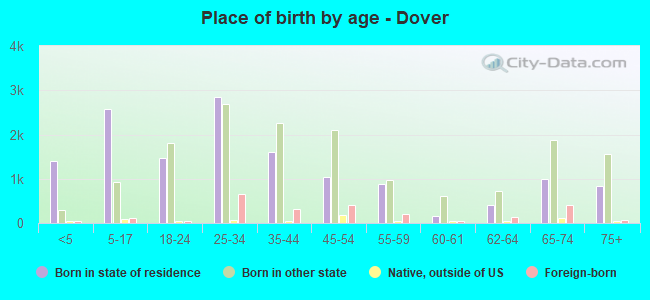
Children Nativity (place of birth) in Dover
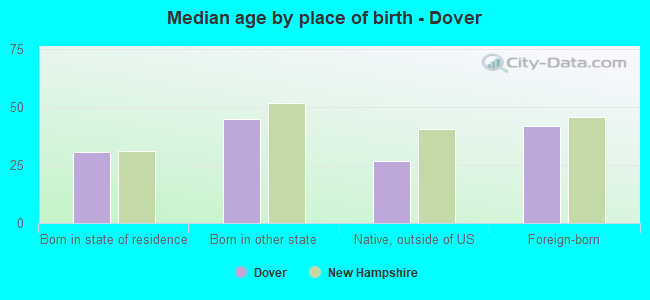
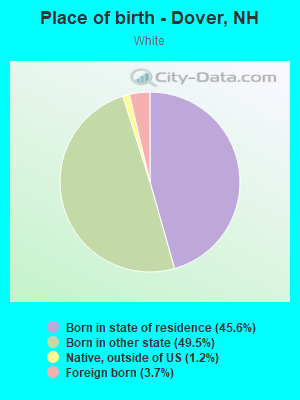
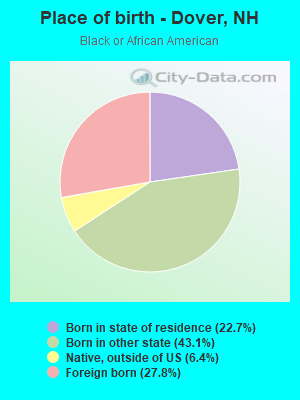
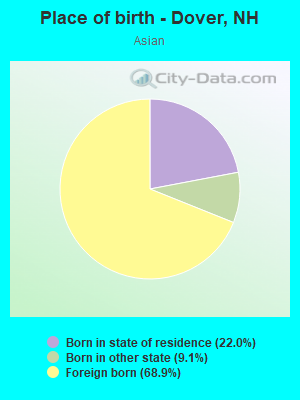
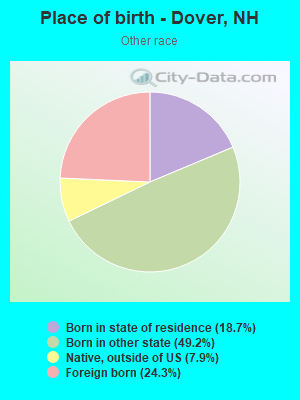
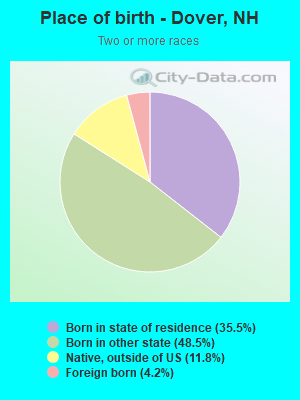
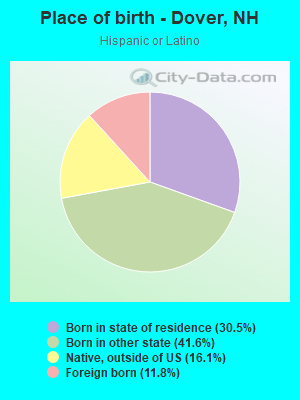
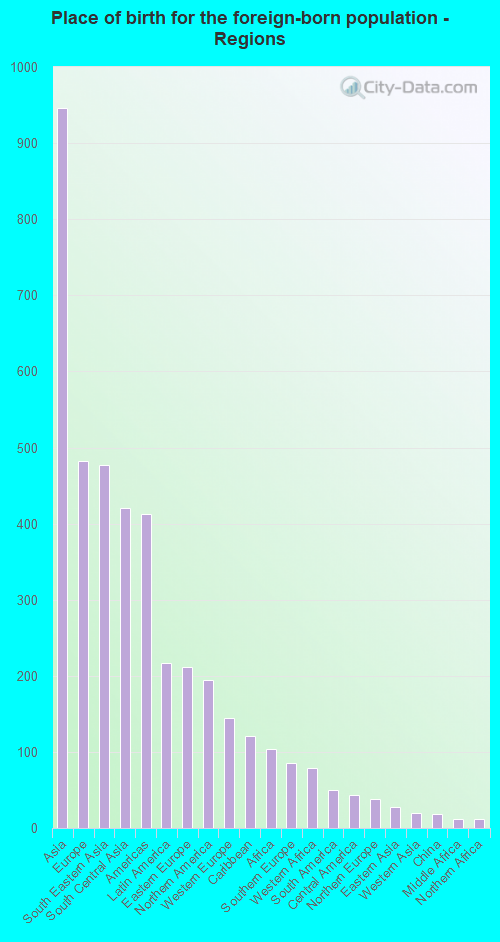
Place of birth for residents in Dover
![Place of birth for the foreign-born population - Regions]()
- 946Asia
- 482Europe
- 477South Eastern Asia
- 421South Central Asia
- 412Americas
- 217Latin America
- 212Eastern Europe
- 194Northern America
- 144Western Europe
- 121Caribbean
- 104Africa
- 86Southern Europe
- 79Western Africa
- 50South America
- 44Central America
- 38Northern Europe
- 27Eastern Asia
- 20Western Asia
- 18China
- 12Middle Africa
- 12Northern Africa
- 8Oceania
- 8Australia and New Zealand Subregion
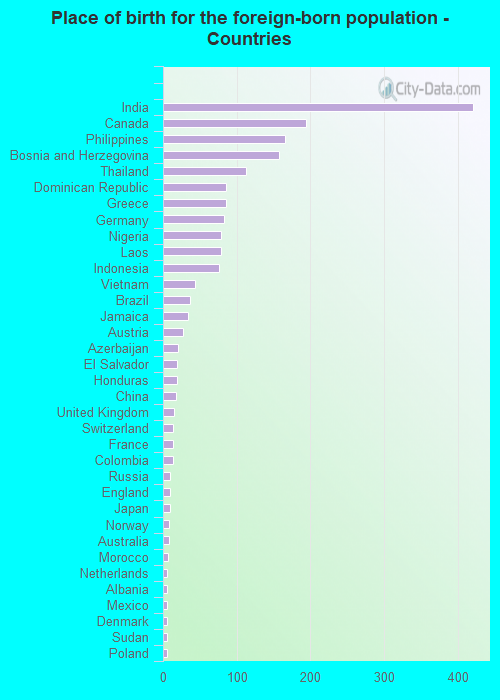
![Place of birth for the foreign-born population - Countries]()
- 421India
- 194Canada
- 166Philippines
- 157Bosnia and Herzegovina
- 112Thailand
- 86Dominican Republic
- 86Greece
- 83Germany
- 79Nigeria
- 78Laos
- 76Indonesia
- 43Vietnam
- 37Brazil
- 34Jamaica
- 27Austria
- 20Azerbaijan
- 19El Salvador
- 19Honduras
- 18China
- 15United Kingdom
- 14Switzerland
- 13France
- 13Colombia
- 10Russia
- 9England
- 9Japan
- 8Norway
- 8Australia
- 7Morocco
- 6Netherlands
- 6Albania
- 6Mexico
- 6Denmark
- 5Sudan
- 5Poland
Grandparents responsible for own grandchildren in Dover
Zip codes: 03820.