Races in Doylestown, Pennsylvania (PA) Detailed Stats
Ancestries, Foreign-born residents, place of birth
Settings
X


Recent posts about races in Doylestown, Pennsylvania on our local forum with over 2,400,000 registered users:
 | Retirement Move from Newton, MA to PA (Philly Suburbs) (73 replies) |
| Moving to the Philadelphia area! (31 replies) |
| Newtown, Doylestown, or Yardley? (19 replies) |
| Are couples with young kids still leaving Philly? (109 replies) |
| What do middle-aged couples do for fun in the greater Philadelphia area? (34 replies) |
| Bucks/MontCo too many options, help narrow down (18 replies) |
Latest news about races in Doylestown, PA collected exclusively by city-data.com from local newspapers, TV, and radio stations
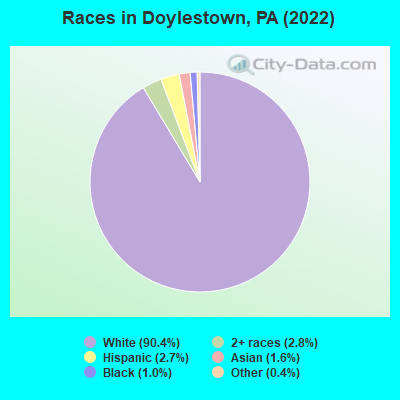
According to 2022 data, the most numerous races in Doylestown, PA are White alone (7,504 residents), Black alone (80 residents), and Hispanic (227 residents). 92.3% of Doylestown residents speak English at home. 7.7% of Doylestown, PA residents are foreign-born (5.2% born in Europe, 1.2% born in Asia, 0.9% born in Latin America), which is 9.2% greater than the foreign-born rate of 7.0% across the entire state of Pennsylvania.
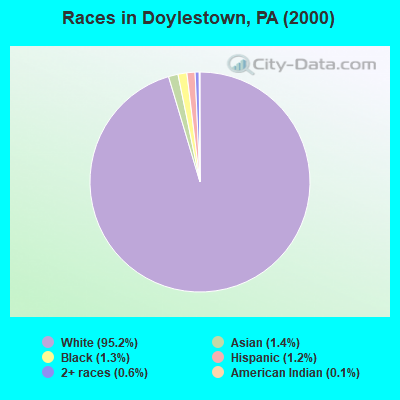
Race distribution in Doylestown
2000
2022

- 7,83495.2%White alone
- 1161.4%Asian alone
- 1051.3%Black alone
- 991.2%Hispanic
- 500.6%Two or more races
- 80.10%Other race alone
- 90.1%American Indian alone
- 60.07%Native Hawaiian and Other
Pacific Islander alone
-
- 7,50490.4%White alone
- 2362.8%Two or more races
- 2272.7%Hispanic
- 1361.6%Asian alone
- 801.0%Black alone
- 340.4%Other race alone
2000
2022
-
- 10,322,45584.1%White alone
- 1,202,4379.8%Black alone
- 394,0883.2%Hispanic
- 218,2961.8%Asian alone
- 113,0970.9%Two or more races
- 13,0860.1%Other race alone
- 14,9040.1%American Indian alone
- 2,6910.02%Native Hawaiian and Other
Pacific Islander alone

-
- 9,487,22873.1%White alone
- 1,311,58110.1%Black alone
- 1,115,9978.6%Hispanic
- 493,9423.8%Two or more races
- 487,1243.8%Asian alone
- 63,5820.5%Other race alone
- 10,1300.08%American Indian alone
- 2,4240.02%Native Hawaiian and Other
Pacific Islander alone

Income and house value in Doylestown
- Median household income in 2022
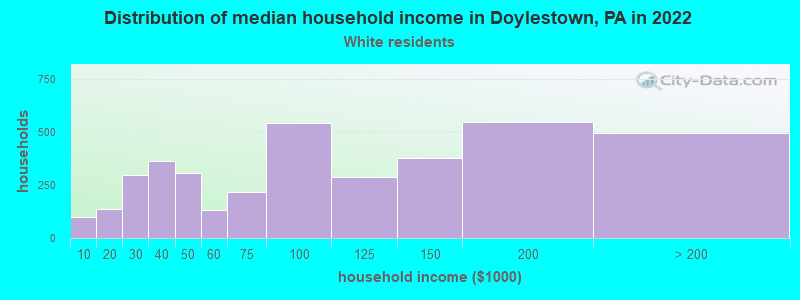
- $92,282White non-Hispanic householders
- $79,743Some other race householders
- $70,789Two or more races householders
- $112,284Hispanic or Latino race householders
- Median 2022 house value
- $531,691White Non-Hispanic householders
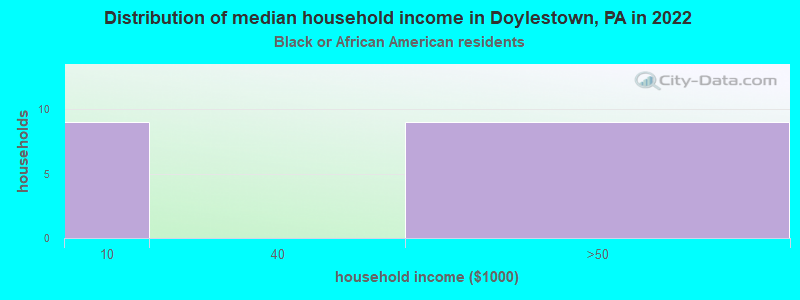
- $531,103Black or African American householders
- $661,307American Indian or Alaska Native householders
- $249,827Asian householders
- $330,653Two or more races householders
- over $1,000,000Hispanic or Latino householders
Household income for White non-Hispanic householders
Household income for Black householders
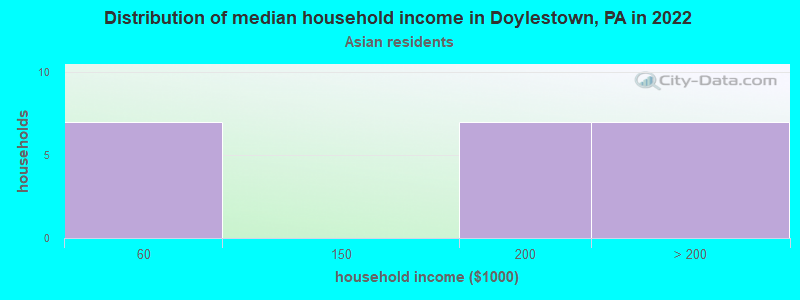
Household income for Asian householders
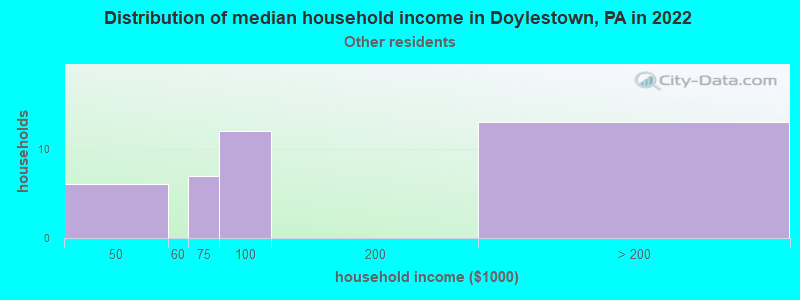
Household income for Some other race householders
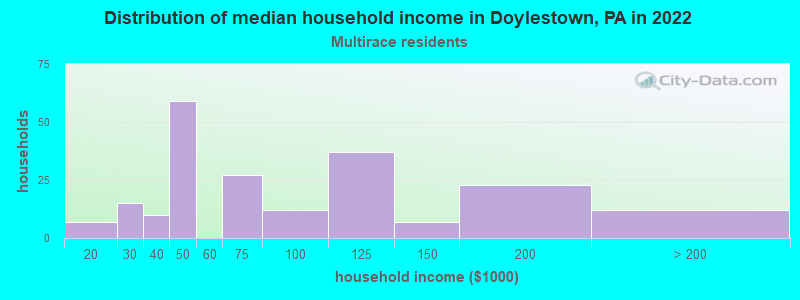
Household income for Two or more races householders
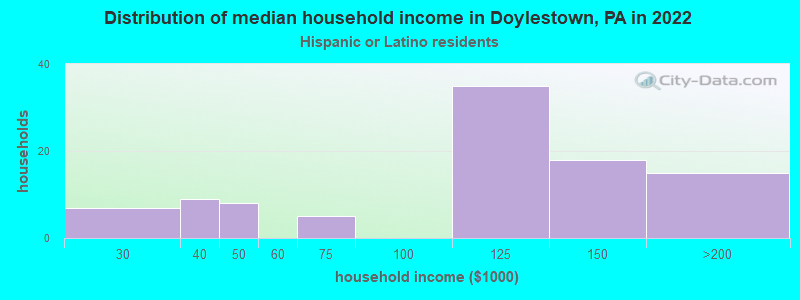
Household income for Hispanic or Latino race householders
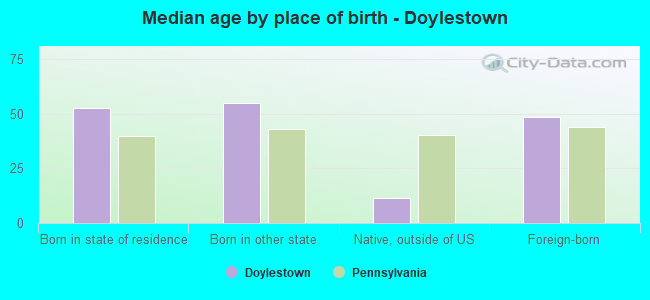
Median age by race in Doylestown
- 53.8Median age for White residents
- 52.0Males
- 55.5Females
- 63.8Median age for Black or African American residents
- 82.0Males
- 32.7Females
- -674,382,715.4Median age for American Indian / Alaska Native residents
- -668,138,336.3Males
- -858,283,432.3Females
- 44.6Median age for Asian residents
- 37.7Males
- 44.8Females
- -680,432,644.4Median age for Native Hawaiian / Pacific Islander residents
- -649,523,808.9Males
- -747,474,746.7Females
- 26.9Median age for Other race residents
- -598,837,208.7Males
- 26.4Females
- 35.5Median age for Two or more races residents
- 51.2Males
- 34.5Females
- 54.1Median age for White alone residents
- 51.8Males
- 55.5Females
- 30.8Median age for Hispanic or Latino residents
- 42.9Males
- 29.0Females
Owner/renter occupied households by race in Doylestown
- House owners and renters - White residents
- 1,96852.1%Owner occupied
- 1,81147.9%Renter occupied
- House owners and renters - Black or African American residents
- 16100.0%Renter occupied
- House owners and renters - Asian residents
- 1356.0%Owner occupied
- 1044.0%Renter occupied
- House owners and renters - Other race residents
- 2369.1%Owner occupied
- 1030.9%Renter occupied
- House owners and renters - Two or more races residents
- 9040.7%Owner occupied
- 13159.3%Renter occupied
- House owners and renters - White alone residents
- 1,98151.8%Owner occupied
- 1,84548.2%Renter occupied
- House owners and renters - Hispanic or Latino residents
- 6563.7%Owner occupied
- 3736.3%Renter occupied
Language usage in Doylestown
- English speakers - Total
- 92.3% of residents of Doylestown speak English at home.
- 2.0% of residents speak Spanish at home
- 9055.6%Speak English very well
- 7244.4%Speak English less than very well
- 5.4% of residents speak other language at home
- 28165.2%Speak English very well
- 15034.8%Speak English less than very well
- English speakers - Born in the United States
- 94.8% of residents of Doylestown speak English at home.
- 1.6% of residents speak Spanish at home
- 44100.0%Speak English very well
- 3.3% of residents speak other language at home
- 8593.4%Speak English very well
- 66.6%Speak English less than very well
- English speakers - Native, born elsewhere
- 64.4% of residents of Doylestown speak English at home.
- 6.7% of residents speak Spanish at home
- 6100.0%Speak English very well
- 32.2% of residents speak other language at home
- 29100.0%Speak English very well
- English speakers - Foreign-born
- 53.8% of residents of Doylestown speak English at home.
- 11.0% of residents speak Spanish at home
- 70100.0%Speak English less than very well
- 31.8% of residents speak other language at home
- 7536.9%Speak English very well
- 12863.1%Speak English less than very well
White (Caucasian) - Speak only English
| Native: | 97.1% (6,583) |
| Foreign-born: | 71.3% (278) |
White (Caucasian) - Speak another language
| Native: | 2.7% (186) |
| Foreign-born: | 26.6% (103) |
Black or African American - Speak another language
| Native: | 25.9% (20) |
| Foreign-born: | 100.0% (6) |
Asian - Speak only English
| Native: | 70.4% (23) |
| Foreign-born: | 34.5% (31) |
Asian - Speak another language
| Native: | 31.6% (10) |
| Foreign-born: | 66.0% (59) |
Other race - Speak another language
| Native: | 15.1% (10) |
| Foreign-born: | 88.4% (56) |
Two or more races - Speak another language
| Native: | 11.1% (36) |
| Foreign-born: | 100.0% (44) |
White alone - Speak only English
| Native: | 96.7% (6,599) |
| Foreign-born: | 68.0% (279) |
White alone - Speak another language
| Native: | 3.1% (215) |
| Foreign-born: | 27.0% (111) |
Hispanic or Latino - Speak another language
| Native: | 20.6% (26) |
| Foreign-born: | 91.7% (72) |
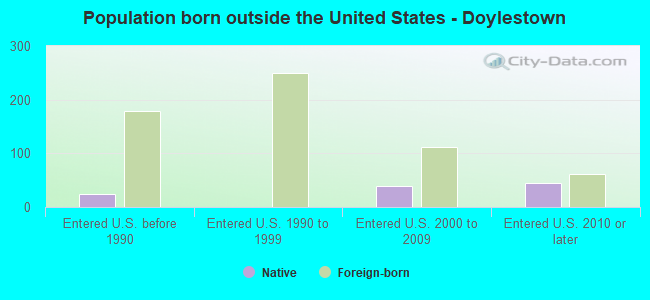
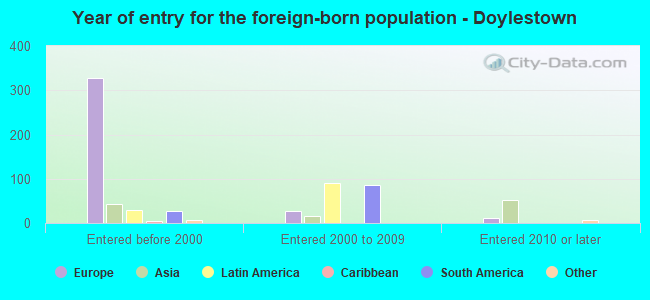
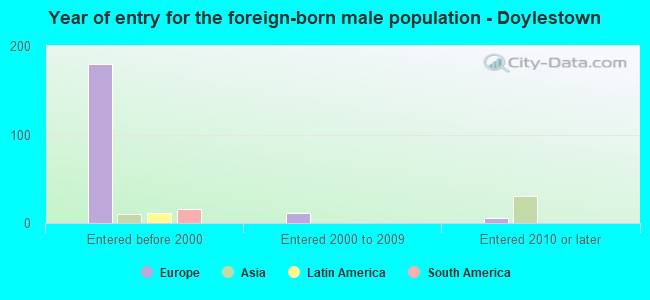
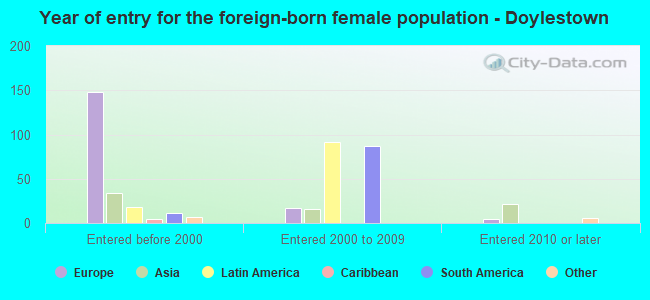
Foreign-born residents in Doylestown
640 residents are foreign born (5.2% Europe, 1.2% Asia, 0.9% Latin America).
| This city: | 7.7% |
| Pennsylvania: | 7.3% |

Marital status for residents in Doylestown
Marital status - White (Caucasian) population 15 years and over
- Males
- 26.8%Never married
- 50.0%Now married
- 1.8%Separated
- 4.9%Widowed
- 16.5%Divorced
- Females
- 25.2%Never married
- 40.7%Now married
- 2.0%Separated
- 14.8%Widowed
- 17.4%Divorced
Women who gave birth in the past 12 months
| Now married: | 85.5% (56) |
| Unmarried: | 14.5% (10) |
Women who did not give birth in the past 12 months
| Now married: | 34.4% (429) |
| Unmarried: | 65.6% (817) |
Marital status - Black or African American population 15 years and over
- Males
- 85.2%Never married
- 14.8%Now married
- 0.0%Separated
- 0.0%Widowed
- 0.0%Divorced
- Females
- 81.5%Never married
- 0.0%Now married
- 0.0%Separated
- 18.5%Widowed
- 0.0%Divorced
Women who did not give birth in the past 12 months
| Now married: | 0.0% (0) |
| Unmarried: | 100.0% (32) |
Marital status - Asian population 15 years and over
- Males
- 0.0%Never married
- 81.8%Now married
- 0.0%Separated
- 0.0%Widowed
- 18.2%Divorced
- Females
- 23.7%Never married
- 66.1%Now married
- 0.0%Separated
- 10.2%Widowed
- 0.0%Divorced
Women who did not give birth in the past 12 months
| Now married: | 53.3% (17) |
| Unmarried: | 46.7% (15) |
Marital status - Two or more races population 15 years and over
- Males
- 0.0%Never married
- 69.7%Now married
- 6.7%Separated
- 0.0%Widowed
- 23.6%Divorced
- Females
- 55.5%Never married
- 35.5%Now married
- 4.5%Separated
- 0.0%Widowed
- 4.5%Divorced
Women who did not give birth in the past 12 months
| Now married: | 24.1% (26) |
| Unmarried: | 75.9% (80) |
Marital status - White alone, not Hispanic / Latino population 15 years and over
- Males
- 26.6%Never married
- 50.0%Now married
- 1.9%Separated
- 4.9%Widowed
- 16.7%Divorced
- Females
- 25.2%Never married
- 40.7%Now married
- 2.0%Separated
- 14.8%Widowed
- 17.4%Divorced
Women who gave birth in the past 12 months
| Now married: | 85.5% (57) |
| Unmarried: | 14.5% (10) |
Women who did not give birth in the past 12 months
| Now married: | 34.4% (433) |
| Unmarried: | 65.6% (826) |
Marital status - Hispanic or Latino population 15 years and over
- Males
- 15.5%Never married
- 66.7%Now married
- 0.0%Separated
- 0.0%Widowed
- 17.9%Divorced
- Females
- 62.4%Never married
- 31.8%Now married
- 5.9%Separated
- 0.0%Widowed
- 0.0%Divorced
Women who did not give birth in the past 12 months
| Now married: | 24.3% (19) |
| Unmarried: | 75.7% (59) |
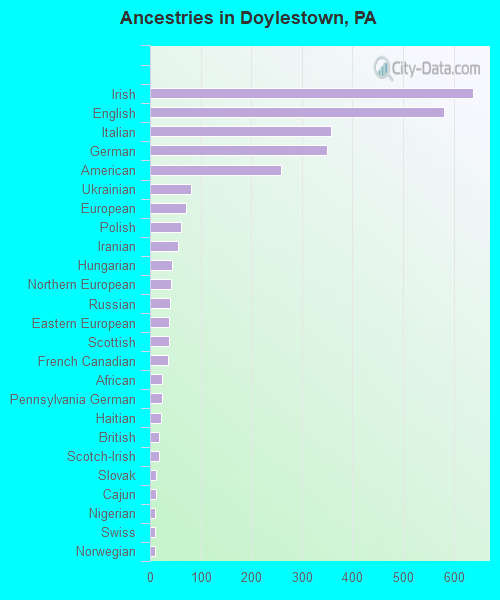
Ancestries in Doylestown

- 63820.0%Irish
- 58018.2%English
- 35711.2%Italian
- 35011.0%German
- 2588.1%American
- 812.5%Ukrainian
- 722.3%European
- 621.9%Polish
- 551.7%Iranian
- 431.4%Hungarian
- 411.3%Northern European
- 391.2%Russian
- 381.2%Eastern European
- 371.2%Scottish
- 351.1%French Canadian
- 240.8%African
- 230.7%Pennsylvania German
- 220.7%Haitian
- 180.6%British
- 180.6%Scotch-Irish
- 120.4%Slovak
- 110.3%Cajun
- 100.3%Nigerian
- 100.3%Swiss
- 90.3%Norwegian
- 60.2%Slovene
- 60.2%Jamaican
- 50.2%Belgian
- 50.2%Romanian
- 50.2%Welsh
- 40.1%Scandinavian
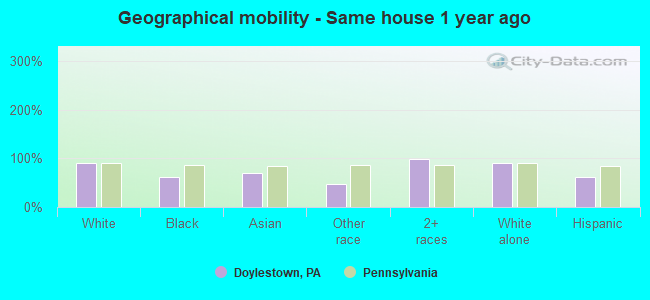
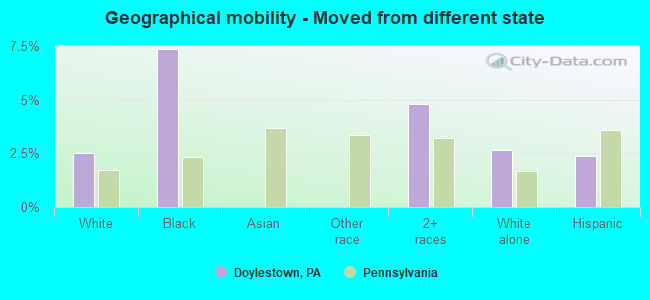
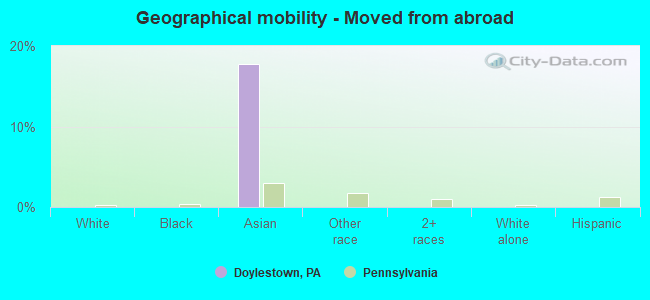
Geographical mobility in Doylestown

- Same house 1 year ago
- 6,62389.4%White (Caucasian)
- 5060.9%Black or African American
- 9569.3%Asian
- 5546.7%Other race
- 34998.5%Two or more races
- 6,66789.4%White alone, not Hispanic / Latino
- 14162.2%Hispanic or Latino
-
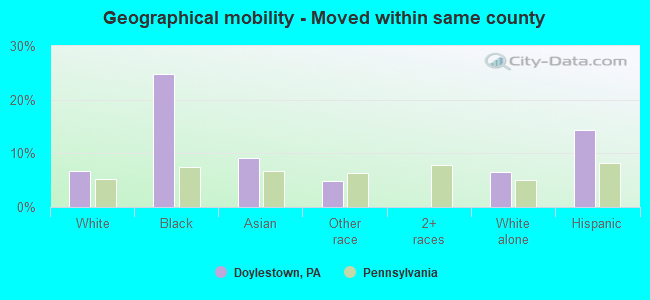
- Moved within same county
- 4996.7%White / Caucasian
- 2024.7%Black or African American
- 129.1%Asian
- 64.8%Other race
- 4926.6%White alone, not Hispanic / Latino
- 3314.4%Hispanic or Latino
-
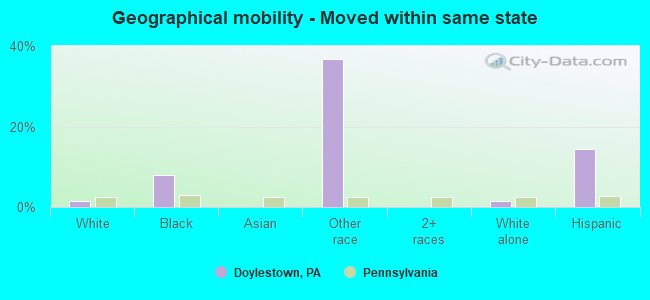
- Moved within same state
- 1071.4%White / Caucasian
- 78.0%Black or African American
- 4336.8%Other race
- 1091.5%White alone, not Hispanic / Latino
- 3314.5%Hispanic or Latino
-
- Moved from different state
- 1862.5%White / Caucasian
- 67.3%Black or African American
- 174.8%Two or more races
- 1992.7%White alone, not Hispanic / Latino
- 52.4%Hispanic or Latino
-
- Moved from abroad
- 2417.8%Asian
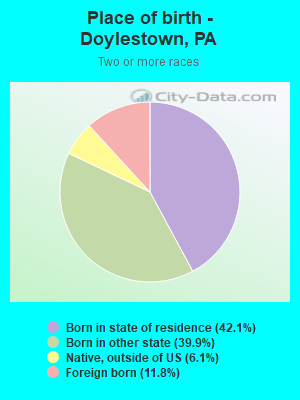
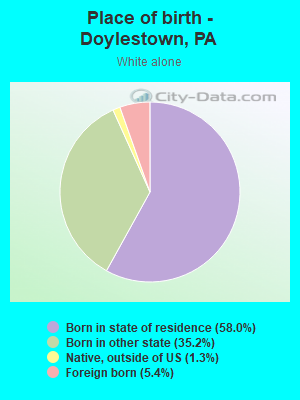
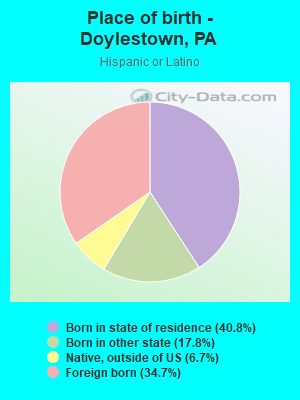
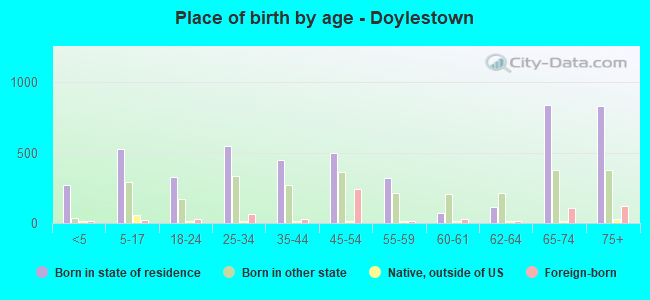
Children Nativity (place of birth) in Doylestown
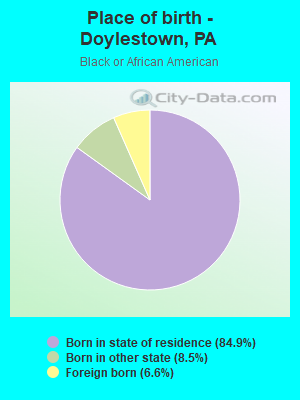
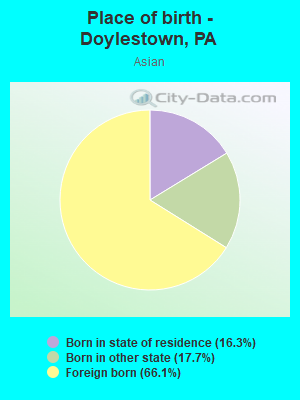
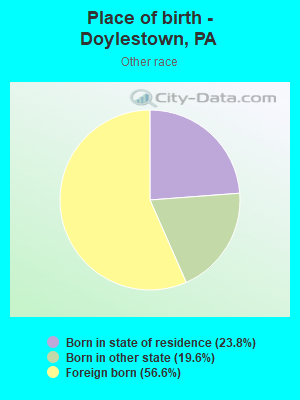
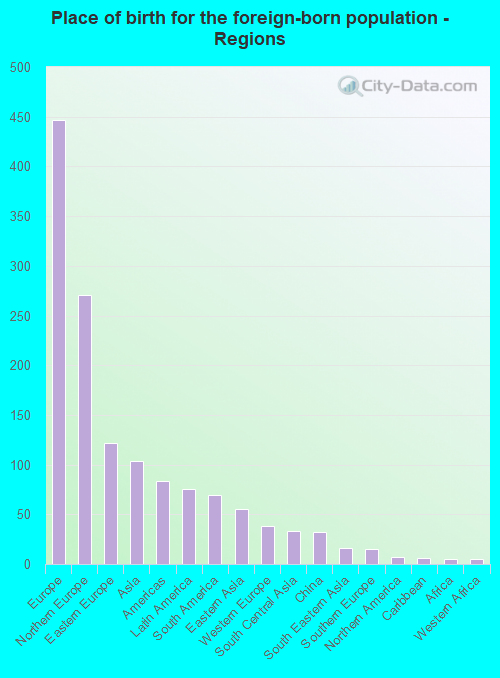
Place of birth for residents in Doylestown
![Place of birth for the foreign-born population - Regions]()
- 447Europe
- 271Northern Europe
- 122Eastern Europe
- 104Asia
- 83Americas
- 75Latin America
- 69South America
- 55Eastern Asia
- 38Western Europe
- 33South Central Asia
- 32China
- 16South Eastern Asia
- 15Southern Europe
- 7Northern America
- 6Caribbean
- 5Africa
- 5Western Africa
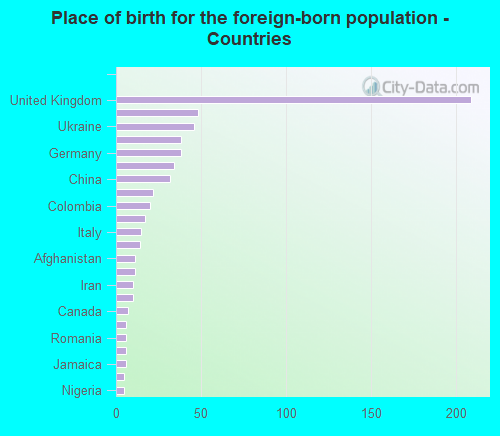
![Place of birth for the foreign-born population - Countries]()
- 209United Kingdom
- 48Peru
- 46Ukraine
- 38England
- 38Germany
- 34Hungary
- 32China
- 22Korea
- 20Colombia
- 17Ireland
- 15Italy
- 14Russia
- 11Afghanistan
- 11India
- 10Iran
- 10Philippines
- 7Canada
- 6Latvia
- 6Romania
- 6Vietnam
- 6Jamaica
- 5Scotland
- 5Nigeria
Grandparents responsible for own grandchildren in Doylestown
Zip codes: 18901.