Races in Dranesville, Virginia (VA) Detailed Stats
Data:
Races - White alone (%)
Races - White alone (% change since 2000)
Races - Black alone (%)
Races - Black alone (% change since 2000)
Races - American Indian alone (%)
Races - American Indian alone (% change since 2000)
Races - Asian alone (%)
Races - Asian alone (% change since 2000)
Races - Hispanic (%)
Races - Hispanic (% change since 2000)
Races - Native Hawaiian and Other Pacific Islander alone (%)
Races - Native Hawaiian and Other Pacific Islander alone (% change since 2000)
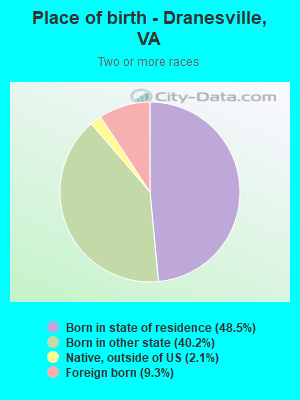
Races - Two or more races(%)
Races - Two or more races(% change since 2000)
Races - Other race alone (%)
Races - Other race alone (% change since 2000)
Racial diversity
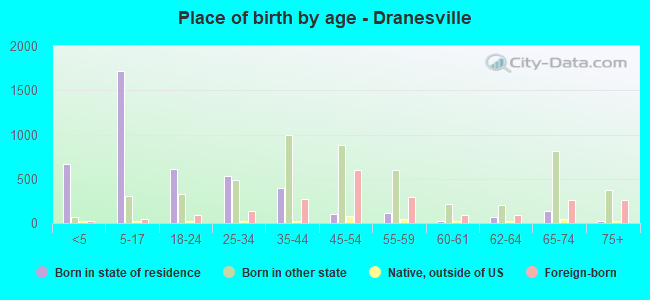
Place of birth - Born in state of residence (%)
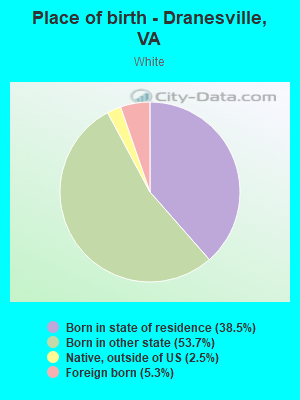
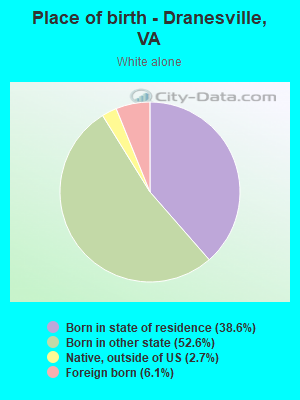
Place of birth - Born in state of residence (%) - White
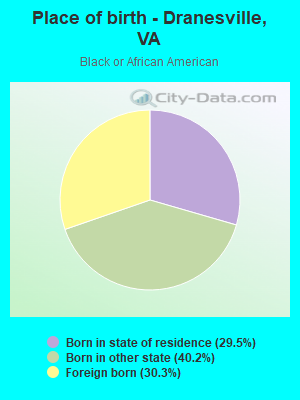
Place of birth - Born in state of residence (%) - Black or African American
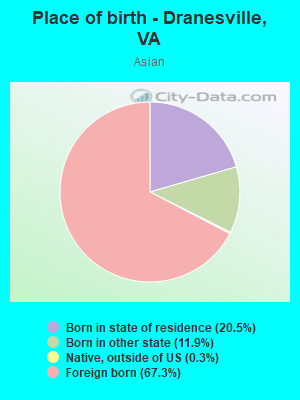
Place of birth - Born in state of residence (%) - Asian
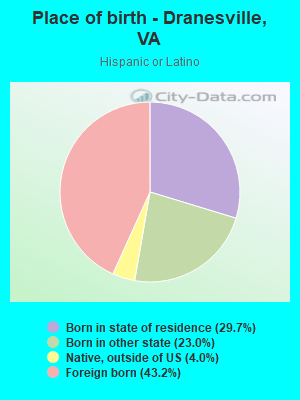
Place of birth - Born in state of residence (%) - Hispanic or Latino
Place of birth - Born in state of residence (%) - American Indian and Alaska Native
Place of birth - Born in state of residence (%) - Multirace
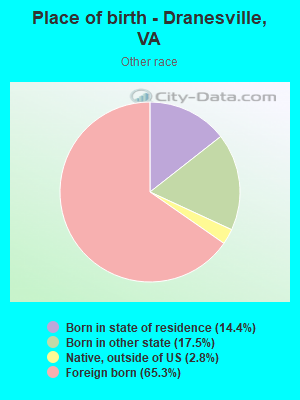
Place of birth - Born in state of residence (%) - Other Race
Place of birth - Born in other state (%)
Place of birth - Born in other state (%) - White
Place of birth - Born in other state (%) - Black or African American
Place of birth - Born in other state (%) - Asian
Place of birth - Born in other state (%) - Hispanic or Latino
Place of birth - Born in other state (%) - American Indian and Alaska Native
Place of birth - Born in other state (%) - Multirace
Place of birth - Born in other state (%) - Other Race
Place of birth - Native, outside of US (%)
Place of birth - Native, outside of US (%) - White
Place of birth - Native, outside of US (%) - Black or African American
Place of birth - Native, outside of US (%) - Asian
Place of birth - Native, outside of US (%) - Hispanic or Latino
Place of birth - Native, outside of US (%) - American Indian and Alaska Native
Place of birth - Native, outside of US (%) - Multirace
Place of birth - Native, outside of US (%) - Other Race
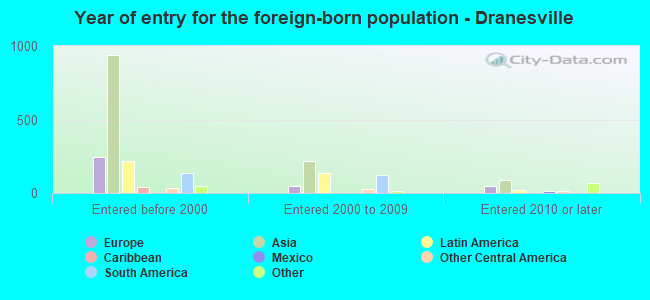
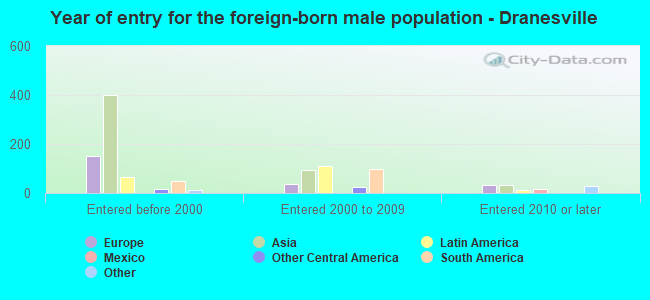
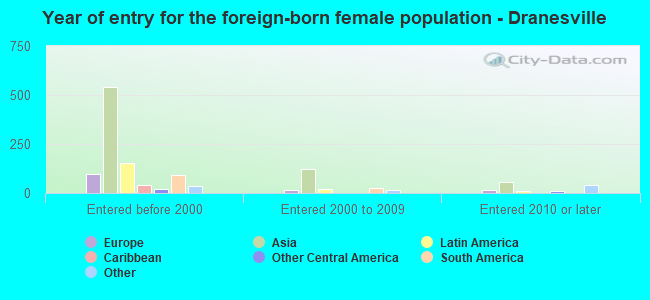
Place of birth - Foreign born (%)
Place of birth - Foreign born (%) - White
Place of birth - Foreign born (%) - Black or African American
Place of birth - Foreign born (%) - Asian
Place of birth - Foreign born (%) - Hispanic or Latino
Place of birth - Foreign born (%) - American Indian and Alaska Native
Place of birth - Foreign born (%) - Multirace
Place of birth - Foreign born (%) - Other Race
Residents speaking English at home (%)
Residents speaking English at home - Born in the United States (%)
Residents speaking English at home - Native, born elsewhere (%)
Residents speaking English at home - Foreign born (%)
Residents speaking Spanish at home (%)
Residents speaking Spanish at home - Born in the United States (%)
Residents speaking Spanish at home - Native, born elsewhere (%)
Residents speaking Spanish at home - Foreign born (%)
Residents speaking other language at home (%)
Residents speaking other language at home - Born in the United States (%)
Residents speaking other language at home - Native, born elsewhere (%)
Residents speaking other language at home - Foreign born (%)
Marital status - Never married (%)
Marital status - Now married (%)
Marital status - Separated (%)
Marital status - Widowed (%)
Marital status - Divorced (%)
Ancestries Reported - Arab (%)
Ancestries Reported - Czech (%)
Ancestries Reported - Danish (%)
Ancestries Reported - Dutch (%)
Ancestries Reported - English (%)
Ancestries Reported - French (%)
Ancestries Reported - French Canadian (%)
Ancestries Reported - German (%)
Ancestries Reported - Greek (%)
Ancestries Reported - Hungarian (%)
Ancestries Reported - Irish (%)
Ancestries Reported - Italian (%)
Ancestries Reported - Lithuanian (%)
Ancestries Reported - Norwegian (%)
Ancestries Reported - Polish (%)
Ancestries Reported - Portuguese (%)
Ancestries Reported - Russian (%)
Ancestries Reported - Scotch-Irish (%)
Ancestries Reported - Scottish (%)
Ancestries Reported - Slovak (%)
Ancestries Reported - Subsaharan African (%)
Ancestries Reported - Swedish (%)
Ancestries Reported - Swiss (%)
Ancestries Reported - Ukrainian (%)
Ancestries Reported - United States (%)
Ancestries Reported - Welsh (%)
Ancestries Reported - West Indian (%)
Ancestries Reported - Other (%)
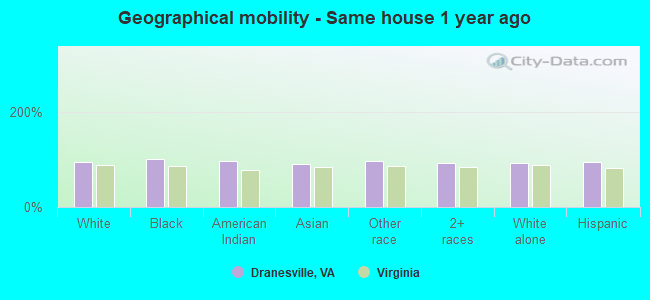
Geographical mobility - Same house 1 year ago (%)
Geographical mobility - Same house 1 year ago (%) - White
Geographical mobility - Same house 1 year ago (%) - Black or African American
Geographical mobility - Same house 1 year ago (%) - Asian
Geographical mobility - Same house 1 year ago (%) - Hispanic or Latino
Geographical mobility - Same house 1 year ago (%) - American Indian and Alaska Native
Geographical mobility - Same house 1 year ago (%) - Multirace
Geographical mobility - Same house 1 year ago (%) - Other Race
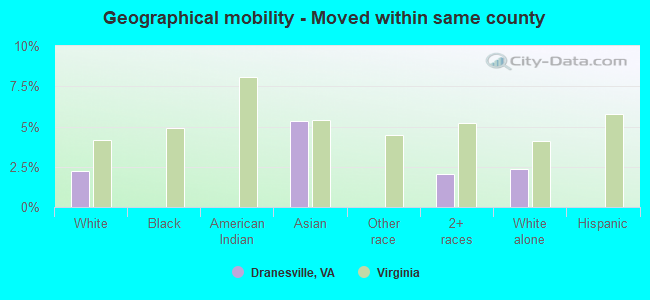
Geographical mobility - Moved within same county (%)
Geographical mobility - Moved within same county (%) - White
Geographical mobility - Moved within same county (%) - Black or African American
Geographical mobility - Moved within same county (%) - Asian
Geographical mobility - Moved within same county (%) - Hispanic or Latino
Geographical mobility - Moved within same county (%) - American Indian and Alaska Native
Geographical mobility - Moved within same county (%) - Multirace
Geographical mobility - Moved within same county (%) - Other Race
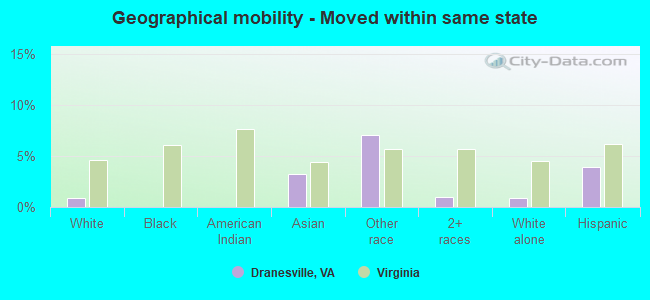
Geographical mobility - Moved from different county within same state (%)
Geographical mobility - Moved from different county within same state (%) - White
Geographical mobility - Moved from different county within same state (%) - Black or African American
Geographical mobility - Moved from different county within same state (%) - Asian
Geographical mobility - Moved from different county within same state (%) - Hispanic or Latino
Geographical mobility - Moved from different county within same state (%) - American Indian and Alaska Native
Geographical mobility - Moved from different county within same state (%) - Multirace
Geographical mobility - Moved from different county within same state (%) - Other Race
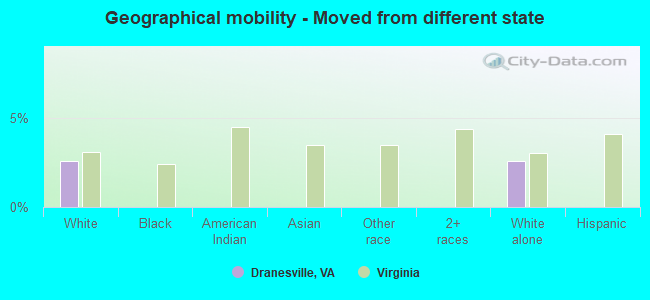
Geographical mobility - Moved from different state (%)
Geographical mobility - Moved from different state (%) - White
Geographical mobility - Moved from different state (%) - Black or African American
Geographical mobility - Moved from different state (%) - Asian
Geographical mobility - Moved from different state (%) - Hispanic or Latino
Geographical mobility - Moved from different state (%) - American Indian and Alaska Native
Geographical mobility - Moved from different state (%) - Multirace
Geographical mobility - Moved from different state (%) - Other Race
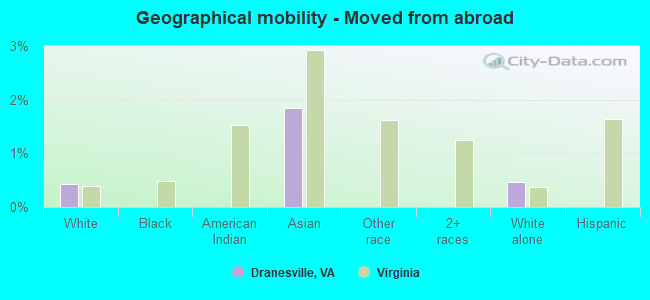
Geographical mobility - Moved from abroad (%)
Geographical mobility - Moved from abroad (%) - White
Geographical mobility - Moved from abroad (%) - Black or African American
Geographical mobility - Moved from abroad (%) - Asian
Geographical mobility - Moved from abroad (%) - Hispanic or Latino
Geographical mobility - Moved from abroad (%) - American Indian and Alaska Native
Geographical mobility - Moved from abroad (%) - Multirace
Geographical mobility - Moved from abroad (%) - Other Race
Place of birth for the foreign-born population - Ireland (%)
Place of birth for the foreign-born population - Denmark (%)
Place of birth for the foreign-born population - Norway (%)
Place of birth for the foreign-born population - Sweden (%)
Place of birth for the foreign-born population - United Kingdom (%)
Place of birth for the foreign-born population - England (%)
Place of birth for the foreign-born population - Scotland (%)
Place of birth for the foreign-born population - Other Northern Europe (%)
Place of birth for the foreign-born population - Austria (%)
Place of birth for the foreign-born population - Belgium (%)
Place of birth for the foreign-born population - France (%)
Place of birth for the foreign-born population - Germany (%)
Place of birth for the foreign-born population - Netherlands (%)
Place of birth for the foreign-born population - Switzerland (%)
Place of birth for the foreign-born population - Other Western Europe (%)
Place of birth for the foreign-born population - Greece (%)
Place of birth for the foreign-born population - Italy (%)
Place of birth for the foreign-born population - Portugal (%)
Place of birth for the foreign-born population - Spain (%)
Place of birth for the foreign-born population - Other Southern Europe (%)
Place of birth for the foreign-born population - Albania (%)
Place of birth for the foreign-born population - Belarus (%)
Place of birth for the foreign-born population - Bosnia and Herzegovina (%)
Place of birth for the foreign-born population - Bulgaria (%)
Place of birth for the foreign-born population - Croatia (%)
Place of birth for the foreign-born population - Czechoslovakia (%)
Place of birth for the foreign-born population - Hungary (%)
Place of birth for the foreign-born population - Latvia (%)
Place of birth for the foreign-born population - Lithuania (%)
Place of birth for the foreign-born population - North Macedonia (Macedonia) (%)
Place of birth for the foreign-born population - Moldova (%)
Place of birth for the foreign-born population - Poland (%)
Place of birth for the foreign-born population - Romania (%)
Place of birth for the foreign-born population - Russia (%)
Place of birth for the foreign-born population - Serbia (%)
Place of birth for the foreign-born population - Ukraine (%)
Place of birth for the foreign-born population - Other Eastern Europe (%)
Place of birth for the foreign-born population - China (%)
Place of birth for the foreign-born population - Hong Kong (%)
Place of birth for the foreign-born population - Taiwan (%)
Place of birth for the foreign-born population - Japan (%)
Place of birth for the foreign-born population - Korea (%)
Place of birth for the foreign-born population - Other Eastern Asia (%)
Place of birth for the foreign-born population - Afghanistan (%)
Place of birth for the foreign-born population - Bangladesh (%)
Place of birth for the foreign-born population - India (%)
Place of birth for the foreign-born population - Iran (%)
Place of birth for the foreign-born population - Kazakhstan (%)
Place of birth for the foreign-born population - Nepal (%)
Place of birth for the foreign-born population - Pakistan (%)
Place of birth for the foreign-born population - Sri Lanka (%)
Place of birth for the foreign-born population - Uzbekistan (%)
Place of birth for the foreign-born population - Other South Central Asia (%)
Place of birth for the foreign-born population - Burma (%)
Place of birth for the foreign-born population - Cambodia (%)
Place of birth for the foreign-born population - Indonesia (%)
Place of birth for the foreign-born population - Laos (%)
Place of birth for the foreign-born population - Malaysia (%)
Place of birth for the foreign-born population - Philippines (%)
Place of birth for the foreign-born population - Singapore (%)
Place of birth for the foreign-born population - Thailand (%)
Place of birth for the foreign-born population - Vietnam (%)
Place of birth for the foreign-born population - Other South Eastern Asia (%)
Place of birth for the foreign-born population - Armenia (%)
Place of birth for the foreign-born population - Iraq (%)
Place of birth for the foreign-born population - Israel (%)
Place of birth for the foreign-born population - Jordan (%)
Place of birth for the foreign-born population - Kuwait (%)
Place of birth for the foreign-born population - Lebanon (%)
Place of birth for the foreign-born population - Saudi Arabia (%)
Place of birth for the foreign-born population - Syria (%)
Place of birth for the foreign-born population - Turkey (%)
Place of birth for the foreign-born population - Yemen (%)
Place of birth for the foreign-born population - Other Western Asia (%)
Place of birth for the foreign-born population - Eritrea (%)
Place of birth for the foreign-born population - Ethiopia (%)
Place of birth for the foreign-born population - Kenya (%)
Place of birth for the foreign-born population - Somalia (%)
Place of birth for the foreign-born population - Uganda (%)
Place of birth for the foreign-born population - Zimbabwe (%)
Place of birth for the foreign-born population - Other Eastern Africa (%)
Place of birth for the foreign-born population - Cameroon (%)
Place of birth for the foreign-born population - Congo (%)
Place of birth for the foreign-born population - Democratic Republic of Congo (Zaire) (%)
Place of birth for the foreign-born population - Other Middle Africa (%)
Place of birth for the foreign-born population - Egypt (%)
Place of birth for the foreign-born population - Morocco (%)
Place of birth for the foreign-born population - Sudan (%)
Place of birth for the foreign-born population - Other Northern Africa (%)
Place of birth for the foreign-born population - South Africa (%)
Place of birth for the foreign-born population - Other Southern Africa (%)
Place of birth for the foreign-born population - Cabo Verde (%)
Place of birth for the foreign-born population - Ghana (%)
Place of birth for the foreign-born population - Liberia (%)
Place of birth for the foreign-born population - Nigeria (%)
Place of birth for the foreign-born population - Senegal (%)
Place of birth for the foreign-born population - Sierra Leone (%)
Place of birth for the foreign-born population - Other Western Africa (%)
Place of birth for the foreign-born population - Australia (%)
Place of birth for the foreign-born population - New Zealand (%)
Place of birth for the foreign-born population - Fiji (%)
Place of birth for the foreign-born population - Micronesia (%)
Place of birth for the foreign-born population - Bahamas (%)
Place of birth for the foreign-born population - Barbados (%)
Place of birth for the foreign-born population - Cuba (%)
Place of birth for the foreign-born population - Dominica (%)
Place of birth for the foreign-born population - Dominican Republic (%)
Place of birth for the foreign-born population - Grenada (%)
Place of birth for the foreign-born population - Haiti (%)
Place of birth for the foreign-born population - Jamaica (%)
Place of birth for the foreign-born population - St. Vincent and the Grenadines (%)
Place of birth for the foreign-born population - Trinidad and Tobago (%)
Place of birth for the foreign-born population - West Indies (%)
Place of birth for the foreign-born population - Other Caribbean (%)
Place of birth for the foreign-born population - Belize (%)
Place of birth for the foreign-born population - Costa Rica (%)
Place of birth for the foreign-born population - El Salvador (%)
Place of birth for the foreign-born population - Guatemala (%)
Place of birth for the foreign-born population - Honduras (%)
Place of birth for the foreign-born population - Mexico (%)
Place of birth for the foreign-born population - Nicaragua (%)
Place of birth for the foreign-born population - Panama (%)
Place of birth for the foreign-born population - Other Central America (%)
Place of birth for the foreign-born population - Argentina (%)
Place of birth for the foreign-born population - Bolivia (%)
Place of birth for the foreign-born population - Brazil (%)
Place of birth for the foreign-born population - Chile (%)
Place of birth for the foreign-born population - Colombia (%)
Place of birth for the foreign-born population - Ecuador (%)
Place of birth for the foreign-born population - Guyana (%)
Place of birth for the foreign-born population - Peru (%)
Place of birth for the foreign-born population - Uruguay (%)
Place of birth for the foreign-born population - Venezuela (%)
Place of birth for the foreign-born population - Other South America (%)
Place of birth for the foreign-born population - Canada (%)
Place of birth for the foreign-born population - Other Northern America (%)
Place of birth for the foreign-born population - Other (%)
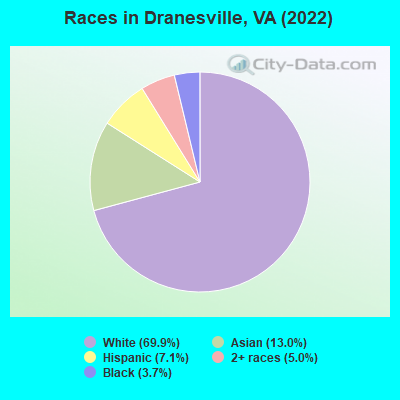
According to 2022 data, the most numerous races in Dranesville, VA are White alone (8,442 residents), Black alone (445 residents), and Hispanic (859 residents). 82.1% of Dranesville residents speak English at home.
Race distribution in Dranesville 8,442 69.9% White alone 1,571 13.0% Asian alone 859 7.1% Hispanic 602 5.0% Two or more races 445 3.7% Black alone
2000 2022
4,965,637 70.2% White alone 1,376,378 19.4% Black alone 329,540 4.7% Hispanic 259,277 3.7% Asian alone 114,022 1.6% Two or more races 18,596 0.3% American Indian alone 11,685 0.2% Other race alone 3,380 0.05% Native Hawaiian and Other
5,095,130 58.7% White alone 1,594,785 18.4% Black alone 905,750 10.4% Hispanic 602,881 6.9% Asian alone 406,047 4.7% Two or more races 60,419 0.7% Other race alone 11,738 0.1% American Indian alone 6,869 0.08% Native Hawaiian and Other
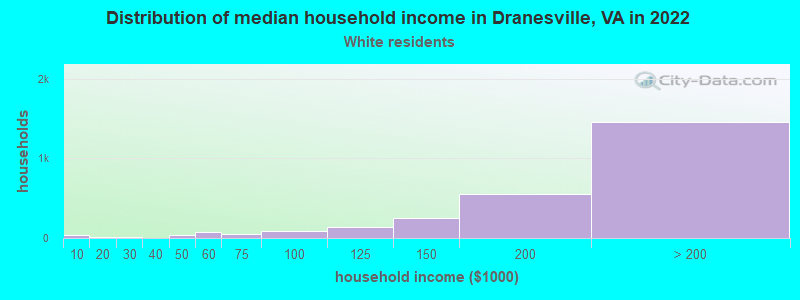
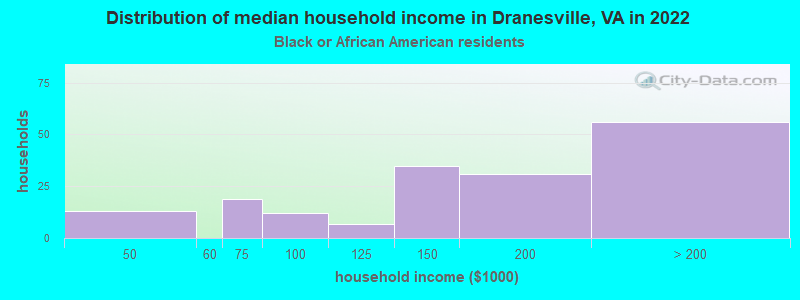
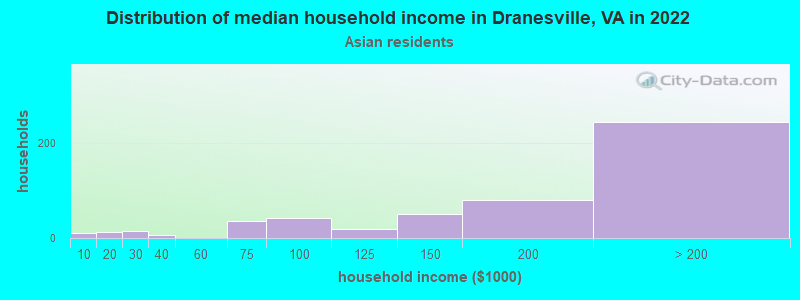
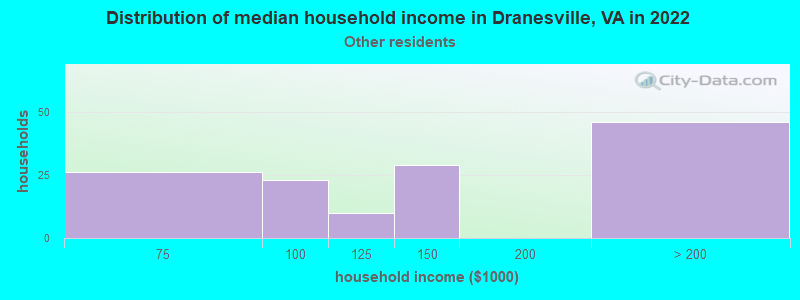
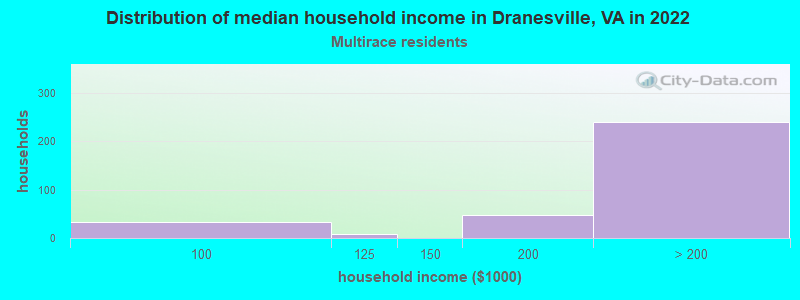
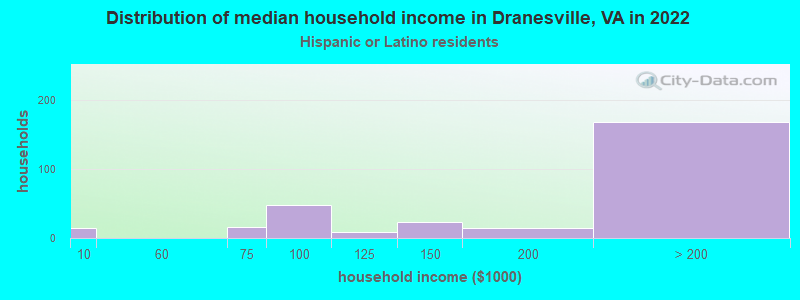
Income and house value in Dranesville Median household income in 2022 over $200,000 White non-Hispanic householders$156,230 Black householders$186,653 Asian householders$128,979 Some other race householdersover $200,000 Two or more races householdersover $200,000 Hispanic or Latino race householders
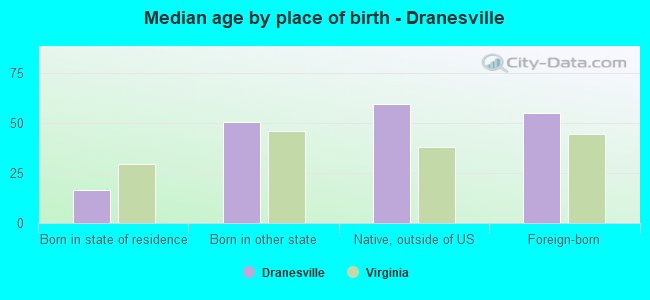
Median age by race in Dranesville
39.9 Median age for White residents38.7 43.1 51.0 Median age for Black or African American residents38.1 60.2 -754,182,753.4 Median age for American Indian / Alaska Native residents-964,539,006.1 -669,005,847.3 51.1 Median age for Asian residents49.4 53.4 -666,666,666.0 Median age for Native Hawaiian / Pacific Islander residents-558,791,801.0 -584,518,166.9 47.7 Median age for Other race residents48.3 46.6 33.0 Median age for Two or more races residents21.4 41.0 39.4 Median age for White alone residents38.5 41.9 45.4 Median age for Hispanic or Latino residents43.6 46.6
Owner/renter occupied households by race in Dranesville
House owners and renters - White residents 2,622 95.7% Owner occupied117 4.3% Renter occupiedHouse owners and renters - Black or African American residents 153 97.5% Owner occupied4 2.5% Renter occupiedHouse owners and renters - Asian residents 478 92.7% Owner occupied38 7.3% Renter occupiedHouse owners and renters - Other race residents 92 75.1% Owner occupied30 24.9% Renter occupiedHouse owners and renters - Two or more races residents 265 88.8% Owner occupied33 11.2% Renter occupiedHouse owners and renters - White alone residents 2,676 95.9% Owner occupied115 4.1% Renter occupiedHouse owners and renters - Hispanic or Latino residents 191 75.4% Owner occupied62 24.6% Renter occupied
Language usage in Dranesville
English speakers - Total 82.1% of residents of Dranesville speak English at home.
3.6% of residents speak Spanish at home 236 57.3% Speak English very well176 42.7% Speak English less than very well15.1% of residents speak other language at home 1,177 68.8% Speak English very well534 31.2% Speak English less than very well
English speakers - Born in the United States 95.3% of residents of Dranesville speak English at home.
2.8% of residents speak Spanish at home 68 45.9% Speak English very well80 54.1% Speak English less than very well2.4% of residents speak other language at home 116 90.6% Speak English very well12 9.4% Speak English less than very well
English speakers - Native, born elsewhere 68.3% of residents of Dranesville speak English at home.
12.5% of residents speak Spanish at home 34 100.0% Speak English very well18.5% of residents speak other language at home 43 86.0% Speak English very well7 14.0% Speak English less than very well
English speakers - Foreign-born 26.6% of residents of Dranesville speak English at home.
11.8% of residents speak Spanish at home 136 54.6% Speak English very well113 45.4% Speak English less than very well63.0% of residents speak other language at home 814 61.0% Speak English very well520 39.0% Speak English less than very well
White (Caucasian) - Speak only English Native:
98.6% (7,171)Foreign-born:
46.1% (200)
White (Caucasian) - Speak another language Native:
2.8% (207)Foreign-born:
61.3% (266)
Black or African American - Speak only English Native:
98.0% (291)Foreign-born:
56.6% (75)
Asian - Speak only English Native:
67.5% (333)Foreign-born:
14.0% (148)
Asian - Speak another language Native:
30.9% (152)Foreign-born:
86.1% (913)
Other race - Speak only English Native:
19.3% (17)Foreign-born:
53.5% (146)
Other race - Speak another language Native:
73.4% (64)Foreign-born:
56.5% (155)
Two or more races - Speak another language Native:
5.2% (47)Foreign-born:
100.0% (101)
White alone - Speak only English Native:
97.2% (7,202)Foreign-born:
37.2% (192)
White alone - Speak another language Native:
3.1% (231)Foreign-born:
64.1% (331)
Hispanic or Latino - Speak only English Native:
78.1% (304)Foreign-born:
32.2% (120)
Hispanic or Latino - Speak another language Native:
27.5% (107)Foreign-born:
68.3% (255)
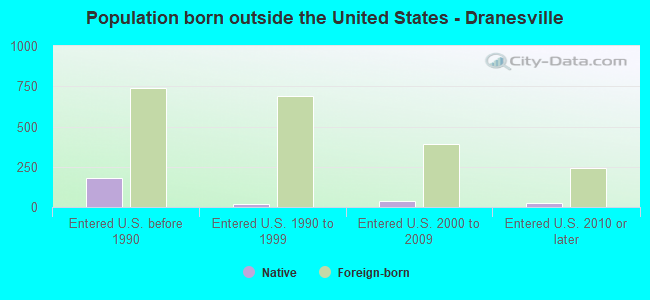
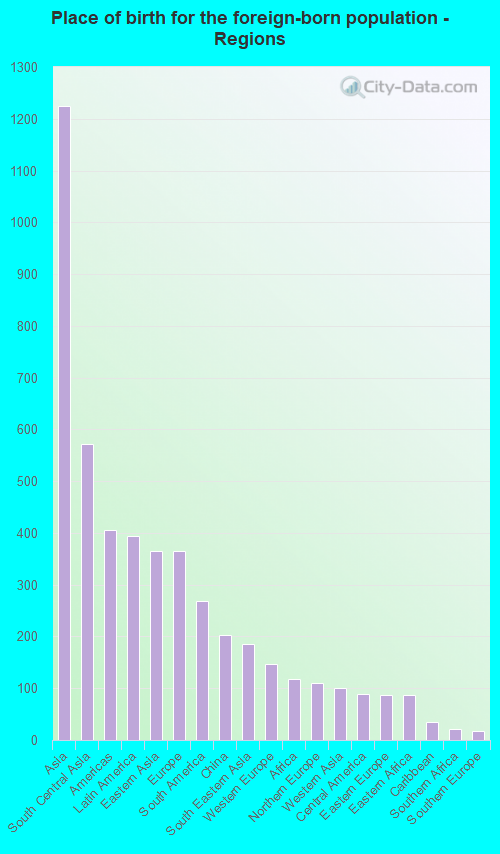
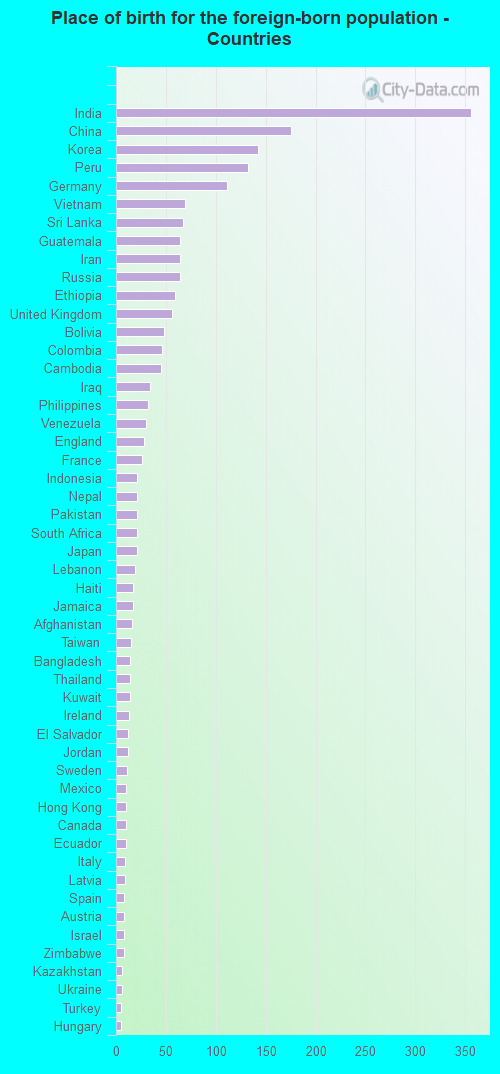
Foreign-born residents in Dranesville
Marital status for residents in Dranesville Marital status - White (Caucasian) population 15 years and over
Males 29.2% Never married65.1% Now married0.0% Separated0.8% Widowed4.9% DivorcedFemales 19.5% Never married68.0% Now married0.4% Separated4.6% Widowed7.4% DivorcedWomen who gave birth in the past 12 months Now married:
100.0% (76)Unmarried:
0.0% (0)
Women who did not give birth in the past 12 months Now married:
56.1% (839)Unmarried:
43.9% (656)
Marital status - Black or African American population 15 years and over
Males 59.8% Never married26.3% Now married0.0% Separated13.9% Widowed0.0% DivorcedFemales 35.1% Never married54.2% Now married0.0% Separated0.0% Widowed10.7% DivorcedWomen who did not give birth in the past 12 months Now married:
22.2% (14)Unmarried:
77.8% (48)
Marital status - Asian population 15 years and over
Males 34.9% Never married61.1% Now married0.0% Separated0.7% Widowed3.2% DivorcedFemales 23.5% Never married62.1% Now married0.0% Separated11.7% Widowed2.7% DivorcedWomen who gave birth in the past 12 months Now married:
100.0% (9)Unmarried:
0.0% (0)
Women who did not give birth in the past 12 months Now married:
56.0% (158)Unmarried:
44.0% (124)
Marital status - Other race population 15 years and over
Males 33.8% Never married33.8% Now married16.2% Separated0.0% Widowed16.2% DivorcedFemales 10.0% Never married40.9% Now married8.2% Separated0.0% Widowed40.9% DivorcedWomen who did not give birth in the past 12 months Now married:
20.0% (10)Unmarried:
80.0% (39)
Marital status - Two or more races population 15 years and over
Males 52.1% Never married32.5% Now married0.0% Separated13.6% Widowed1.8% DivorcedFemales 30.9% Never married49.8% Now married0.0% Separated16.4% Widowed2.9% DivorcedWomen who did not give birth in the past 12 months Now married:
35.8% (39)Unmarried:
64.2% (70)
Marital status - White alone, not Hispanic / Latino population 15 years and over
Males 29.0% Never married65.3% Now married0.0% Separated0.8% Widowed5.0% DivorcedFemales 20.1% Never married67.7% Now married0.4% Separated4.4% Widowed7.3% DivorcedWomen who gave birth in the past 12 months Now married:
100.0% (39)Unmarried:
0.0% (0)
Women who did not give birth in the past 12 months Now married:
56.4% (907)Unmarried:
43.6% (702)
Marital status - Hispanic or Latino population 15 years and over
Males 47.1% Never married24.8% Now married6.0% Separated14.2% Widowed7.9% DivorcedFemales 4.6% Never married66.3% Now married3.2% Separated4.2% Widowed21.8% DivorcedWomen who gave birth in the past 12 months Now married:
100.0% (45)Unmarried:
0.0% (0)
Women who did not give birth in the past 12 months Now married:
43.7% (35)Unmarried:
56.3% (45)
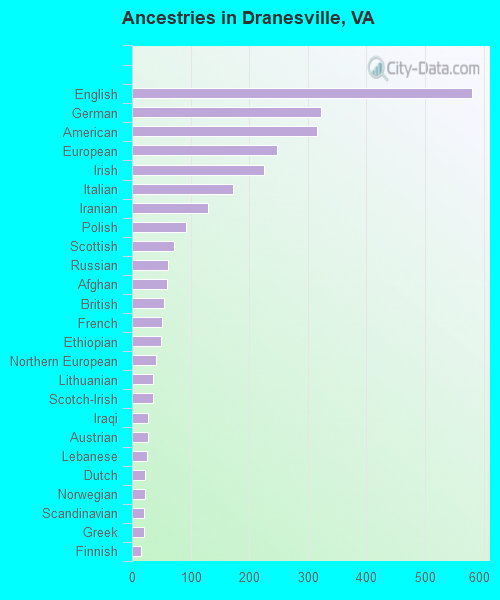
Ancestries in Dranesville
580 11.4% English323 6.3% German315 6.2% American247 4.8% European225 4.4% Irish172 3.4% Italian129 2.5% Iranian92 1.8% Polish72 1.4% Scottish62 1.2% Russian59 1.2% Afghan54 1.1% British51 1.0% French50 1.0% Ethiopian41 0.8% Northern European36 0.7% Lithuanian35 0.7% Scotch-Irish28 0.5% Iraqi28 0.5% Austrian25 0.5% Lebanese22 0.4% Dutch22 0.4% Norwegian21 0.4% Scandinavian20 0.4% Greek16 0.3% Finnish14 0.3% Swedish11 0.2% Eastern European11 0.2% African9 0.2% Danish8 0.2% Jordanian8 0.2% Arab7 0.1% Latvian7 0.1% Haitian6 0.1% Ukrainian6 0.1% Welsh5 0.10% Hungarian4 0.08% Swiss4 0.08% Turkish3 0.06% Slovene
Children Nativity (place of birth) in Dranesville
Children under 6 years - Living with two parents Both parents native 643 100.0% NativeBoth parents foreign-born 70 100.0% NativeOne native, one foreign-born parent 46 100.0% NativeChildren under 6 years - Living with one parent Native parent 11 100.0% NativeForeign-born parent 33 100.0% NativeChildren 6 to 17 years - Living with two parents Both parents native 1,377 99.4% Native9 0.6% Foreign-bornBoth parents foreign-born 252 89.9% Native28 10.1% Foreign-bornOne native, one foreign-born parent 142 100.0% NativeChildren 6 to 17 years - Living with one parent Native parent 209 100.0% NativeForeign-born parent 16 62.1% Native10 37.9% Foreign-born
Grandparents responsible for own grandchildren in Dranesville
Grandparents (30 to 59 years) White / Caucasian 10 100.0% Not responsible for grandchildrenBlack or African American 18 100.0% Responsible for grandchildrenWhite alone, not Hispanic / Latino 24 100.0% Not responsible for grandchildren
Grandparents (60 years and over) White / Caucasian 60 100.0% Not responsible for grandchildrenWhite alone, not Hispanic / Latino 67 100.0% Not responsible for grandchildren