Races in Drexel Hill, Pennsylvania (PA) Detailed Stats
Data:
Races - White alone (%)
Races - White alone (% change since 2000)
Races - Black alone (%)
Races - Black alone (% change since 2000)
Races - American Indian alone (%)
Races - American Indian alone (% change since 2000)
Races - Asian alone (%)
Races - Asian alone (% change since 2000)
Races - Hispanic (%)
Races - Hispanic (% change since 2000)
Races - Native Hawaiian and Other Pacific Islander alone (%)
Races - Native Hawaiian and Other Pacific Islander alone (% change since 2000)
Races - Two or more races(%)
Races - Two or more races(% change since 2000)
Races - Other race alone (%)
Races - Other race alone (% change since 2000)
Racial diversity
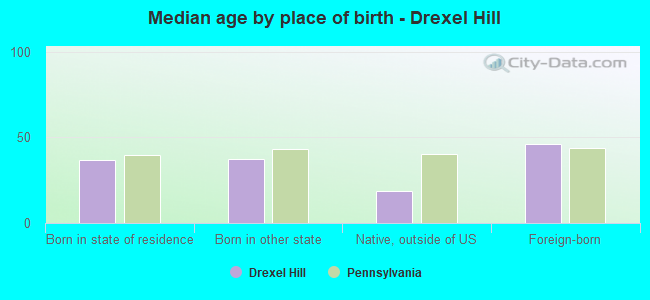
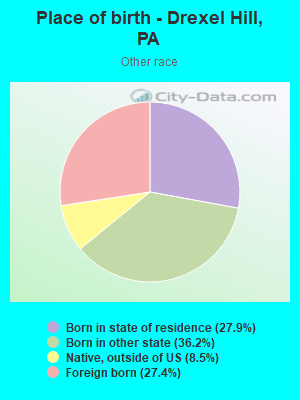
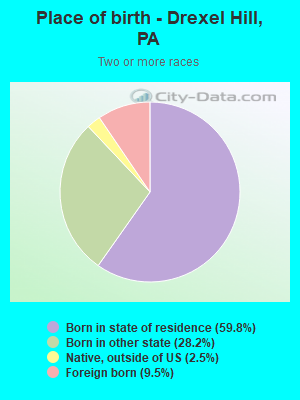
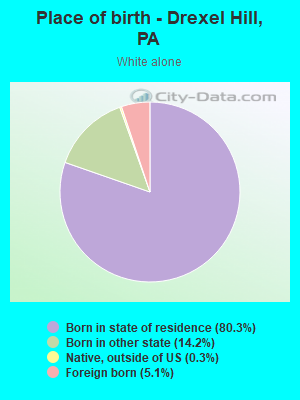
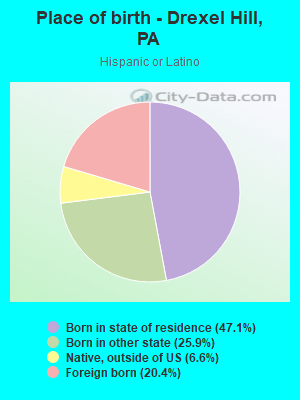
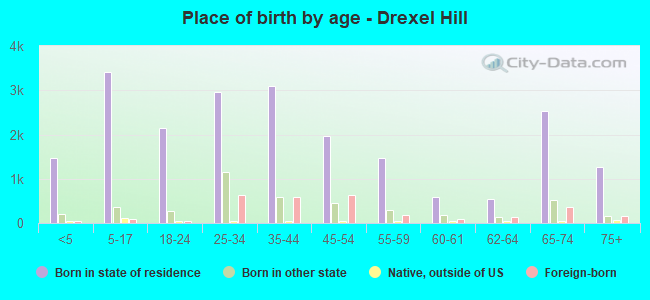
Place of birth - Born in state of residence (%)
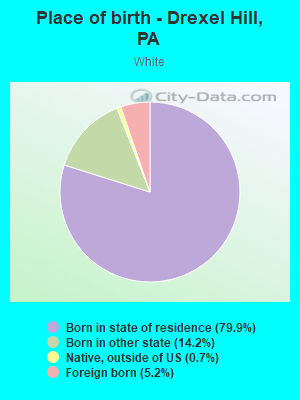
Place of birth - Born in state of residence (%) - White
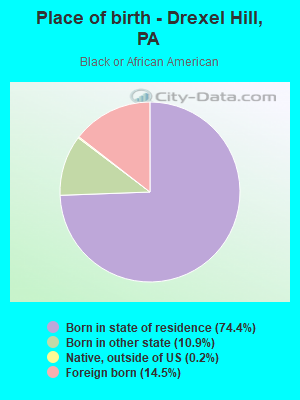
Place of birth - Born in state of residence (%) - Black or African American
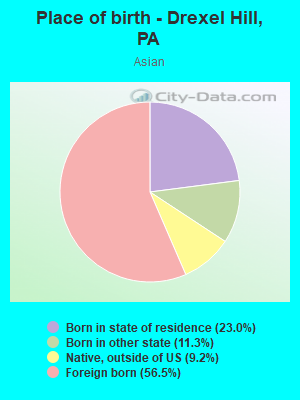
Place of birth - Born in state of residence (%) - Asian
Place of birth - Born in state of residence (%) - Hispanic or Latino
Place of birth - Born in state of residence (%) - American Indian and Alaska Native
Place of birth - Born in state of residence (%) - Multirace
Place of birth - Born in state of residence (%) - Other Race
Place of birth - Born in other state (%)
Place of birth - Born in other state (%) - White
Place of birth - Born in other state (%) - Black or African American
Place of birth - Born in other state (%) - Asian
Place of birth - Born in other state (%) - Hispanic or Latino
Place of birth - Born in other state (%) - American Indian and Alaska Native
Place of birth - Born in other state (%) - Multirace
Place of birth - Born in other state (%) - Other Race
Place of birth - Native, outside of US (%)
Place of birth - Native, outside of US (%) - White
Place of birth - Native, outside of US (%) - Black or African American
Place of birth - Native, outside of US (%) - Asian
Place of birth - Native, outside of US (%) - Hispanic or Latino
Place of birth - Native, outside of US (%) - American Indian and Alaska Native
Place of birth - Native, outside of US (%) - Multirace
Place of birth - Native, outside of US (%) - Other Race
Place of birth - Foreign born (%)
Place of birth - Foreign born (%) - White
Place of birth - Foreign born (%) - Black or African American
Place of birth - Foreign born (%) - Asian
Place of birth - Foreign born (%) - Hispanic or Latino
Place of birth - Foreign born (%) - American Indian and Alaska Native
Place of birth - Foreign born (%) - Multirace
Place of birth - Foreign born (%) - Other Race
Residents speaking English at home (%)
Residents speaking English at home - Born in the United States (%)
Residents speaking English at home - Native, born elsewhere (%)
Residents speaking English at home - Foreign born (%)
Residents speaking Spanish at home (%)
Residents speaking Spanish at home - Born in the United States (%)
Residents speaking Spanish at home - Native, born elsewhere (%)
Residents speaking Spanish at home - Foreign born (%)
Residents speaking other language at home (%)
Residents speaking other language at home - Born in the United States (%)
Residents speaking other language at home - Native, born elsewhere (%)
Residents speaking other language at home - Foreign born (%)
Marital status - Never married (%)
Marital status - Now married (%)
Marital status - Separated (%)
Marital status - Widowed (%)
Marital status - Divorced (%)
Ancestries Reported - Arab (%)
Ancestries Reported - Czech (%)
Ancestries Reported - Danish (%)
Ancestries Reported - Dutch (%)
Ancestries Reported - English (%)
Ancestries Reported - French (%)
Ancestries Reported - French Canadian (%)
Ancestries Reported - German (%)
Ancestries Reported - Greek (%)
Ancestries Reported - Hungarian (%)
Ancestries Reported - Irish (%)
Ancestries Reported - Italian (%)
Ancestries Reported - Lithuanian (%)
Ancestries Reported - Norwegian (%)
Ancestries Reported - Polish (%)
Ancestries Reported - Portuguese (%)
Ancestries Reported - Russian (%)
Ancestries Reported - Scotch-Irish (%)
Ancestries Reported - Scottish (%)
Ancestries Reported - Slovak (%)
Ancestries Reported - Subsaharan African (%)
Ancestries Reported - Swedish (%)
Ancestries Reported - Swiss (%)
Ancestries Reported - Ukrainian (%)
Ancestries Reported - United States (%)
Ancestries Reported - Welsh (%)
Ancestries Reported - West Indian (%)
Ancestries Reported - Other (%)
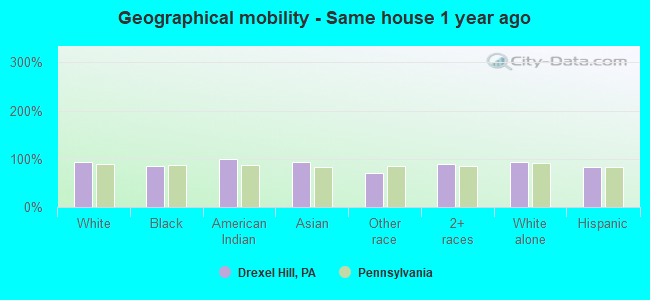
Geographical mobility - Same house 1 year ago (%)
Geographical mobility - Same house 1 year ago (%) - White
Geographical mobility - Same house 1 year ago (%) - Black or African American
Geographical mobility - Same house 1 year ago (%) - Asian
Geographical mobility - Same house 1 year ago (%) - Hispanic or Latino
Geographical mobility - Same house 1 year ago (%) - American Indian and Alaska Native
Geographical mobility - Same house 1 year ago (%) - Multirace
Geographical mobility - Same house 1 year ago (%) - Other Race
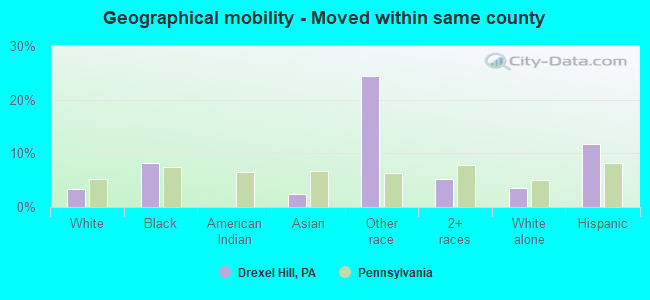
Geographical mobility - Moved within same county (%)
Geographical mobility - Moved within same county (%) - White
Geographical mobility - Moved within same county (%) - Black or African American
Geographical mobility - Moved within same county (%) - Asian
Geographical mobility - Moved within same county (%) - Hispanic or Latino
Geographical mobility - Moved within same county (%) - American Indian and Alaska Native
Geographical mobility - Moved within same county (%) - Multirace
Geographical mobility - Moved within same county (%) - Other Race
Geographical mobility - Moved from different county within same state (%)
Geographical mobility - Moved from different county within same state (%) - White
Geographical mobility - Moved from different county within same state (%) - Black or African American
Geographical mobility - Moved from different county within same state (%) - Asian
Geographical mobility - Moved from different county within same state (%) - Hispanic or Latino
Geographical mobility - Moved from different county within same state (%) - American Indian and Alaska Native
Geographical mobility - Moved from different county within same state (%) - Multirace
Geographical mobility - Moved from different county within same state (%) - Other Race
Geographical mobility - Moved from different state (%)
Geographical mobility - Moved from different state (%) - White
Geographical mobility - Moved from different state (%) - Black or African American
Geographical mobility - Moved from different state (%) - Asian
Geographical mobility - Moved from different state (%) - Hispanic or Latino
Geographical mobility - Moved from different state (%) - American Indian and Alaska Native
Geographical mobility - Moved from different state (%) - Multirace
Geographical mobility - Moved from different state (%) - Other Race
Geographical mobility - Moved from abroad (%)
Geographical mobility - Moved from abroad (%) - White
Geographical mobility - Moved from abroad (%) - Black or African American
Geographical mobility - Moved from abroad (%) - Asian
Geographical mobility - Moved from abroad (%) - Hispanic or Latino
Geographical mobility - Moved from abroad (%) - American Indian and Alaska Native
Geographical mobility - Moved from abroad (%) - Multirace
Geographical mobility - Moved from abroad (%) - Other Race
Place of birth for the foreign-born population - Ireland (%)
Place of birth for the foreign-born population - Denmark (%)
Place of birth for the foreign-born population - Norway (%)
Place of birth for the foreign-born population - Sweden (%)
Place of birth for the foreign-born population - United Kingdom (%)
Place of birth for the foreign-born population - England (%)
Place of birth for the foreign-born population - Scotland (%)
Place of birth for the foreign-born population - Other Northern Europe (%)
Place of birth for the foreign-born population - Austria (%)
Place of birth for the foreign-born population - Belgium (%)
Place of birth for the foreign-born population - France (%)
Place of birth for the foreign-born population - Germany (%)
Place of birth for the foreign-born population - Netherlands (%)
Place of birth for the foreign-born population - Switzerland (%)
Place of birth for the foreign-born population - Other Western Europe (%)
Place of birth for the foreign-born population - Greece (%)
Place of birth for the foreign-born population - Italy (%)
Place of birth for the foreign-born population - Portugal (%)
Place of birth for the foreign-born population - Spain (%)
Place of birth for the foreign-born population - Other Southern Europe (%)
Place of birth for the foreign-born population - Albania (%)
Place of birth for the foreign-born population - Belarus (%)
Place of birth for the foreign-born population - Bosnia and Herzegovina (%)
Place of birth for the foreign-born population - Bulgaria (%)
Place of birth for the foreign-born population - Croatia (%)
Place of birth for the foreign-born population - Czechoslovakia (%)
Place of birth for the foreign-born population - Hungary (%)
Place of birth for the foreign-born population - Latvia (%)
Place of birth for the foreign-born population - Lithuania (%)
Place of birth for the foreign-born population - North Macedonia (Macedonia) (%)
Place of birth for the foreign-born population - Moldova (%)
Place of birth for the foreign-born population - Poland (%)
Place of birth for the foreign-born population - Romania (%)
Place of birth for the foreign-born population - Russia (%)
Place of birth for the foreign-born population - Serbia (%)
Place of birth for the foreign-born population - Ukraine (%)
Place of birth for the foreign-born population - Other Eastern Europe (%)
Place of birth for the foreign-born population - China (%)
Place of birth for the foreign-born population - Hong Kong (%)
Place of birth for the foreign-born population - Taiwan (%)
Place of birth for the foreign-born population - Japan (%)
Place of birth for the foreign-born population - Korea (%)
Place of birth for the foreign-born population - Other Eastern Asia (%)
Place of birth for the foreign-born population - Afghanistan (%)
Place of birth for the foreign-born population - Bangladesh (%)
Place of birth for the foreign-born population - India (%)
Place of birth for the foreign-born population - Iran (%)
Place of birth for the foreign-born population - Kazakhstan (%)
Place of birth for the foreign-born population - Nepal (%)
Place of birth for the foreign-born population - Pakistan (%)
Place of birth for the foreign-born population - Sri Lanka (%)
Place of birth for the foreign-born population - Uzbekistan (%)
Place of birth for the foreign-born population - Other South Central Asia (%)
Place of birth for the foreign-born population - Burma (%)
Place of birth for the foreign-born population - Cambodia (%)
Place of birth for the foreign-born population - Indonesia (%)
Place of birth for the foreign-born population - Laos (%)
Place of birth for the foreign-born population - Malaysia (%)
Place of birth for the foreign-born population - Philippines (%)
Place of birth for the foreign-born population - Singapore (%)
Place of birth for the foreign-born population - Thailand (%)
Place of birth for the foreign-born population - Vietnam (%)
Place of birth for the foreign-born population - Other South Eastern Asia (%)
Place of birth for the foreign-born population - Armenia (%)
Place of birth for the foreign-born population - Iraq (%)
Place of birth for the foreign-born population - Israel (%)
Place of birth for the foreign-born population - Jordan (%)
Place of birth for the foreign-born population - Kuwait (%)
Place of birth for the foreign-born population - Lebanon (%)
Place of birth for the foreign-born population - Saudi Arabia (%)
Place of birth for the foreign-born population - Syria (%)
Place of birth for the foreign-born population - Turkey (%)
Place of birth for the foreign-born population - Yemen (%)
Place of birth for the foreign-born population - Other Western Asia (%)
Place of birth for the foreign-born population - Eritrea (%)
Place of birth for the foreign-born population - Ethiopia (%)
Place of birth for the foreign-born population - Kenya (%)
Place of birth for the foreign-born population - Somalia (%)
Place of birth for the foreign-born population - Uganda (%)
Place of birth for the foreign-born population - Zimbabwe (%)
Place of birth for the foreign-born population - Other Eastern Africa (%)
Place of birth for the foreign-born population - Cameroon (%)
Place of birth for the foreign-born population - Congo (%)
Place of birth for the foreign-born population - Democratic Republic of Congo (Zaire) (%)
Place of birth for the foreign-born population - Other Middle Africa (%)
Place of birth for the foreign-born population - Egypt (%)
Place of birth for the foreign-born population - Morocco (%)
Place of birth for the foreign-born population - Sudan (%)
Place of birth for the foreign-born population - Other Northern Africa (%)
Place of birth for the foreign-born population - South Africa (%)
Place of birth for the foreign-born population - Other Southern Africa (%)
Place of birth for the foreign-born population - Cabo Verde (%)
Place of birth for the foreign-born population - Ghana (%)
Place of birth for the foreign-born population - Liberia (%)
Place of birth for the foreign-born population - Nigeria (%)
Place of birth for the foreign-born population - Senegal (%)
Place of birth for the foreign-born population - Sierra Leone (%)
Place of birth for the foreign-born population - Other Western Africa (%)
Place of birth for the foreign-born population - Australia (%)
Place of birth for the foreign-born population - New Zealand (%)
Place of birth for the foreign-born population - Fiji (%)
Place of birth for the foreign-born population - Micronesia (%)
Place of birth for the foreign-born population - Bahamas (%)
Place of birth for the foreign-born population - Barbados (%)
Place of birth for the foreign-born population - Cuba (%)
Place of birth for the foreign-born population - Dominica (%)
Place of birth for the foreign-born population - Dominican Republic (%)
Place of birth for the foreign-born population - Grenada (%)
Place of birth for the foreign-born population - Haiti (%)
Place of birth for the foreign-born population - Jamaica (%)
Place of birth for the foreign-born population - St. Vincent and the Grenadines (%)
Place of birth for the foreign-born population - Trinidad and Tobago (%)
Place of birth for the foreign-born population - West Indies (%)
Place of birth for the foreign-born population - Other Caribbean (%)
Place of birth for the foreign-born population - Belize (%)
Place of birth for the foreign-born population - Costa Rica (%)
Place of birth for the foreign-born population - El Salvador (%)
Place of birth for the foreign-born population - Guatemala (%)
Place of birth for the foreign-born population - Honduras (%)
Place of birth for the foreign-born population - Mexico (%)
Place of birth for the foreign-born population - Nicaragua (%)
Place of birth for the foreign-born population - Panama (%)
Place of birth for the foreign-born population - Other Central America (%)
Place of birth for the foreign-born population - Argentina (%)
Place of birth for the foreign-born population - Bolivia (%)
Place of birth for the foreign-born population - Brazil (%)
Place of birth for the foreign-born population - Chile (%)
Place of birth for the foreign-born population - Colombia (%)
Place of birth for the foreign-born population - Ecuador (%)
Place of birth for the foreign-born population - Guyana (%)
Place of birth for the foreign-born population - Peru (%)
Place of birth for the foreign-born population - Uruguay (%)
Place of birth for the foreign-born population - Venezuela (%)
Place of birth for the foreign-born population - Other South America (%)
Place of birth for the foreign-born population - Canada (%)
Place of birth for the foreign-born population - Other Northern America (%)
Place of birth for the foreign-born population - Other (%)
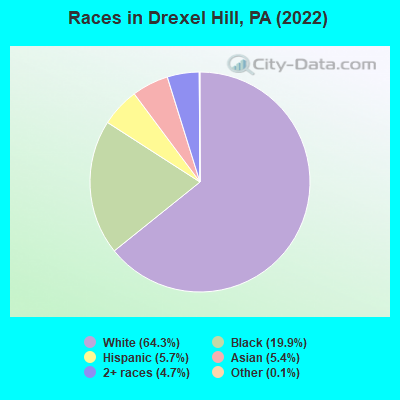
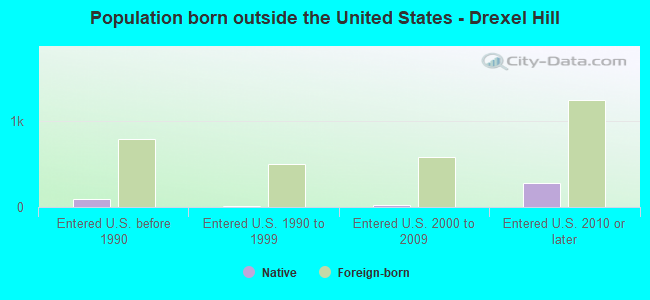
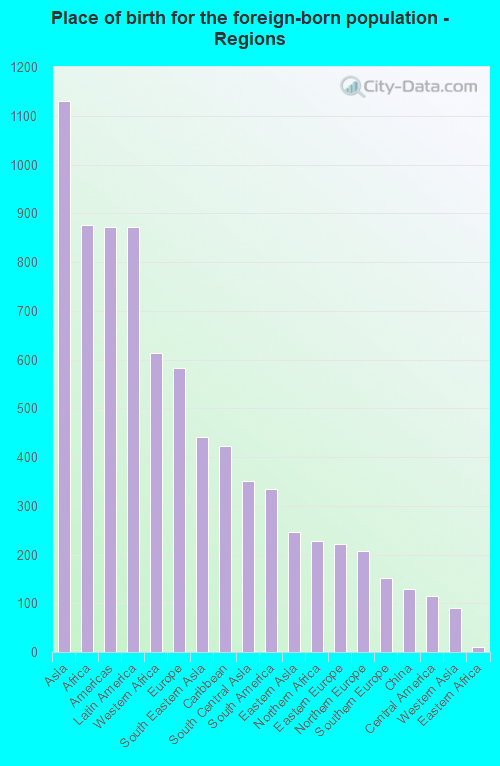
According to 2022 data, the most numerous races in Drexel Hill, PA are White alone (18,795 residents), Black alone (5,804 residents), and Hispanic (1,672 residents). 86.6% of Drexel Hill residents speak English at home. 11.8% of Drexel Hill, PA residents are foreign-born (3.7% born in Asia, 2.9% born in Africa, 2.9% born in Latin America, 1.9% born in Europe), which is 40.9% greater than the foreign-born rate of 7.0% across the entire state of Pennsylvania.
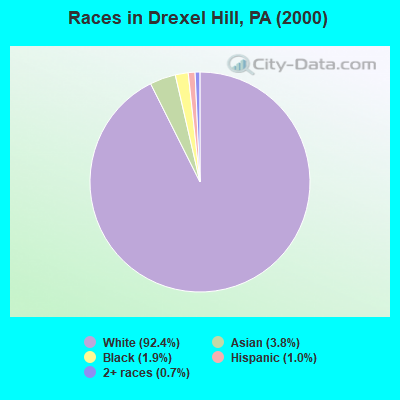
Race distribution in Drexel Hill
2000 2022
10,322,455 84.1% White alone 1,202,437 9.8% Black alone 394,088 3.2% Hispanic 218,296 1.8% Asian alone 113,097 0.9% Two or more races 13,086 0.1% Other race alone 14,904 0.1% American Indian alone 2,691 0.02% Native Hawaiian and Other
9,487,228 73.1% White alone 1,311,581 10.1% Black alone 1,115,997 8.6% Hispanic 493,942 3.8% Two or more races 487,124 3.8% Asian alone 63,582 0.5% Other race alone 10,130 0.08% American Indian alone 2,424 0.02% Native Hawaiian and Other
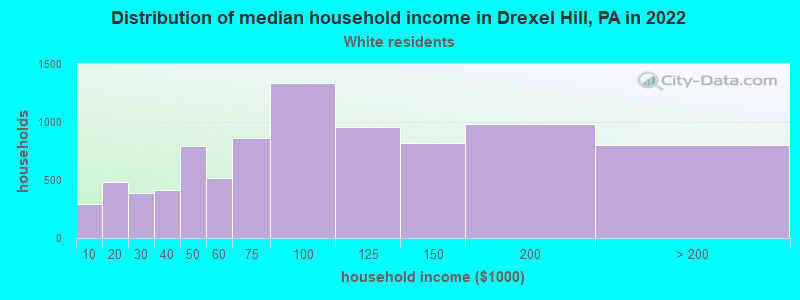
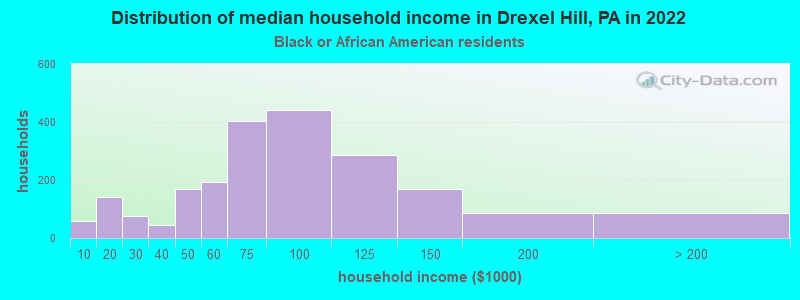
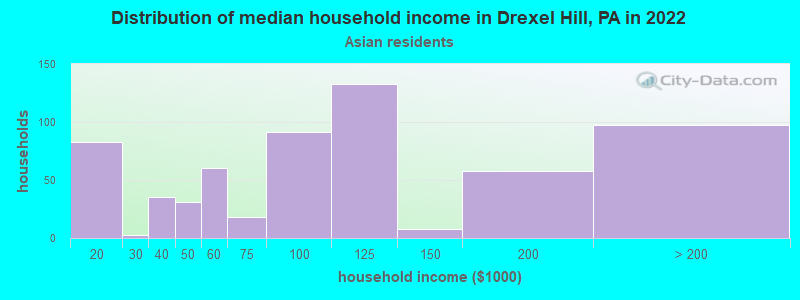
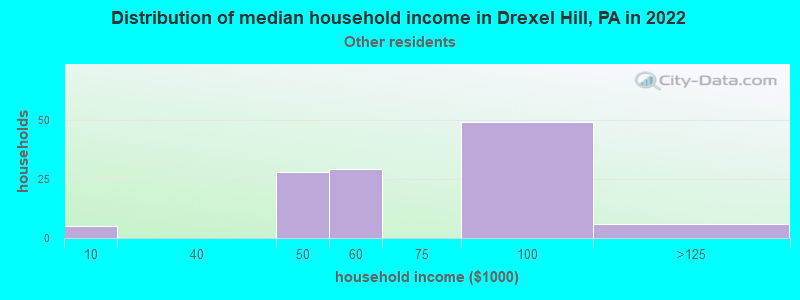
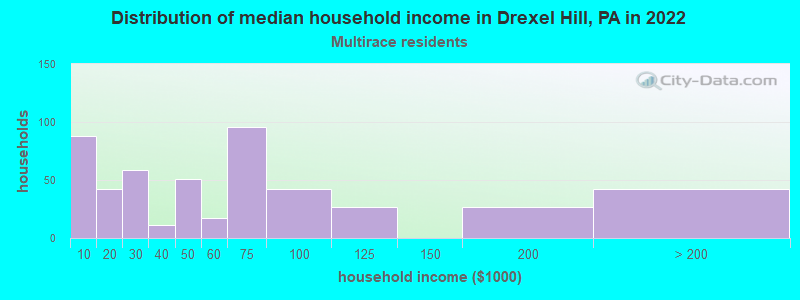
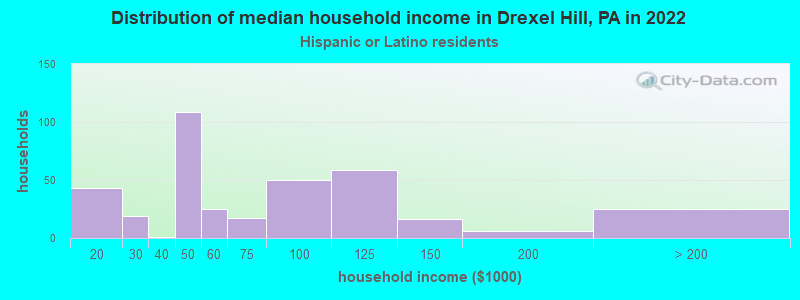
Income and house value in Drexel Hill Median household income in 2022 $82,635 White non-Hispanic householders$80,411 Black householders$87,003 Asian householders$48,429 Two or more races householders$48,014 Hispanic or Latino race householdersMedian 2022 house value $242,777 White Non-Hispanic householders$225,574 Black or African American householders $340,005 Asian householders$265,780 Some other race householders$258,821 Two or more races householders$230,793 Hispanic or Latino householders
Median age by race in Drexel Hill
44.8 Median age for White residents42.4 47.2 31.4 Median age for Black or African American residents30.4 31.0 -1,210,144,926.3 Median age for American Indian / Alaska Native residents-1,478,964,399.8 -897,163,119.7 41.8 Median age for Asian residents32.1 46.1 -680,432,644.4 Median age for Native Hawaiian / Pacific Islander residents-666,666,666.0 -747,474,746.7 30.8 Median age for Other race residents10.6 36.3 23.6 Median age for Two or more races residents19.0 24.9 44.8 Median age for White alone residents42.5 47.3 22.9 Median age for Hispanic or Latino residents23.8 23.7
Owner/renter occupied households by race in Drexel Hill
House owners and renters - White residents 5,824 67.8% Owner occupied2,762 32.2% Renter occupiedHouse owners and renters - Black or African American residents 1,416 62.5% Owner occupied850 37.5% Renter occupiedHouse owners and renters - American Indian / Alaska Native residents 12 100.0% Owner occupiedHouse owners and renters - Asian residents 490 85.1% Owner occupied85 14.9% Renter occupiedHouse owners and renters - Other race residents 51 42.9% Owner occupied68 57.1% Renter occupiedHouse owners and renters - Two or more races residents 205 38.8% Owner occupied324 61.2% Renter occupiedHouse owners and renters - White alone residents 5,794 67.6% Owner occupied2,781 32.4% Renter occupiedHouse owners and renters - Hispanic or Latino residents 199 53.1% Owner occupied176 46.9% Renter occupied
Language usage in Drexel Hill
English speakers - Total 86.6% of residents of Drexel Hill speak English at home.
2.8% of residents speak Spanish at home 488 64.6% Speak English very well268 35.4% Speak English less than very well10.5% of residents speak other language at home 1,800 62.7% Speak English very well1,072 37.3% Speak English less than very well
English speakers - Born in the United States 89.4% of residents of Drexel Hill speak English at home.
4.8% of residents speak Spanish at home 198 100.0% Speak English very well5.2% of residents speak other language at home 197 93.4% Speak English very well14 6.6% Speak English less than very well
English speakers - Native, born elsewhere 28.0% of residents of Drexel Hill speak English at home.
12.4% of residents speak Spanish at home 38 100.0% Speak English very well63.8% of residents speak other language at home 190 96.9% Speak English very well6 3.1% Speak English less than very well
English speakers - Foreign-born 26.1% of residents of Drexel Hill speak English at home.
10.1% of residents speak Spanish at home 149 48.5% Speak English very well158 51.5% Speak English less than very well62.8% of residents speak other language at home 952 49.7% Speak English very well962 50.3% Speak English less than very well
White (Caucasian) - Speak only English Native:
98.0% (16,788)Foreign-born:
26.7% (264)
White (Caucasian) - Speak another language Native:
2.1% (363)Foreign-born:
70.2% (695)
Black or African American - Speak only English Native:
94.5% (4,332)Foreign-born:
41.7% (351)
Black or African American - Speak another language Native:
5.5% (250)Foreign-born:
58.0% (488)
Asian - Speak only English Native:
29.6% (210)Foreign-born:
20.6% (182)
Asian - Speak another language Native:
70.8% (502)Foreign-born:
81.5% (722)
Other race - Speak only English Native:
57.9% (163)Foreign-born:
15.5% (16)
Other race - Speak another language Native:
31.5% (88)Foreign-born:
95.5% (100)
Two or more races - Speak another language Native:
10.3% (184)Foreign-born:
100.0% (219)
White alone - Speak only English Native:
97.9% (16,704)Foreign-born:
26.1% (250)
White alone - Speak another language Native:
2.1% (354)Foreign-born:
71.8% (688)
Hispanic or Latino - Speak only English Native:
72.4% (681)Foreign-born:
6.6% (19)
Hispanic or Latino - Speak another language Native:
29.3% (276)Foreign-born:
92.6% (270)
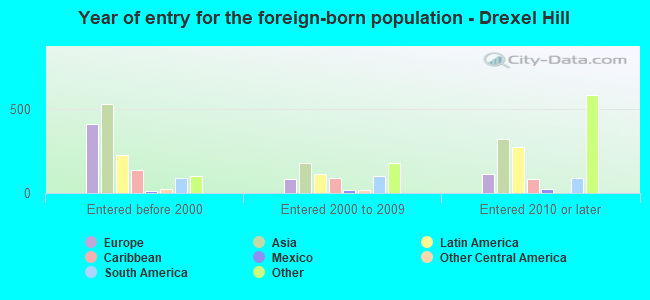
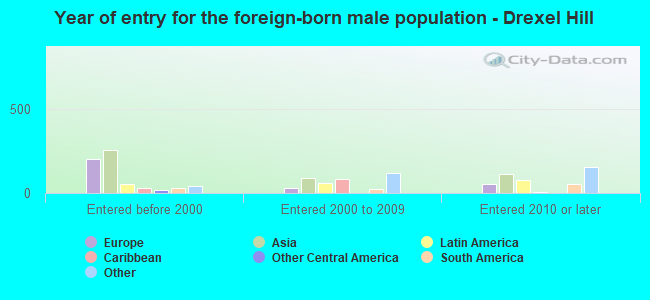
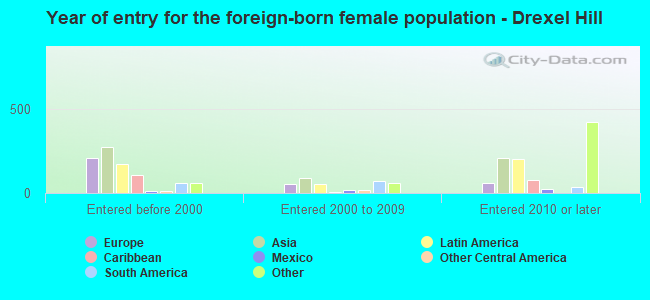
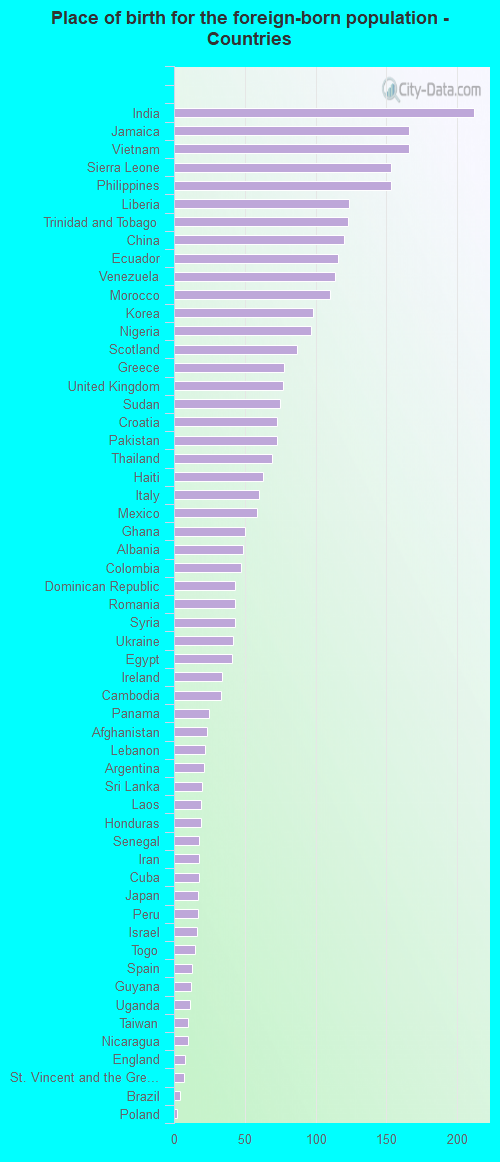
Foreign-born residents in Drexel Hill 3,461 residents are foreign born (3.7% Asia , 2.9% Africa , 2.9% Latin America , 1.9% Europe ).
This city:
11.8%Pennsylvania:
7.3%
Marital status for residents in Drexel Hill Marital status - White (Caucasian) population 15 years and over
Males 36.5% Never married52.4% Now married0.6% Separated3.8% Widowed6.7% DivorcedFemales 32.1% Never married45.2% Now married1.4% Separated10.2% Widowed11.0% DivorcedWomen who gave birth in the past 12 months Now married:
40.9% (157)Unmarried:
59.1% (228)
Women who did not give birth in the past 12 months Now married:
39.8% (1,526)Unmarried:
60.2% (2,312)
Marital status - Black or African American population 15 years and over
Males 50.7% Never married44.4% Now married1.4% Separated0.4% Widowed3.1% DivorcedFemales 50.9% Never married35.6% Now married3.9% Separated0.9% Widowed8.8% DivorcedWomen who gave birth in the past 12 months Now married:
9.4% (6)Unmarried:
90.6% (59)
Women who did not give birth in the past 12 months Now married:
34.7% (667)Unmarried:
65.3% (1,252)
Marital status - Asian population 15 years and over
Males 26.9% Never married70.1% Now married0.0% Separated0.0% Widowed3.1% DivorcedFemales 23.2% Never married52.0% Now married0.0% Separated12.6% Widowed12.3% DivorcedWomen who did not give birth in the past 12 months Now married:
54.3% (239)Unmarried:
45.7% (202)
Marital status - Other race population 15 years and over
Males 72.5% Never married23.2% Now married0.0% Separated4.3% Widowed0.0% DivorcedFemales 14.4% Never married52.0% Now married4.0% Separated0.0% Widowed29.6% DivorcedWomen who did not give birth in the past 12 months Now married:
51.3% (72)Unmarried:
48.7% (69)
Marital status - Two or more races population 15 years and over
Males 65.7% Never married30.0% Now married0.0% Separated0.2% Widowed4.1% DivorcedFemales 73.9% Never married11.7% Now married3.5% Separated0.8% Widowed10.1% DivorcedWomen who gave birth in the past 12 months Now married:
3.5% (7)Unmarried:
96.5% (199)
Women who did not give birth in the past 12 months Now married:
17.4% (102)Unmarried:
82.6% (483)
Marital status - White alone, not Hispanic / Latino population 15 years and over
Males 36.6% Never married52.3% Now married0.7% Separated3.8% Widowed6.7% DivorcedFemales 32.4% Never married45.1% Now married1.4% Separated10.3% Widowed10.8% DivorcedWomen who gave birth in the past 12 months Now married:
40.9% (159)Unmarried:
59.1% (230)
Women who did not give birth in the past 12 months Now married:
39.2% (1,491)Unmarried:
60.8% (2,317)
Marital status - Hispanic or Latino population 15 years and over
Males 52.2% Never married44.6% Now married0.0% Separated1.0% Widowed2.2% DivorcedFemales 42.6% Never married38.3% Now married0.0% Separated1.6% Widowed17.5% DivorcedWomen who gave birth in the past 12 months Now married:
100.0% (7)Unmarried:
0.0% (0)
Women who did not give birth in the past 12 months Now married:
34.8% (170)Unmarried:
65.2% (318)
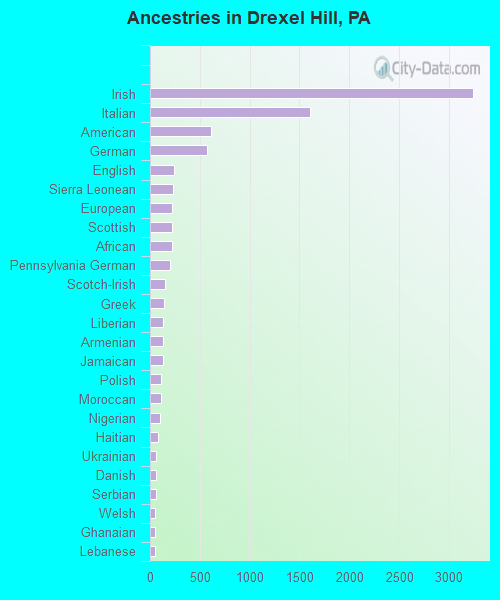
Ancestries in Drexel Hill
3,240 22.1% Irish1,610 11.0% Italian613 4.2% American577 3.9% German237 1.6% English226 1.5% Sierra Leonean225 1.5% European224 1.5% Scottish218 1.5% African200 1.4% Pennsylvania German147 1.0% Scotch-Irish142 1.0% Greek135 0.9% Liberian133 0.9% Armenian130 0.9% Jamaican114 0.8% Polish110 0.8% Moroccan98 0.7% Nigerian78 0.5% Haitian63 0.4% Ukrainian58 0.4% Danish58 0.4% Serbian54 0.4% Welsh53 0.4% Ghanaian52 0.4% Lebanese52 0.4% Eastern European45 0.3% Albanian43 0.3% Egyptian43 0.3% Syrian41 0.3% Romanian36 0.2% Swedish33 0.2% French Canadian28 0.2% Hungarian23 0.2% British23 0.2% Russian21 0.1% Trinidadian and Tobagonian18 0.1% Czech16 0.1% Slovak16 0.1% Finnish13 0.09% Turkish12 0.08% Canadian12 0.08% Iranian11 0.08% Austrian10 0.07% Northern European8 0.05% Senegalese8 0.05% Macedonian7 0.05% Afghan6 0.04% Czechoslovakian5 0.03% British West Indian4 0.03% Portuguese4 0.03% Scandinavian3 0.02% Croatian
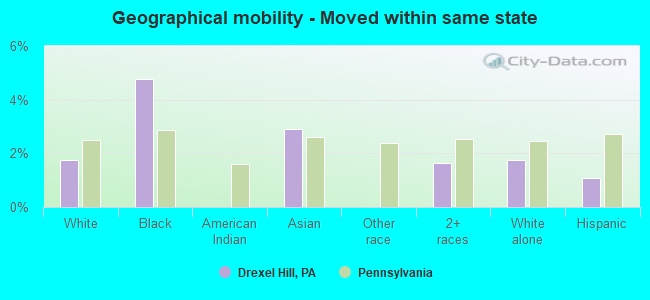
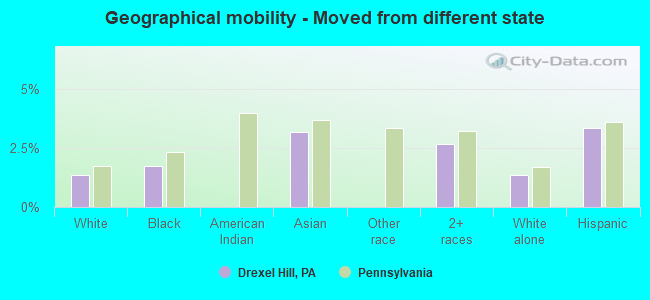
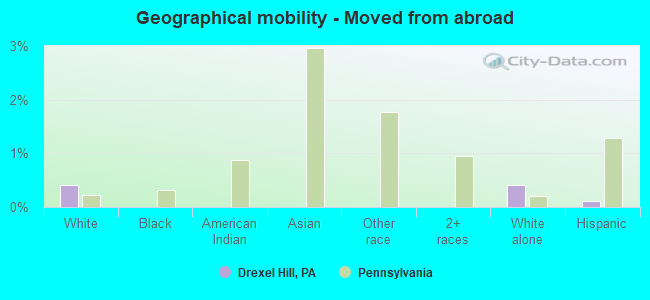
Geographical mobility in Drexel Hill Same house 1 year ago 17,412 93.3% White (Caucasian)4,870 84.6% Black or African American13 99.6% American Indian / Alaska Native1,477 92.7% Asian288 70.4% Other race2,151 89.7% Two or more races17,201 93.1% White alone, not Hispanic / Latino1,267 82.5% Hispanic or LatinoMoved within same county 629 3.4% White / Caucasian477 8.3% Black or African American40 2.5% Asian99 24.3% Other race123 5.1% Two or more races653 3.5% White alone, not Hispanic / Latino181 11.8% Hispanic or LatinoMoved within same state 326 1.7% White / Caucasian274 4.8% Black or African American46 2.9% Asian39 1.6% Two or more races323 1.7% White alone, not Hispanic / Latino17 1.1% Hispanic or LatinoMoved from different state 251 1.3% White / Caucasian100 1.7% Black or African American51 3.2% Asian64 2.7% Two or more races250 1.4% White alone, not Hispanic / Latino51 3.3% Hispanic or LatinoMoved from abroad 78 0.4% White77 0.4% White alone, not Hispanic / Latino2 0.1% Hispanic or Latino
Children Nativity (place of birth) in Drexel Hill
Children under 6 years - Living with two parents Both parents native 952 100.0% NativeBoth parents foreign-born 61 70.8% Native25 29.2% Foreign-bornOne native, one foreign-born parent 81 100.0% NativeChildren under 6 years - Living with one parent Native parent 655 100.0% NativeForeign-born parent 22 100.0% NativeChildren 6 to 17 years - Living with two parents Both parents native 1,913 100.0% NativeBoth parents foreign-born 276 80.2% Native68 19.8% Foreign-bornOne native, one foreign-born parent 302 100.0% NativeChildren 6 to 17 years - Living with one parent Native parent 879 100.0% NativeForeign-born parent 248 55.6% Native198 44.4% Foreign-born
Grandparents responsible for own grandchildren in Drexel Hill
Grandparents (30 to 59 years) White / Caucasian 31 45.3% Responsible for grandchildren38 54.7% Not responsible for grandchildrenWhite alone, not Hispanic / Latino 31 44.5% Responsible for grandchildren39 55.5% Not responsible for grandchildrenGrandparents (60 years and over) White / Caucasian 28 18.0% Responsible for grandchildren126 82.0% Not responsible for grandchildrenWhite alone, not Hispanic / Latino 28 17.8% Responsible for grandchildren127 82.2% Not responsible for grandchildren