Races in Dublin, Georgia (GA) Detailed Stats
Data:
Races - White alone (%)
Races - White alone (% change since 2000)
Races - Black alone (%)
Races - Black alone (% change since 2000)
Races - American Indian alone (%)
Races - American Indian alone (% change since 2000)
Races - Asian alone (%)
Races - Asian alone (% change since 2000)
Races - Hispanic (%)
Races - Hispanic (% change since 2000)
Races - Native Hawaiian and Other Pacific Islander alone (%)
Races - Native Hawaiian and Other Pacific Islander alone (% change since 2000)
Races - Two or more races(%)
Races - Two or more races(% change since 2000)
Races - Other race alone (%)
Races - Other race alone (% change since 2000)
Racial diversity
Place of birth - Born in state of residence (%)
Place of birth - Born in state of residence (%) - White
Place of birth - Born in state of residence (%) - Black or African American
Place of birth - Born in state of residence (%) - Asian
Place of birth - Born in state of residence (%) - Hispanic or Latino
Place of birth - Born in state of residence (%) - American Indian and Alaska Native
Place of birth - Born in state of residence (%) - Multirace
Place of birth - Born in state of residence (%) - Other Race
Place of birth - Born in other state (%)
Place of birth - Born in other state (%) - White
Place of birth - Born in other state (%) - Black or African American
Place of birth - Born in other state (%) - Asian
Place of birth - Born in other state (%) - Hispanic or Latino
Place of birth - Born in other state (%) - American Indian and Alaska Native
Place of birth - Born in other state (%) - Multirace
Place of birth - Born in other state (%) - Other Race
Place of birth - Native, outside of US (%)
Place of birth - Native, outside of US (%) - White
Place of birth - Native, outside of US (%) - Black or African American
Place of birth - Native, outside of US (%) - Asian
Place of birth - Native, outside of US (%) - Hispanic or Latino
Place of birth - Native, outside of US (%) - American Indian and Alaska Native
Place of birth - Native, outside of US (%) - Multirace
Place of birth - Native, outside of US (%) - Other Race
Place of birth - Foreign born (%)
Place of birth - Foreign born (%) - White
Place of birth - Foreign born (%) - Black or African American
Place of birth - Foreign born (%) - Asian
Place of birth - Foreign born (%) - Hispanic or Latino
Place of birth - Foreign born (%) - American Indian and Alaska Native
Place of birth - Foreign born (%) - Multirace
Place of birth - Foreign born (%) - Other Race
Residents speaking English at home (%)
Residents speaking English at home - Born in the United States (%)
Residents speaking English at home - Native, born elsewhere (%)
Residents speaking English at home - Foreign born (%)
Residents speaking Spanish at home (%)
Residents speaking Spanish at home - Born in the United States (%)
Residents speaking Spanish at home - Native, born elsewhere (%)
Residents speaking Spanish at home - Foreign born (%)
Residents speaking other language at home (%)
Residents speaking other language at home - Born in the United States (%)
Residents speaking other language at home - Native, born elsewhere (%)
Residents speaking other language at home - Foreign born (%)
Marital status - Never married (%)
Marital status - Now married (%)
Marital status - Separated (%)
Marital status - Widowed (%)
Marital status - Divorced (%)
Ancestries Reported - Arab (%)
Ancestries Reported - Czech (%)
Ancestries Reported - Danish (%)
Ancestries Reported - Dutch (%)
Ancestries Reported - English (%)
Ancestries Reported - French (%)
Ancestries Reported - French Canadian (%)
Ancestries Reported - German (%)
Ancestries Reported - Greek (%)
Ancestries Reported - Hungarian (%)
Ancestries Reported - Irish (%)
Ancestries Reported - Italian (%)
Ancestries Reported - Lithuanian (%)
Ancestries Reported - Norwegian (%)
Ancestries Reported - Polish (%)
Ancestries Reported - Portuguese (%)
Ancestries Reported - Russian (%)
Ancestries Reported - Scotch-Irish (%)
Ancestries Reported - Scottish (%)
Ancestries Reported - Slovak (%)
Ancestries Reported - Subsaharan African (%)
Ancestries Reported - Swedish (%)
Ancestries Reported - Swiss (%)
Ancestries Reported - Ukrainian (%)
Ancestries Reported - United States (%)
Ancestries Reported - Welsh (%)
Ancestries Reported - West Indian (%)
Ancestries Reported - Other (%)
Geographical mobility - Same house 1 year ago (%)
Geographical mobility - Same house 1 year ago (%) - White
Geographical mobility - Same house 1 year ago (%) - Black or African American
Geographical mobility - Same house 1 year ago (%) - Asian
Geographical mobility - Same house 1 year ago (%) - Hispanic or Latino
Geographical mobility - Same house 1 year ago (%) - American Indian and Alaska Native
Geographical mobility - Same house 1 year ago (%) - Multirace
Geographical mobility - Same house 1 year ago (%) - Other Race
Geographical mobility - Moved within same county (%)
Geographical mobility - Moved within same county (%) - White
Geographical mobility - Moved within same county (%) - Black or African American
Geographical mobility - Moved within same county (%) - Asian
Geographical mobility - Moved within same county (%) - Hispanic or Latino
Geographical mobility - Moved within same county (%) - American Indian and Alaska Native
Geographical mobility - Moved within same county (%) - Multirace
Geographical mobility - Moved within same county (%) - Other Race
Geographical mobility - Moved from different county within same state (%)
Geographical mobility - Moved from different county within same state (%) - White
Geographical mobility - Moved from different county within same state (%) - Black or African American
Geographical mobility - Moved from different county within same state (%) - Asian
Geographical mobility - Moved from different county within same state (%) - Hispanic or Latino
Geographical mobility - Moved from different county within same state (%) - American Indian and Alaska Native
Geographical mobility - Moved from different county within same state (%) - Multirace
Geographical mobility - Moved from different county within same state (%) - Other Race
Geographical mobility - Moved from different state (%)
Geographical mobility - Moved from different state (%) - White
Geographical mobility - Moved from different state (%) - Black or African American
Geographical mobility - Moved from different state (%) - Asian
Geographical mobility - Moved from different state (%) - Hispanic or Latino
Geographical mobility - Moved from different state (%) - American Indian and Alaska Native
Geographical mobility - Moved from different state (%) - Multirace
Geographical mobility - Moved from different state (%) - Other Race
Geographical mobility - Moved from abroad (%)
Geographical mobility - Moved from abroad (%) - White
Geographical mobility - Moved from abroad (%) - Black or African American
Geographical mobility - Moved from abroad (%) - Asian
Geographical mobility - Moved from abroad (%) - Hispanic or Latino
Geographical mobility - Moved from abroad (%) - American Indian and Alaska Native
Geographical mobility - Moved from abroad (%) - Multirace
Geographical mobility - Moved from abroad (%) - Other Race
Place of birth for the foreign-born population - Ireland (%)
Place of birth for the foreign-born population - Denmark (%)
Place of birth for the foreign-born population - Norway (%)
Place of birth for the foreign-born population - Sweden (%)
Place of birth for the foreign-born population - United Kingdom (%)
Place of birth for the foreign-born population - England (%)
Place of birth for the foreign-born population - Scotland (%)
Place of birth for the foreign-born population - Other Northern Europe (%)
Place of birth for the foreign-born population - Austria (%)
Place of birth for the foreign-born population - Belgium (%)
Place of birth for the foreign-born population - France (%)
Place of birth for the foreign-born population - Germany (%)
Place of birth for the foreign-born population - Netherlands (%)
Place of birth for the foreign-born population - Switzerland (%)
Place of birth for the foreign-born population - Other Western Europe (%)
Place of birth for the foreign-born population - Greece (%)
Place of birth for the foreign-born population - Italy (%)
Place of birth for the foreign-born population - Portugal (%)
Place of birth for the foreign-born population - Spain (%)
Place of birth for the foreign-born population - Other Southern Europe (%)
Place of birth for the foreign-born population - Albania (%)
Place of birth for the foreign-born population - Belarus (%)
Place of birth for the foreign-born population - Bosnia and Herzegovina (%)
Place of birth for the foreign-born population - Bulgaria (%)
Place of birth for the foreign-born population - Croatia (%)
Place of birth for the foreign-born population - Czechoslovakia (%)
Place of birth for the foreign-born population - Hungary (%)
Place of birth for the foreign-born population - Latvia (%)
Place of birth for the foreign-born population - Lithuania (%)
Place of birth for the foreign-born population - North Macedonia (Macedonia) (%)
Place of birth for the foreign-born population - Moldova (%)
Place of birth for the foreign-born population - Poland (%)
Place of birth for the foreign-born population - Romania (%)
Place of birth for the foreign-born population - Russia (%)
Place of birth for the foreign-born population - Serbia (%)
Place of birth for the foreign-born population - Ukraine (%)
Place of birth for the foreign-born population - Other Eastern Europe (%)
Place of birth for the foreign-born population - China (%)
Place of birth for the foreign-born population - Hong Kong (%)
Place of birth for the foreign-born population - Taiwan (%)
Place of birth for the foreign-born population - Japan (%)
Place of birth for the foreign-born population - Korea (%)
Place of birth for the foreign-born population - Other Eastern Asia (%)
Place of birth for the foreign-born population - Afghanistan (%)
Place of birth for the foreign-born population - Bangladesh (%)
Place of birth for the foreign-born population - India (%)
Place of birth for the foreign-born population - Iran (%)
Place of birth for the foreign-born population - Kazakhstan (%)
Place of birth for the foreign-born population - Nepal (%)
Place of birth for the foreign-born population - Pakistan (%)
Place of birth for the foreign-born population - Sri Lanka (%)
Place of birth for the foreign-born population - Uzbekistan (%)
Place of birth for the foreign-born population - Other South Central Asia (%)
Place of birth for the foreign-born population - Burma (%)
Place of birth for the foreign-born population - Cambodia (%)
Place of birth for the foreign-born population - Indonesia (%)
Place of birth for the foreign-born population - Laos (%)
Place of birth for the foreign-born population - Malaysia (%)
Place of birth for the foreign-born population - Philippines (%)
Place of birth for the foreign-born population - Singapore (%)
Place of birth for the foreign-born population - Thailand (%)
Place of birth for the foreign-born population - Vietnam (%)
Place of birth for the foreign-born population - Other South Eastern Asia (%)
Place of birth for the foreign-born population - Armenia (%)
Place of birth for the foreign-born population - Iraq (%)
Place of birth for the foreign-born population - Israel (%)
Place of birth for the foreign-born population - Jordan (%)
Place of birth for the foreign-born population - Kuwait (%)
Place of birth for the foreign-born population - Lebanon (%)
Place of birth for the foreign-born population - Saudi Arabia (%)
Place of birth for the foreign-born population - Syria (%)
Place of birth for the foreign-born population - Turkey (%)
Place of birth for the foreign-born population - Yemen (%)
Place of birth for the foreign-born population - Other Western Asia (%)
Place of birth for the foreign-born population - Eritrea (%)
Place of birth for the foreign-born population - Ethiopia (%)
Place of birth for the foreign-born population - Kenya (%)
Place of birth for the foreign-born population - Somalia (%)
Place of birth for the foreign-born population - Uganda (%)
Place of birth for the foreign-born population - Zimbabwe (%)
Place of birth for the foreign-born population - Other Eastern Africa (%)
Place of birth for the foreign-born population - Cameroon (%)
Place of birth for the foreign-born population - Congo (%)
Place of birth for the foreign-born population - Democratic Republic of Congo (Zaire) (%)
Place of birth for the foreign-born population - Other Middle Africa (%)
Place of birth for the foreign-born population - Egypt (%)
Place of birth for the foreign-born population - Morocco (%)
Place of birth for the foreign-born population - Sudan (%)
Place of birth for the foreign-born population - Other Northern Africa (%)
Place of birth for the foreign-born population - South Africa (%)
Place of birth for the foreign-born population - Other Southern Africa (%)
Place of birth for the foreign-born population - Cabo Verde (%)
Place of birth for the foreign-born population - Ghana (%)
Place of birth for the foreign-born population - Liberia (%)
Place of birth for the foreign-born population - Nigeria (%)
Place of birth for the foreign-born population - Senegal (%)
Place of birth for the foreign-born population - Sierra Leone (%)
Place of birth for the foreign-born population - Other Western Africa (%)
Place of birth for the foreign-born population - Australia (%)
Place of birth for the foreign-born population - New Zealand (%)
Place of birth for the foreign-born population - Fiji (%)
Place of birth for the foreign-born population - Micronesia (%)
Place of birth for the foreign-born population - Bahamas (%)
Place of birth for the foreign-born population - Barbados (%)
Place of birth for the foreign-born population - Cuba (%)
Place of birth for the foreign-born population - Dominica (%)
Place of birth for the foreign-born population - Dominican Republic (%)
Place of birth for the foreign-born population - Grenada (%)
Place of birth for the foreign-born population - Haiti (%)
Place of birth for the foreign-born population - Jamaica (%)
Place of birth for the foreign-born population - St. Vincent and the Grenadines (%)
Place of birth for the foreign-born population - Trinidad and Tobago (%)
Place of birth for the foreign-born population - West Indies (%)
Place of birth for the foreign-born population - Other Caribbean (%)
Place of birth for the foreign-born population - Belize (%)
Place of birth for the foreign-born population - Costa Rica (%)
Place of birth for the foreign-born population - El Salvador (%)
Place of birth for the foreign-born population - Guatemala (%)
Place of birth for the foreign-born population - Honduras (%)
Place of birth for the foreign-born population - Mexico (%)
Place of birth for the foreign-born population - Nicaragua (%)
Place of birth for the foreign-born population - Panama (%)
Place of birth for the foreign-born population - Other Central America (%)
Place of birth for the foreign-born population - Argentina (%)
Place of birth for the foreign-born population - Bolivia (%)
Place of birth for the foreign-born population - Brazil (%)
Place of birth for the foreign-born population - Chile (%)
Place of birth for the foreign-born population - Colombia (%)
Place of birth for the foreign-born population - Ecuador (%)
Place of birth for the foreign-born population - Guyana (%)
Place of birth for the foreign-born population - Peru (%)
Place of birth for the foreign-born population - Uruguay (%)
Place of birth for the foreign-born population - Venezuela (%)
Place of birth for the foreign-born population - Other South America (%)
Place of birth for the foreign-born population - Canada (%)
Place of birth for the foreign-born population - Other Northern America (%)
Place of birth for the foreign-born population - Other (%)
Latest news about races in Dublin, GA collected exclusively by city-data.com from local newspapers, TV, and radio stations
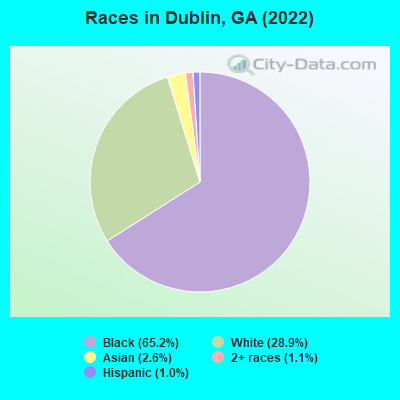
According to 2022 data, the most numerous races in Dublin, GA are White alone (4,704 residents), Black alone (10,607 residents), and Hispanic (164 residents). 96.5% of Dublin residents speak English at home. 1.8% of Dublin, GA residents are foreign-born , which is 461.0% less than the foreign-born rate of 10.0% across the entire state of Georgia.
Race distribution in Dublin
2000 2022
5,128,661 62.6% White alone 2,331,465 28.5% Black alone 435,227 5.3% Hispanic 171,513 2.1% Asian alone 87,364 1.1% Two or more races 17,670 0.2% American Indian alone 11,275 0.1% Other race alone 3,278 0.04% Native Hawaiian and Other
5,415,657 49.6% White alone 3,349,240 30.7% Black alone 1,132,604 10.4% Hispanic 479,156 4.4% Asian alone 462,923 4.2% Two or more races 54,416 0.5% Other race alone 11,923 0.1% American Indian alone 6,957 0.06% Native Hawaiian and Other
Income and house value in Dublin Median household income in 2022 $69,387 White non-Hispanic householders$24,627 Black householdersover $200,000 Hispanic or Latino race householdersMedian 2022 house value $220,215 White Non-Hispanic householders$119,305 Black or African American householders$249,647 American Indian or Alaska Native householders $325,855 Asian householders$197,089 Some other race householders$239,398 Hispanic or Latino householders
Median age by race in Dublin
52.5 Median age for White residents50.7 55.0 30.8 Median age for Black or African American residents30.2 32.0 -597,462,513.8 Median age for American Indian / Alaska Native residents-597,222,221.6 -597,938,143.7 34.4 Median age for Asian residents32.5 43.1 -657,243,815.6 Median age for Native Hawaiian / Pacific Islander residents-693,227,090.9 -776,776,776.0 61.6 Median age for Other race residents-668,918,918.2 -668,981,480.8 27.6 Median age for Two or more races residents1.9 28.2 51.9 Median age for White alone residents49.8 54.2 62.4 Median age for Hispanic or Latino residents56.5 64.9
Owner/renter occupied households by race in Dublin
House owners and renters - White residents 1,268 71.7% Owner occupied500 28.3% Renter occupiedHouse owners and renters - Black or African American residents 935 25.0% Owner occupied2,811 75.0% Renter occupiedHouse owners and renters - Asian residents 131 80.1% Owner occupied33 19.9% Renter occupiedHouse owners and renters - Other race residents 56 100.0% Owner occupiedHouse owners and renters - Two or more races residents 19 100.0% Owner occupiedHouse owners and renters - White alone residents 1,272 70.9% Owner occupied522 29.1% Renter occupiedHouse owners and renters - Hispanic or Latino residents 64 100.0% Owner occupied
Language usage in Dublin
English speakers - Total 96.5% of residents of Dublin speak English at home.
0.8% of residents speak Spanish at home 20 17.4% Speak English very well95 82.6% Speak English less than very well2.4% of residents speak other language at home 137 37.6% Speak English very well227 62.4% Speak English less than very well
English speakers - Born in the United States 93.5% of residents of Dublin speak English at home.
2.2% of residents speak Spanish at home 58 100.0% Speak English less than very well4.6% of residents speak other language at home 35 28.9% Speak English very well86 71.1% Speak English less than very well
English speakers - Native, born elsewhere 86.2% of residents of Dublin speak English at home.
7.7% of residents speak Spanish at home 14 100.0% Speak English very well3.9% of residents speak other language at home 7 100.0% Speak English very well
English speakers - Foreign-born 11.4% of residents of Dublin speak English at home.
11.0% of residents speak Spanish at home 32 100.0% Speak English less than very well77.2% of residents speak other language at home 78 34.8% Speak English very well146 65.2% Speak English less than very well
White (Caucasian) - Speak only English Native:
99.3% (4,477)Foreign-born:
33.1% (15)
White (Caucasian) - Speak another language Native:
1.3% (61)Foreign-born:
67.1% (30)
Black or African American - Speak only English Native:
99.8% (9,429)Foreign-born:
72.0% (15)
Asian - Speak another language Native:
22.4% (56)Foreign-born:
100.0% (189)
White alone - Speak only English Native:
98.1% (4,470)Foreign-born:
41.7% (15)
White alone - Speak another language Native:
1.9% (85)Foreign-born:
58.3% (22)
Hispanic or Latino - Speak only English Native:
42.2% (56)Foreign-born:
3.1% (1)
Hispanic or Latino - Speak another language Native:
57.9% (77)Foreign-born:
96.8% (33)
Foreign-born residents in Dublin 290 residents are foreign born
This city:
1.8%Georgia:
10.4%
Marital status for residents in Dublin Marital status - White (Caucasian) population 15 years and over
Males 27.7% Never married47.3% Now married1.6% Separated9.7% Widowed13.6% DivorcedFemales 17.9% Never married46.3% Now married0.4% Separated17.7% Widowed17.7% DivorcedWomen who gave birth in the past 12 months Now married:
0.0% (0)Unmarried:
100.0% (5)
Women who did not give birth in the past 12 months Now married:
47.6% (393)Unmarried:
52.4% (432)
Marital status - Black or African American population 15 years and over
Males 56.6% Never married26.7% Now married2.4% Separated4.9% Widowed9.4% DivorcedFemales 57.6% Never married17.7% Now married2.2% Separated9.6% Widowed12.9% DivorcedWomen who gave birth in the past 12 months Now married:
15.7% (17)Unmarried:
84.3% (90)
Women who did not give birth in the past 12 months Now married:
15.5% (414)Unmarried:
84.5% (2,253)
Marital status - Asian population 15 years and over
Males 67.0% Never married33.0% Now married0.0% Separated0.0% Widowed0.0% DivorcedFemales 17.7% Never married71.0% Now married0.0% Separated0.0% Widowed11.3% DivorcedWomen who did not give birth in the past 12 months Now married:
71.3% (85)Unmarried:
28.7% (34)
Marital status - Other race population 15 years and over
Males 0.0% Never married100.0% Now married0.0% Separated0.0% Widowed0.0% DivorcedFemales 44.4% Never married55.6% Now married0.0% Separated0.0% Widowed0.0% DivorcedWomen who did not give birth in the past 12 months Now married:
0.0% (0)Unmarried:
100.0% (31)
Marital status - Two or more races population 15 years and over
Males 0.0% Never married20.8% Now married0.0% Separated0.0% Widowed79.2% DivorcedFemales 45.5% Never married27.3% Now married25.0% Separated2.3% Widowed0.0% DivorcedWomen who did not give birth in the past 12 months Now married:
35.5% (16)Unmarried:
64.5% (30)
Marital status - White alone, not Hispanic / Latino population 15 years and over
Males 28.1% Never married47.2% Now married1.6% Separated9.8% Widowed13.3% DivorcedFemales 18.0% Never married46.0% Now married0.4% Separated17.7% Widowed17.7% DivorcedWomen who gave birth in the past 12 months Now married:
0.0% (0)Unmarried:
100.0% (5)
Women who did not give birth in the past 12 months Now married:
47.6% (408)Unmarried:
52.4% (448)
Marital status - Hispanic or Latino population 15 years and over
Males 1.4% Never married83.3% Now married0.0% Separated0.0% Widowed15.3% DivorcedFemales 36.9% Never married61.5% Now married0.0% Separated1.5% Widowed0.0% DivorcedWomen who did not give birth in the past 12 months Now married:
0.0% (0)Unmarried:
100.0% (26)
Ancestries in Dublin
499 4.1% English483 4.0% American277 2.3% Irish91 0.7% European65 0.5% African55 0.5% Scotch-Irish44 0.4% German24 0.2% Welsh22 0.2% Italian22 0.2% Norwegian17 0.1% Hungarian17 0.1% Scottish17 0.1% U.S. Virgin Islander16 0.1% Jamaican7 0.06% French7 0.06% Polish6 0.05% British3 0.02% Northern European
Children Nativity (place of birth) in Dublin
Children under 6 years - Living with two parents Both parents native 332 100.0% NativeChildren under 6 years - Living with one parent Native parent 1,138 100.0% Native
Children 6 to 17 years - Living with two parents Both parents native 691 100.0% NativeBoth parents foreign-born 14 100.0% NativeChildren 6 to 17 years - Living with one parent Native parent 1,741 100.0% Native
Grandparents responsible for own grandchildren in Dublin
Grandparents (30 to 59 years) Black or African American 37 15.9% Responsible for grandchildren194 84.1% Not responsible for grandchildrenGrandparents (60 years and over) Black or African American 61 58.3% Responsible for grandchildren44 41.7% Not responsible for grandchildren