Races in Dublin, Ohio (OH) Detailed Stats
Data:
Races - White alone (%)
Races - White alone (% change since 2000)
Races - Black alone (%)
Races - Black alone (% change since 2000)
Races - American Indian alone (%)
Races - American Indian alone (% change since 2000)
Races - Asian alone (%)
Races - Asian alone (% change since 2000)
Races - Hispanic (%)
Races - Hispanic (% change since 2000)
Races - Native Hawaiian and Other Pacific Islander alone (%)
Races - Native Hawaiian and Other Pacific Islander alone (% change since 2000)
Races - Two or more races(%)
Races - Two or more races(% change since 2000)
Races - Other race alone (%)
Races - Other race alone (% change since 2000)
Racial diversity
Place of birth - Born in state of residence (%)
Place of birth - Born in state of residence (%) - White
Place of birth - Born in state of residence (%) - Black or African American
Place of birth - Born in state of residence (%) - Asian
Place of birth - Born in state of residence (%) - Hispanic or Latino
Place of birth - Born in state of residence (%) - American Indian and Alaska Native
Place of birth - Born in state of residence (%) - Multirace
Place of birth - Born in state of residence (%) - Other Race
Place of birth - Born in other state (%)
Place of birth - Born in other state (%) - White
Place of birth - Born in other state (%) - Black or African American
Place of birth - Born in other state (%) - Asian
Place of birth - Born in other state (%) - Hispanic or Latino
Place of birth - Born in other state (%) - American Indian and Alaska Native
Place of birth - Born in other state (%) - Multirace
Place of birth - Born in other state (%) - Other Race
Place of birth - Native, outside of US (%)
Place of birth - Native, outside of US (%) - White
Place of birth - Native, outside of US (%) - Black or African American
Place of birth - Native, outside of US (%) - Asian
Place of birth - Native, outside of US (%) - Hispanic or Latino
Place of birth - Native, outside of US (%) - American Indian and Alaska Native
Place of birth - Native, outside of US (%) - Multirace
Place of birth - Native, outside of US (%) - Other Race
Place of birth - Foreign born (%)
Place of birth - Foreign born (%) - White
Place of birth - Foreign born (%) - Black or African American
Place of birth - Foreign born (%) - Asian
Place of birth - Foreign born (%) - Hispanic or Latino
Place of birth - Foreign born (%) - American Indian and Alaska Native
Place of birth - Foreign born (%) - Multirace
Place of birth - Foreign born (%) - Other Race
Residents speaking English at home (%)
Residents speaking English at home - Born in the United States (%)
Residents speaking English at home - Native, born elsewhere (%)
Residents speaking English at home - Foreign born (%)
Residents speaking Spanish at home (%)
Residents speaking Spanish at home - Born in the United States (%)
Residents speaking Spanish at home - Native, born elsewhere (%)
Residents speaking Spanish at home - Foreign born (%)
Residents speaking other language at home (%)
Residents speaking other language at home - Born in the United States (%)
Residents speaking other language at home - Native, born elsewhere (%)
Residents speaking other language at home - Foreign born (%)
Marital status - Never married (%)
Marital status - Now married (%)
Marital status - Separated (%)
Marital status - Widowed (%)
Marital status - Divorced (%)
Ancestries Reported - Arab (%)
Ancestries Reported - Czech (%)
Ancestries Reported - Danish (%)
Ancestries Reported - Dutch (%)
Ancestries Reported - English (%)
Ancestries Reported - French (%)
Ancestries Reported - French Canadian (%)
Ancestries Reported - German (%)
Ancestries Reported - Greek (%)
Ancestries Reported - Hungarian (%)
Ancestries Reported - Irish (%)
Ancestries Reported - Italian (%)
Ancestries Reported - Lithuanian (%)
Ancestries Reported - Norwegian (%)
Ancestries Reported - Polish (%)
Ancestries Reported - Portuguese (%)
Ancestries Reported - Russian (%)
Ancestries Reported - Scotch-Irish (%)
Ancestries Reported - Scottish (%)
Ancestries Reported - Slovak (%)
Ancestries Reported - Subsaharan African (%)
Ancestries Reported - Swedish (%)
Ancestries Reported - Swiss (%)
Ancestries Reported - Ukrainian (%)
Ancestries Reported - United States (%)
Ancestries Reported - Welsh (%)
Ancestries Reported - West Indian (%)
Ancestries Reported - Other (%)
Geographical mobility - Same house 1 year ago (%)
Geographical mobility - Same house 1 year ago (%) - White
Geographical mobility - Same house 1 year ago (%) - Black or African American
Geographical mobility - Same house 1 year ago (%) - Asian
Geographical mobility - Same house 1 year ago (%) - Hispanic or Latino
Geographical mobility - Same house 1 year ago (%) - American Indian and Alaska Native
Geographical mobility - Same house 1 year ago (%) - Multirace
Geographical mobility - Same house 1 year ago (%) - Other Race
Geographical mobility - Moved within same county (%)
Geographical mobility - Moved within same county (%) - White
Geographical mobility - Moved within same county (%) - Black or African American
Geographical mobility - Moved within same county (%) - Asian
Geographical mobility - Moved within same county (%) - Hispanic or Latino
Geographical mobility - Moved within same county (%) - American Indian and Alaska Native
Geographical mobility - Moved within same county (%) - Multirace
Geographical mobility - Moved within same county (%) - Other Race
Geographical mobility - Moved from different county within same state (%)
Geographical mobility - Moved from different county within same state (%) - White
Geographical mobility - Moved from different county within same state (%) - Black or African American
Geographical mobility - Moved from different county within same state (%) - Asian
Geographical mobility - Moved from different county within same state (%) - Hispanic or Latino
Geographical mobility - Moved from different county within same state (%) - American Indian and Alaska Native
Geographical mobility - Moved from different county within same state (%) - Multirace
Geographical mobility - Moved from different county within same state (%) - Other Race
Geographical mobility - Moved from different state (%)
Geographical mobility - Moved from different state (%) - White
Geographical mobility - Moved from different state (%) - Black or African American
Geographical mobility - Moved from different state (%) - Asian
Geographical mobility - Moved from different state (%) - Hispanic or Latino
Geographical mobility - Moved from different state (%) - American Indian and Alaska Native
Geographical mobility - Moved from different state (%) - Multirace
Geographical mobility - Moved from different state (%) - Other Race
Geographical mobility - Moved from abroad (%)
Geographical mobility - Moved from abroad (%) - White
Geographical mobility - Moved from abroad (%) - Black or African American
Geographical mobility - Moved from abroad (%) - Asian
Geographical mobility - Moved from abroad (%) - Hispanic or Latino
Geographical mobility - Moved from abroad (%) - American Indian and Alaska Native
Geographical mobility - Moved from abroad (%) - Multirace
Geographical mobility - Moved from abroad (%) - Other Race
Place of birth for the foreign-born population - Ireland (%)
Place of birth for the foreign-born population - Denmark (%)
Place of birth for the foreign-born population - Norway (%)
Place of birth for the foreign-born population - Sweden (%)
Place of birth for the foreign-born population - United Kingdom (%)
Place of birth for the foreign-born population - England (%)
Place of birth for the foreign-born population - Scotland (%)
Place of birth for the foreign-born population - Other Northern Europe (%)
Place of birth for the foreign-born population - Austria (%)
Place of birth for the foreign-born population - Belgium (%)
Place of birth for the foreign-born population - France (%)
Place of birth for the foreign-born population - Germany (%)
Place of birth for the foreign-born population - Netherlands (%)
Place of birth for the foreign-born population - Switzerland (%)
Place of birth for the foreign-born population - Other Western Europe (%)
Place of birth for the foreign-born population - Greece (%)
Place of birth for the foreign-born population - Italy (%)
Place of birth for the foreign-born population - Portugal (%)
Place of birth for the foreign-born population - Spain (%)
Place of birth for the foreign-born population - Other Southern Europe (%)
Place of birth for the foreign-born population - Albania (%)
Place of birth for the foreign-born population - Belarus (%)
Place of birth for the foreign-born population - Bosnia and Herzegovina (%)
Place of birth for the foreign-born population - Bulgaria (%)
Place of birth for the foreign-born population - Croatia (%)
Place of birth for the foreign-born population - Czechoslovakia (%)
Place of birth for the foreign-born population - Hungary (%)
Place of birth for the foreign-born population - Latvia (%)
Place of birth for the foreign-born population - Lithuania (%)
Place of birth for the foreign-born population - North Macedonia (Macedonia) (%)
Place of birth for the foreign-born population - Moldova (%)
Place of birth for the foreign-born population - Poland (%)
Place of birth for the foreign-born population - Romania (%)
Place of birth for the foreign-born population - Russia (%)
Place of birth for the foreign-born population - Serbia (%)
Place of birth for the foreign-born population - Ukraine (%)
Place of birth for the foreign-born population - Other Eastern Europe (%)
Place of birth for the foreign-born population - China (%)
Place of birth for the foreign-born population - Hong Kong (%)
Place of birth for the foreign-born population - Taiwan (%)
Place of birth for the foreign-born population - Japan (%)
Place of birth for the foreign-born population - Korea (%)
Place of birth for the foreign-born population - Other Eastern Asia (%)
Place of birth for the foreign-born population - Afghanistan (%)
Place of birth for the foreign-born population - Bangladesh (%)
Place of birth for the foreign-born population - India (%)
Place of birth for the foreign-born population - Iran (%)
Place of birth for the foreign-born population - Kazakhstan (%)
Place of birth for the foreign-born population - Nepal (%)
Place of birth for the foreign-born population - Pakistan (%)
Place of birth for the foreign-born population - Sri Lanka (%)
Place of birth for the foreign-born population - Uzbekistan (%)
Place of birth for the foreign-born population - Other South Central Asia (%)
Place of birth for the foreign-born population - Burma (%)
Place of birth for the foreign-born population - Cambodia (%)
Place of birth for the foreign-born population - Indonesia (%)
Place of birth for the foreign-born population - Laos (%)
Place of birth for the foreign-born population - Malaysia (%)
Place of birth for the foreign-born population - Philippines (%)
Place of birth for the foreign-born population - Singapore (%)
Place of birth for the foreign-born population - Thailand (%)
Place of birth for the foreign-born population - Vietnam (%)
Place of birth for the foreign-born population - Other South Eastern Asia (%)
Place of birth for the foreign-born population - Armenia (%)
Place of birth for the foreign-born population - Iraq (%)
Place of birth for the foreign-born population - Israel (%)
Place of birth for the foreign-born population - Jordan (%)
Place of birth for the foreign-born population - Kuwait (%)
Place of birth for the foreign-born population - Lebanon (%)
Place of birth for the foreign-born population - Saudi Arabia (%)
Place of birth for the foreign-born population - Syria (%)
Place of birth for the foreign-born population - Turkey (%)
Place of birth for the foreign-born population - Yemen (%)
Place of birth for the foreign-born population - Other Western Asia (%)
Place of birth for the foreign-born population - Eritrea (%)
Place of birth for the foreign-born population - Ethiopia (%)
Place of birth for the foreign-born population - Kenya (%)
Place of birth for the foreign-born population - Somalia (%)
Place of birth for the foreign-born population - Uganda (%)
Place of birth for the foreign-born population - Zimbabwe (%)
Place of birth for the foreign-born population - Other Eastern Africa (%)
Place of birth for the foreign-born population - Cameroon (%)
Place of birth for the foreign-born population - Congo (%)
Place of birth for the foreign-born population - Democratic Republic of Congo (Zaire) (%)
Place of birth for the foreign-born population - Other Middle Africa (%)
Place of birth for the foreign-born population - Egypt (%)
Place of birth for the foreign-born population - Morocco (%)
Place of birth for the foreign-born population - Sudan (%)
Place of birth for the foreign-born population - Other Northern Africa (%)
Place of birth for the foreign-born population - South Africa (%)
Place of birth for the foreign-born population - Other Southern Africa (%)
Place of birth for the foreign-born population - Cabo Verde (%)
Place of birth for the foreign-born population - Ghana (%)
Place of birth for the foreign-born population - Liberia (%)
Place of birth for the foreign-born population - Nigeria (%)
Place of birth for the foreign-born population - Senegal (%)
Place of birth for the foreign-born population - Sierra Leone (%)
Place of birth for the foreign-born population - Other Western Africa (%)
Place of birth for the foreign-born population - Australia (%)
Place of birth for the foreign-born population - New Zealand (%)
Place of birth for the foreign-born population - Fiji (%)
Place of birth for the foreign-born population - Micronesia (%)
Place of birth for the foreign-born population - Bahamas (%)
Place of birth for the foreign-born population - Barbados (%)
Place of birth for the foreign-born population - Cuba (%)
Place of birth for the foreign-born population - Dominica (%)
Place of birth for the foreign-born population - Dominican Republic (%)
Place of birth for the foreign-born population - Grenada (%)
Place of birth for the foreign-born population - Haiti (%)
Place of birth for the foreign-born population - Jamaica (%)
Place of birth for the foreign-born population - St. Vincent and the Grenadines (%)
Place of birth for the foreign-born population - Trinidad and Tobago (%)
Place of birth for the foreign-born population - West Indies (%)
Place of birth for the foreign-born population - Other Caribbean (%)
Place of birth for the foreign-born population - Belize (%)
Place of birth for the foreign-born population - Costa Rica (%)
Place of birth for the foreign-born population - El Salvador (%)
Place of birth for the foreign-born population - Guatemala (%)
Place of birth for the foreign-born population - Honduras (%)
Place of birth for the foreign-born population - Mexico (%)
Place of birth for the foreign-born population - Nicaragua (%)
Place of birth for the foreign-born population - Panama (%)
Place of birth for the foreign-born population - Other Central America (%)
Place of birth for the foreign-born population - Argentina (%)
Place of birth for the foreign-born population - Bolivia (%)
Place of birth for the foreign-born population - Brazil (%)
Place of birth for the foreign-born population - Chile (%)
Place of birth for the foreign-born population - Colombia (%)
Place of birth for the foreign-born population - Ecuador (%)
Place of birth for the foreign-born population - Guyana (%)
Place of birth for the foreign-born population - Peru (%)
Place of birth for the foreign-born population - Uruguay (%)
Place of birth for the foreign-born population - Venezuela (%)
Place of birth for the foreign-born population - Other South America (%)
Place of birth for the foreign-born population - Canada (%)
Place of birth for the foreign-born population - Other Northern America (%)
Place of birth for the foreign-born population - Other (%)
Latest news about races in Dublin, OH collected exclusively by city-data.com from local newspapers, TV, and radio stations
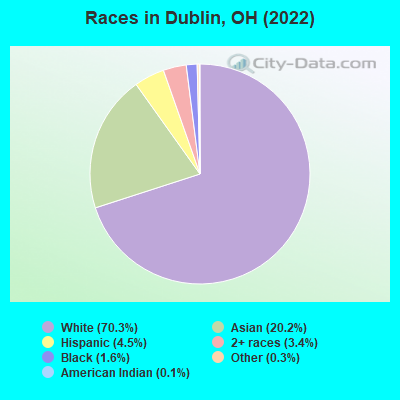
According to 2022 data, the most numerous races in Dublin, OH are White alone (34,486 residents), Black alone (768 residents), and Two or more races (1,690 residents). 76.5% of Dublin residents speak English at home. 20.5% of Dublin, OH residents are foreign-born (15.0% born in Asia), which is 80.4% greater than the foreign-born rate of 4.0% across the entire state of Ohio.
Race distribution in Dublin
2000 2022
9,538,111 84.0% White alone 1,290,662 11.4% Black alone 217,123 1.9% Hispanic 137,770 1.2% Two or more races 131,670 1.2% Asian alone 21,985 0.2% American Indian alone 13,483 0.1% Other race alone 2,336 0.02% Native Hawaiian and Other
8,948,793 76.1% White alone 1,401,403 11.9% Black alone 529,291 4.5% Two or more races 517,232 4.4% Hispanic 293,387 2.5% Asian alone 52,805 0.4% Other race alone 9,785 0.08% American Indian alone 3,362 0.03% Native Hawaiian and Other
Income and house value in Dublin Median household income in 2022 $159,204 White non-Hispanic householders$159,215 Black householders$129,698 Asian householdersover $200,000 Some other race householders$108,758 Two or more races householdersMedian 2022 house value $556,370 White Non-Hispanic householders$563,421 Black or African American householders$369,624 American Indian or Alaska Native householders $522,023 Asian householders$363,483 Two or more races householders$544,314 Hispanic or Latino householders
Median age by race in Dublin
44.3 Median age for White residents44.2 44.5 35.9 Median age for Black or African American residents25.5 36.7 15.3 Median age for American Indian / Alaska Native residents18.2 -732,121,211.4 39.4 Median age for Asian residents38.9 39.6 -497,206,703.4 Median age for Native Hawaiian / Pacific Islander residents-544,891,640.3 -805,394,989.6 18.4 Median age for Other race residents19.0 20.1 17.9 Median age for Two or more races residents20.8 17.6 44.4 Median age for White alone residents44.1 45.6 24.0 Median age for Hispanic or Latino residents18.8 35.9
Owner/renter occupied households by race in Dublin
House owners and renters - White residents 10,869 78.7% Owner occupied2,938 21.3% Renter occupiedHouse owners and renters - Black or African American residents 142 54.4% Owner occupied119 45.6% Renter occupiedHouse owners and renters - American Indian / Alaska Native residents 13 56.6% Owner occupied10 43.4% Renter occupiedHouse owners and renters - Asian residents 1,994 70.0% Owner occupied855 30.0% Renter occupiedHouse owners and renters - Other race residents 145 82.8% Owner occupied30 17.2% Renter occupiedHouse owners and renters - Two or more races residents 399 67.6% Owner occupied191 32.4% Renter occupiedHouse owners and renters - White alone residents 10,729 79.3% Owner occupied2,802 20.7% Renter occupiedHouse owners and renters - Hispanic or Latino residents 371 54.8% Owner occupied306 45.2% Renter occupied
Language usage in Dublin
English speakers - Total 76.5% of residents of Dublin speak English at home.
1.8% of residents speak Spanish at home 605 72.0% Speak English very well235 28.0% Speak English less than very well22.0% of residents speak other language at home 7,383 71.9% Speak English very well2,887 28.1% Speak English less than very well
English speakers - Born in the United States 90.6% of residents of Dublin speak English at home.
1.2% of residents speak Spanish at home 144 100.0% Speak English very well7.9% of residents speak other language at home 836 88.7% Speak English very well107 11.3% Speak English less than very well
English speakers - Native, born elsewhere 97.5% of residents of Dublin speak English at home.
4.0% of residents speak other language at home 13 61.9% Speak English very well8 38.1% Speak English less than very well
English speakers - Foreign-born 14.5% of residents of Dublin speak English at home.
4.6% of residents speak Spanish at home 312 67.2% Speak English very well152 32.8% Speak English less than very well79.2% of residents speak other language at home 5,352 66.5% Speak English very well2,698 33.5% Speak English less than very well
White (Caucasian) - Speak only English Native:
97.2% (30,630)Foreign-born:
26.2% (473)
White (Caucasian) - Speak another language Native:
2.7% (847)Foreign-born:
73.8% (1,329)
Black or African American - Speak only English Native:
98.5% (472)Foreign-born:
76.7% (172)
Asian - Speak only English Native:
46.5% (1,024)Foreign-born:
9.0% (631)
Asian - Speak another language Native:
50.1% (1,103)Foreign-born:
92.0% (6,476)
Other race - Speak only English Native:
66.6% (406)Foreign-born:
30.2% (37)
Other race - Speak another language Native:
14.9% (91)Foreign-born:
21.1% (26)
Two or more races - Speak only English Native:
92.4% (1,667)Foreign-born:
3.3% (10)
Two or more races - Speak another language Native:
7.9% (143)Foreign-born:
96.6% (302)
White alone - Speak only English Native:
97.1% (30,383)Foreign-born:
25.5% (473)
White alone - Speak another language Native:
2.9% (912)Foreign-born:
74.5% (1,383)
Hispanic or Latino - Speak only English Native:
70.4% (1,021)Foreign-born:
3.8% (21)
Hispanic or Latino - Speak another language Native:
23.7% (344)Foreign-born:
95.8% (522)
Foreign-born residents in Dublin 10,028 residents are foreign born (15.0% Asia ).
Marital status for residents in Dublin Marital status - White (Caucasian) population 15 years and over
Males 22.7% Never married68.3% Now married1.1% Separated1.9% Widowed6.0% DivorcedFemales 18.3% Never married68.1% Now married0.8% Separated5.3% Widowed7.5% DivorcedWomen who gave birth in the past 12 months Now married:
99.4% (336)Unmarried:
0.6% (2)
Women who did not give birth in the past 12 months Now married:
64.3% (4,341)Unmarried:
35.7% (2,412)
Marital status - Black or African American population 15 years and over
Males 39.2% Never married60.8% Now married0.0% Separated0.0% Widowed0.0% DivorcedFemales 27.9% Never married58.1% Now married0.0% Separated4.2% Widowed9.8% DivorcedWomen who did not give birth in the past 12 months Now married:
55.5% (63)Unmarried:
44.5% (50)
Marital status - American Indian / Alaska Native population 15 years and over
Males 44.4% Never married55.6% Now married0.0% Separated0.0% Widowed0.0% DivorcedFemales 0.0% Never married0.0% Now married0.0% Separated0.0% Widowed100.0% DivorcedWomen who gave birth in the past 12 months Now married:
0.0% (0)Unmarried:
100.0% (12)
Marital status - Asian population 15 years and over
Males 10.7% Never married84.4% Now married0.0% Separated0.7% Widowed4.2% DivorcedFemales 9.2% Never married88.4% Now married0.0% Separated0.6% Widowed1.8% DivorcedWomen who gave birth in the past 12 months Now married:
100.0% (189)Unmarried:
0.0% (0)
Women who did not give birth in the past 12 months Now married:
84.9% (1,805)Unmarried:
15.1% (320)
Marital status - Other race population 15 years and over
Males 79.8% Never married4.8% Now married0.0% Separated0.0% Widowed15.4% DivorcedFemales 50.3% Never married49.7% Now married0.0% Separated0.0% Widowed0.0% DivorcedWomen who gave birth in the past 12 months Now married:
100.0% (18)Unmarried:
0.0% (0)
Women who did not give birth in the past 12 months Now married:
48.1% (75)Unmarried:
51.9% (81)
Marital status - Two or more races population 15 years and over
Males 27.0% Never married55.0% Now married7.2% Separated0.0% Widowed10.9% DivorcedFemales 39.1% Never married51.3% Now married0.0% Separated9.6% Widowed0.0% DivorcedWomen who did not give birth in the past 12 months Now married:
31.5% (121)Unmarried:
68.5% (263)
Marital status - White alone, not Hispanic / Latino population 15 years and over
Males 22.7% Never married68.2% Now married1.1% Separated1.9% Widowed6.1% DivorcedFemales 18.4% Never married67.6% Now married0.9% Separated5.4% Widowed7.7% DivorcedWomen who gave birth in the past 12 months Now married:
99.3% (289)Unmarried:
0.7% (2)
Women who did not give birth in the past 12 months Now married:
63.4% (4,158)Unmarried:
36.6% (2,400)
Marital status - Hispanic or Latino population 15 years and over
Males 57.9% Never married37.0% Now married0.0% Separated0.0% Widowed5.1% DivorcedFemales 19.4% Never married75.1% Now married0.0% Separated3.8% Widowed1.8% DivorcedWomen who gave birth in the past 12 months Now married:
100.0% (75)Unmarried:
0.0% (0)
Women who did not give birth in the past 12 months Now married:
74.7% (393)Unmarried:
25.3% (133)
Ancestries in Dublin
3,396 13.5% German1,832 7.3% English1,728 6.9% Irish1,331 5.3% American1,044 4.2% Italian881 3.5% European798 3.2% Egyptian406 1.6% Polish313 1.2% Russian303 1.2% Scottish223 0.9% Swiss208 0.8% Lebanese191 0.8% Syrian187 0.7% Jordanian176 0.7% Hungarian173 0.7% Nigerian140 0.6% French132 0.5% Turkish130 0.5% Scotch-Irish121 0.5% Greek111 0.4% Welsh99 0.4% French Canadian94 0.4% British87 0.3% Dutch81 0.3% Scandinavian79 0.3% Norwegian69 0.3% Iranian64 0.3% Northern European61 0.2% Slovak61 0.2% Sierra Leonean57 0.2% Swedish46 0.2% Ghanaian43 0.2% Brazilian34 0.1% Palestinian33 0.1% Slovene33 0.1% Ukrainian29 0.1% Belgian28 0.1% Croatian27 0.1% Trinidadian and Tobagonian26 0.1% Latvian23 0.09% Eastern European23 0.09% Slavic22 0.09% Portuguese21 0.08% Czechoslovakian21 0.08% Romanian19 0.08% Macedonian18 0.07% Canadian16 0.06% Danish16 0.06% Finnish14 0.06% Arab10 0.04% Serbian10 0.04% Czech9 0.04% Jamaican
Geographical mobility in Dublin Same house 1 year ago 31,841 92.3% White (Caucasian)683 89.4% Black or African American101 97.5% American Indian / Alaska Native9,228 94.2% Asian747 92.4% Other race1,904 79.3% Two or more races31,587 92.4% White alone, not Hispanic / Latino1,621 76.5% Hispanic or LatinoMoved within same county 1,304 3.8% White / Caucasian7 0.9% Black or African American185 1.9% Asian401 16.7% Two or more races1,342 3.9% White alone, not Hispanic / Latino265 12.5% Hispanic or LatinoMoved within same state 803 2.3% White / Caucasian44 5.7% Black or African American6 6.0% American Indian / Alaska Native205 2.1% Asian10 0.4% Two or more races801 2.3% White alone, not Hispanic / LatinoMoved from different state 557 1.6% White / Caucasian15 1.9% Black or African American127 1.3% Asian26 3.3% Other race30 1.3% Two or more races399 1.2% White alone, not Hispanic / Latino153 7.2% Hispanic or LatinoMoved from abroad 83 0.2% White471 4.8% Asian92 0.3% White alone, not Hispanic / Latino
Children Nativity (place of birth) in Dublin
Children under 6 years - Living with two parents Both parents native 1,982 100.0% NativeBoth parents foreign-born 534 79.2% Native140 20.8% Foreign-bornOne native, one foreign-born parent 299 100.0% NativeChildren under 6 years - Living with one parent Native parent 95 100.0% NativeForeign-born parent 28 100.0% NativeChildren 6 to 17 years - Living with two parents Both parents native 5,335 99.9% Native7 0.1% Foreign-bornBoth parents foreign-born 1,551 53.7% Native1,340 46.3% Foreign-bornOne native, one foreign-born parent 751 93.0% Native56 7.0% Foreign-bornChildren 6 to 17 years - Living with one parent Native parent 928 100.0% NativeForeign-born parent 465 55.5% Native373 44.5% Foreign-born
Grandparents responsible for own grandchildren in Dublin
Grandparents (30 to 59 years) White / Caucasian 14 36.1% Responsible for grandchildren24 63.9% Not responsible for grandchildrenWhite alone, not Hispanic / Latino 14 35.5% Responsible for grandchildren25 64.5% Not responsible for grandchildrenGrandparents (60 years and over) White / Caucasian 32 12.7% Responsible for grandchildren219 87.3% Not responsible for grandchildrenWhite alone, not Hispanic / Latino 32 12.5% Responsible for grandchildren226 87.5% Not responsible for grandchildren