Races in Dubuque, Iowa (IA) Detailed Stats
Data:
Races - White alone (%)
Races - White alone (% change since 2000)
Races - Black alone (%)
Races - Black alone (% change since 2000)
Races - American Indian alone (%)
Races - American Indian alone (% change since 2000)
Races - Asian alone (%)
Races - Asian alone (% change since 2000)
Races - Hispanic (%)
Races - Hispanic (% change since 2000)
Races - Native Hawaiian and Other Pacific Islander alone (%)
Races - Native Hawaiian and Other Pacific Islander alone (% change since 2000)
Races - Two or more races(%)
Races - Two or more races(% change since 2000)
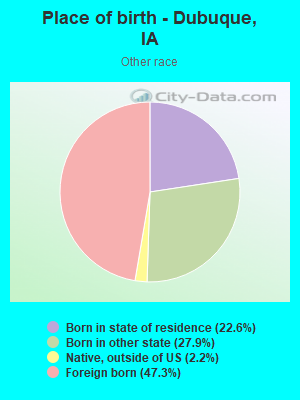
Races - Other race alone (%)
Races - Other race alone (% change since 2000)
Racial diversity
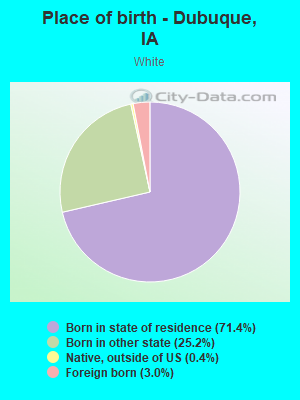
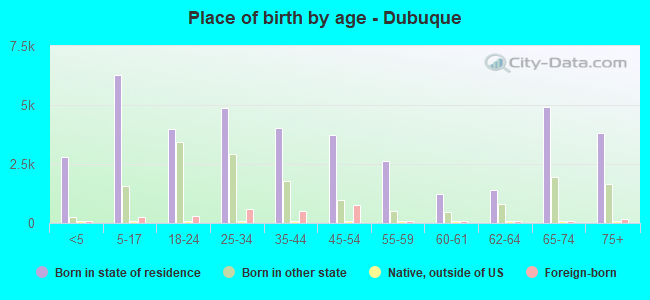
Place of birth - Born in state of residence (%)
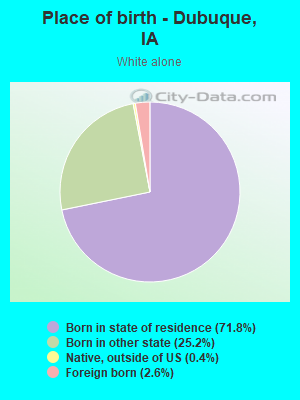
Place of birth - Born in state of residence (%) - White
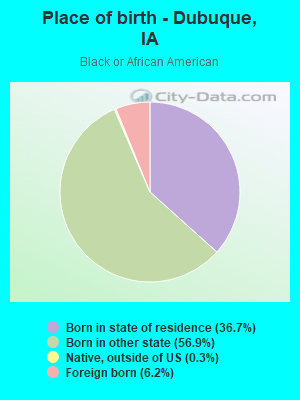
Place of birth - Born in state of residence (%) - Black or African American
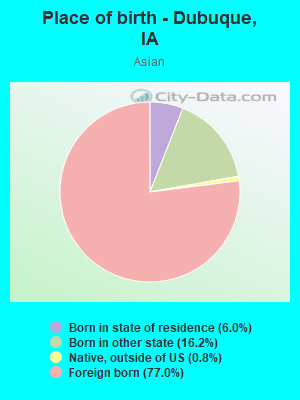
Place of birth - Born in state of residence (%) - Asian
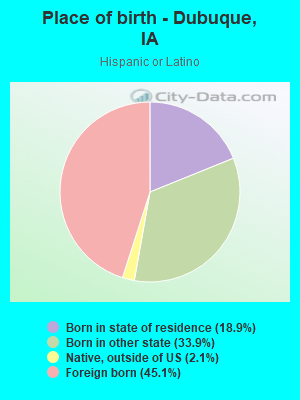
Place of birth - Born in state of residence (%) - Hispanic or Latino
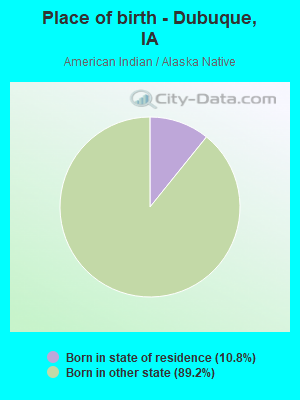
Place of birth - Born in state of residence (%) - American Indian and Alaska Native
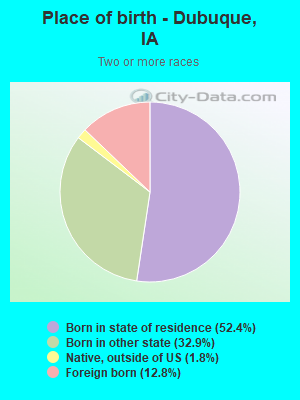
Place of birth - Born in state of residence (%) - Multirace
Place of birth - Born in state of residence (%) - Other Race
Place of birth - Born in other state (%)
Place of birth - Born in other state (%) - White
Place of birth - Born in other state (%) - Black or African American
Place of birth - Born in other state (%) - Asian
Place of birth - Born in other state (%) - Hispanic or Latino
Place of birth - Born in other state (%) - American Indian and Alaska Native
Place of birth - Born in other state (%) - Multirace
Place of birth - Born in other state (%) - Other Race
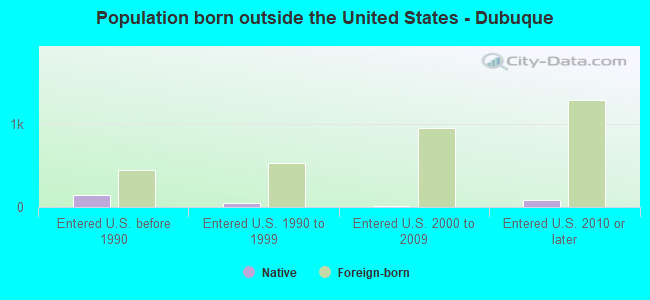
Place of birth - Native, outside of US (%)
Place of birth - Native, outside of US (%) - White
Place of birth - Native, outside of US (%) - Black or African American
Place of birth - Native, outside of US (%) - Asian
Place of birth - Native, outside of US (%) - Hispanic or Latino
Place of birth - Native, outside of US (%) - American Indian and Alaska Native
Place of birth - Native, outside of US (%) - Multirace
Place of birth - Native, outside of US (%) - Other Race
Place of birth - Foreign born (%)
Place of birth - Foreign born (%) - White
Place of birth - Foreign born (%) - Black or African American
Place of birth - Foreign born (%) - Asian
Place of birth - Foreign born (%) - Hispanic or Latino
Place of birth - Foreign born (%) - American Indian and Alaska Native
Place of birth - Foreign born (%) - Multirace
Place of birth - Foreign born (%) - Other Race
Residents speaking English at home (%)
Residents speaking English at home - Born in the United States (%)
Residents speaking English at home - Native, born elsewhere (%)
Residents speaking English at home - Foreign born (%)
Residents speaking Spanish at home (%)
Residents speaking Spanish at home - Born in the United States (%)
Residents speaking Spanish at home - Native, born elsewhere (%)
Residents speaking Spanish at home - Foreign born (%)
Residents speaking other language at home (%)
Residents speaking other language at home - Born in the United States (%)
Residents speaking other language at home - Native, born elsewhere (%)
Residents speaking other language at home - Foreign born (%)
Marital status - Never married (%)
Marital status - Now married (%)
Marital status - Separated (%)
Marital status - Widowed (%)
Marital status - Divorced (%)
Ancestries Reported - Arab (%)
Ancestries Reported - Czech (%)
Ancestries Reported - Danish (%)
Ancestries Reported - Dutch (%)
Ancestries Reported - English (%)
Ancestries Reported - French (%)
Ancestries Reported - French Canadian (%)
Ancestries Reported - German (%)
Ancestries Reported - Greek (%)
Ancestries Reported - Hungarian (%)
Ancestries Reported - Irish (%)
Ancestries Reported - Italian (%)
Ancestries Reported - Lithuanian (%)
Ancestries Reported - Norwegian (%)
Ancestries Reported - Polish (%)
Ancestries Reported - Portuguese (%)
Ancestries Reported - Russian (%)
Ancestries Reported - Scotch-Irish (%)
Ancestries Reported - Scottish (%)
Ancestries Reported - Slovak (%)
Ancestries Reported - Subsaharan African (%)
Ancestries Reported - Swedish (%)
Ancestries Reported - Swiss (%)
Ancestries Reported - Ukrainian (%)
Ancestries Reported - United States (%)
Ancestries Reported - Welsh (%)
Ancestries Reported - West Indian (%)
Ancestries Reported - Other (%)
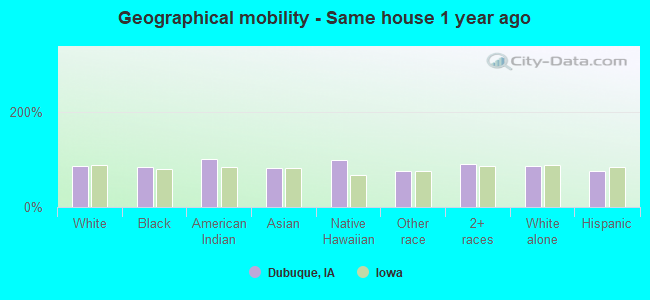
Geographical mobility - Same house 1 year ago (%)
Geographical mobility - Same house 1 year ago (%) - White
Geographical mobility - Same house 1 year ago (%) - Black or African American
Geographical mobility - Same house 1 year ago (%) - Asian
Geographical mobility - Same house 1 year ago (%) - Hispanic or Latino
Geographical mobility - Same house 1 year ago (%) - American Indian and Alaska Native
Geographical mobility - Same house 1 year ago (%) - Multirace
Geographical mobility - Same house 1 year ago (%) - Other Race
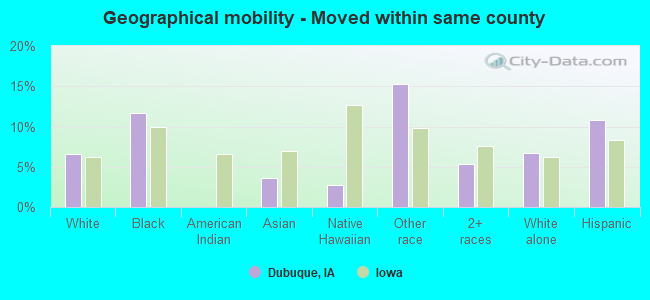
Geographical mobility - Moved within same county (%)
Geographical mobility - Moved within same county (%) - White
Geographical mobility - Moved within same county (%) - Black or African American
Geographical mobility - Moved within same county (%) - Asian
Geographical mobility - Moved within same county (%) - Hispanic or Latino
Geographical mobility - Moved within same county (%) - American Indian and Alaska Native
Geographical mobility - Moved within same county (%) - Multirace
Geographical mobility - Moved within same county (%) - Other Race
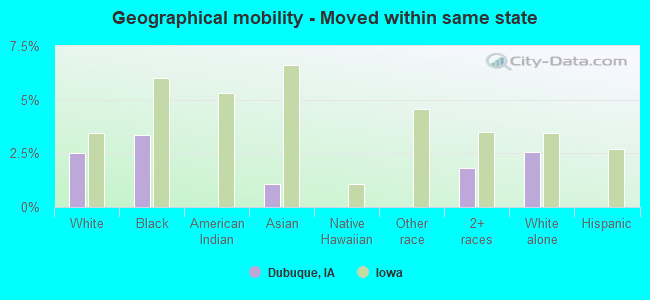
Geographical mobility - Moved from different county within same state (%)
Geographical mobility - Moved from different county within same state (%) - White
Geographical mobility - Moved from different county within same state (%) - Black or African American
Geographical mobility - Moved from different county within same state (%) - Asian
Geographical mobility - Moved from different county within same state (%) - Hispanic or Latino
Geographical mobility - Moved from different county within same state (%) - American Indian and Alaska Native
Geographical mobility - Moved from different county within same state (%) - Multirace
Geographical mobility - Moved from different county within same state (%) - Other Race
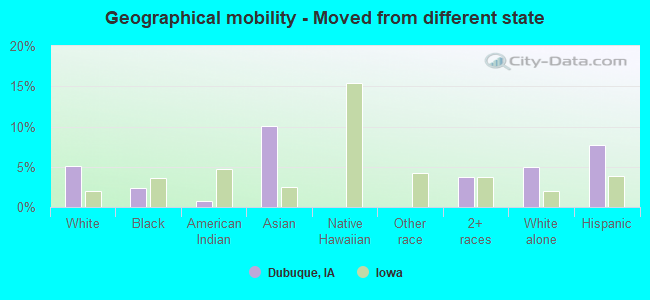
Geographical mobility - Moved from different state (%)
Geographical mobility - Moved from different state (%) - White
Geographical mobility - Moved from different state (%) - Black or African American
Geographical mobility - Moved from different state (%) - Asian
Geographical mobility - Moved from different state (%) - Hispanic or Latino
Geographical mobility - Moved from different state (%) - American Indian and Alaska Native
Geographical mobility - Moved from different state (%) - Multirace
Geographical mobility - Moved from different state (%) - Other Race
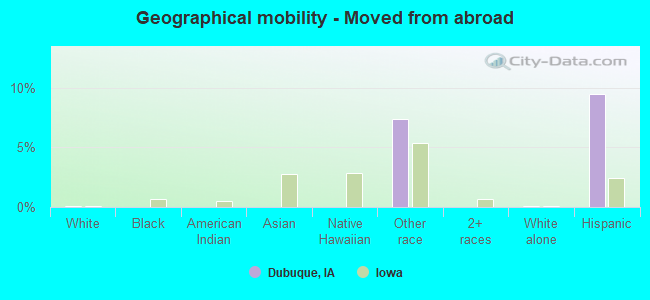
Geographical mobility - Moved from abroad (%)
Geographical mobility - Moved from abroad (%) - White
Geographical mobility - Moved from abroad (%) - Black or African American
Geographical mobility - Moved from abroad (%) - Asian
Geographical mobility - Moved from abroad (%) - Hispanic or Latino
Geographical mobility - Moved from abroad (%) - American Indian and Alaska Native
Geographical mobility - Moved from abroad (%) - Multirace
Geographical mobility - Moved from abroad (%) - Other Race
Place of birth for the foreign-born population - Ireland (%)
Place of birth for the foreign-born population - Denmark (%)
Place of birth for the foreign-born population - Norway (%)
Place of birth for the foreign-born population - Sweden (%)
Place of birth for the foreign-born population - United Kingdom (%)
Place of birth for the foreign-born population - England (%)
Place of birth for the foreign-born population - Scotland (%)
Place of birth for the foreign-born population - Other Northern Europe (%)
Place of birth for the foreign-born population - Austria (%)
Place of birth for the foreign-born population - Belgium (%)
Place of birth for the foreign-born population - France (%)
Place of birth for the foreign-born population - Germany (%)
Place of birth for the foreign-born population - Netherlands (%)
Place of birth for the foreign-born population - Switzerland (%)
Place of birth for the foreign-born population - Other Western Europe (%)
Place of birth for the foreign-born population - Greece (%)
Place of birth for the foreign-born population - Italy (%)
Place of birth for the foreign-born population - Portugal (%)
Place of birth for the foreign-born population - Spain (%)
Place of birth for the foreign-born population - Other Southern Europe (%)
Place of birth for the foreign-born population - Albania (%)
Place of birth for the foreign-born population - Belarus (%)
Place of birth for the foreign-born population - Bosnia and Herzegovina (%)
Place of birth for the foreign-born population - Bulgaria (%)
Place of birth for the foreign-born population - Croatia (%)
Place of birth for the foreign-born population - Czechoslovakia (%)
Place of birth for the foreign-born population - Hungary (%)
Place of birth for the foreign-born population - Latvia (%)
Place of birth for the foreign-born population - Lithuania (%)
Place of birth for the foreign-born population - North Macedonia (Macedonia) (%)
Place of birth for the foreign-born population - Moldova (%)
Place of birth for the foreign-born population - Poland (%)
Place of birth for the foreign-born population - Romania (%)
Place of birth for the foreign-born population - Russia (%)
Place of birth for the foreign-born population - Serbia (%)
Place of birth for the foreign-born population - Ukraine (%)
Place of birth for the foreign-born population - Other Eastern Europe (%)
Place of birth for the foreign-born population - China (%)
Place of birth for the foreign-born population - Hong Kong (%)
Place of birth for the foreign-born population - Taiwan (%)
Place of birth for the foreign-born population - Japan (%)
Place of birth for the foreign-born population - Korea (%)
Place of birth for the foreign-born population - Other Eastern Asia (%)
Place of birth for the foreign-born population - Afghanistan (%)
Place of birth for the foreign-born population - Bangladesh (%)
Place of birth for the foreign-born population - India (%)
Place of birth for the foreign-born population - Iran (%)
Place of birth for the foreign-born population - Kazakhstan (%)
Place of birth for the foreign-born population - Nepal (%)
Place of birth for the foreign-born population - Pakistan (%)
Place of birth for the foreign-born population - Sri Lanka (%)
Place of birth for the foreign-born population - Uzbekistan (%)
Place of birth for the foreign-born population - Other South Central Asia (%)
Place of birth for the foreign-born population - Burma (%)
Place of birth for the foreign-born population - Cambodia (%)
Place of birth for the foreign-born population - Indonesia (%)
Place of birth for the foreign-born population - Laos (%)
Place of birth for the foreign-born population - Malaysia (%)
Place of birth for the foreign-born population - Philippines (%)
Place of birth for the foreign-born population - Singapore (%)
Place of birth for the foreign-born population - Thailand (%)
Place of birth for the foreign-born population - Vietnam (%)
Place of birth for the foreign-born population - Other South Eastern Asia (%)
Place of birth for the foreign-born population - Armenia (%)
Place of birth for the foreign-born population - Iraq (%)
Place of birth for the foreign-born population - Israel (%)
Place of birth for the foreign-born population - Jordan (%)
Place of birth for the foreign-born population - Kuwait (%)
Place of birth for the foreign-born population - Lebanon (%)
Place of birth for the foreign-born population - Saudi Arabia (%)
Place of birth for the foreign-born population - Syria (%)
Place of birth for the foreign-born population - Turkey (%)
Place of birth for the foreign-born population - Yemen (%)
Place of birth for the foreign-born population - Other Western Asia (%)
Place of birth for the foreign-born population - Eritrea (%)
Place of birth for the foreign-born population - Ethiopia (%)
Place of birth for the foreign-born population - Kenya (%)
Place of birth for the foreign-born population - Somalia (%)
Place of birth for the foreign-born population - Uganda (%)
Place of birth for the foreign-born population - Zimbabwe (%)
Place of birth for the foreign-born population - Other Eastern Africa (%)
Place of birth for the foreign-born population - Cameroon (%)
Place of birth for the foreign-born population - Congo (%)
Place of birth for the foreign-born population - Democratic Republic of Congo (Zaire) (%)
Place of birth for the foreign-born population - Other Middle Africa (%)
Place of birth for the foreign-born population - Egypt (%)
Place of birth for the foreign-born population - Morocco (%)
Place of birth for the foreign-born population - Sudan (%)
Place of birth for the foreign-born population - Other Northern Africa (%)
Place of birth for the foreign-born population - South Africa (%)
Place of birth for the foreign-born population - Other Southern Africa (%)
Place of birth for the foreign-born population - Cabo Verde (%)
Place of birth for the foreign-born population - Ghana (%)
Place of birth for the foreign-born population - Liberia (%)
Place of birth for the foreign-born population - Nigeria (%)
Place of birth for the foreign-born population - Senegal (%)
Place of birth for the foreign-born population - Sierra Leone (%)
Place of birth for the foreign-born population - Other Western Africa (%)
Place of birth for the foreign-born population - Australia (%)
Place of birth for the foreign-born population - New Zealand (%)
Place of birth for the foreign-born population - Fiji (%)
Place of birth for the foreign-born population - Micronesia (%)
Place of birth for the foreign-born population - Bahamas (%)
Place of birth for the foreign-born population - Barbados (%)
Place of birth for the foreign-born population - Cuba (%)
Place of birth for the foreign-born population - Dominica (%)
Place of birth for the foreign-born population - Dominican Republic (%)
Place of birth for the foreign-born population - Grenada (%)
Place of birth for the foreign-born population - Haiti (%)
Place of birth for the foreign-born population - Jamaica (%)
Place of birth for the foreign-born population - St. Vincent and the Grenadines (%)
Place of birth for the foreign-born population - Trinidad and Tobago (%)
Place of birth for the foreign-born population - West Indies (%)
Place of birth for the foreign-born population - Other Caribbean (%)
Place of birth for the foreign-born population - Belize (%)
Place of birth for the foreign-born population - Costa Rica (%)
Place of birth for the foreign-born population - El Salvador (%)
Place of birth for the foreign-born population - Guatemala (%)
Place of birth for the foreign-born population - Honduras (%)
Place of birth for the foreign-born population - Mexico (%)
Place of birth for the foreign-born population - Nicaragua (%)
Place of birth for the foreign-born population - Panama (%)
Place of birth for the foreign-born population - Other Central America (%)
Place of birth for the foreign-born population - Argentina (%)
Place of birth for the foreign-born population - Bolivia (%)
Place of birth for the foreign-born population - Brazil (%)
Place of birth for the foreign-born population - Chile (%)
Place of birth for the foreign-born population - Colombia (%)
Place of birth for the foreign-born population - Ecuador (%)
Place of birth for the foreign-born population - Guyana (%)
Place of birth for the foreign-born population - Peru (%)
Place of birth for the foreign-born population - Uruguay (%)
Place of birth for the foreign-born population - Venezuela (%)
Place of birth for the foreign-born population - Other South America (%)
Place of birth for the foreign-born population - Canada (%)
Place of birth for the foreign-born population - Other Northern America (%)
Place of birth for the foreign-born population - Other (%)
Latest news about races in Dubuque, IA collected exclusively by city-data.com from local newspapers, TV, and radio stations
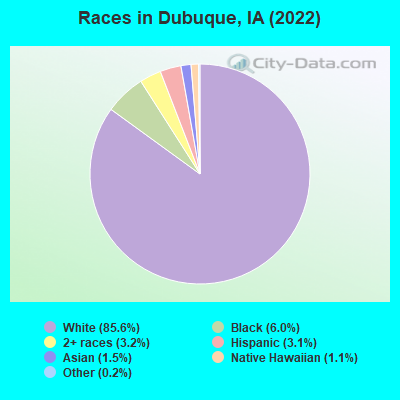
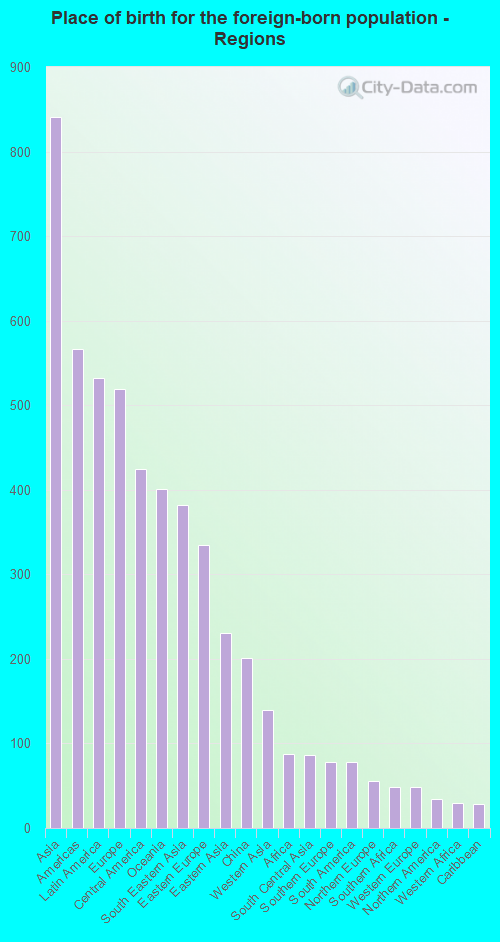
According to 2022 data, the most numerous races in Dubuque, IA are White alone (50,713 residents), Hispanic (1,812 residents), and Black alone (3,537 residents). 93.3% of Dubuque residents speak English at home. 4.1% of Dubuque, IA residents are foreign-born (1.4% born in Asia, 0.9% born in Latin America, 0.9% born in Europe, 0.7% born in Oceania), which is 22.5% less than the foreign-born rate of 5.0% across the entire state of Iowa.
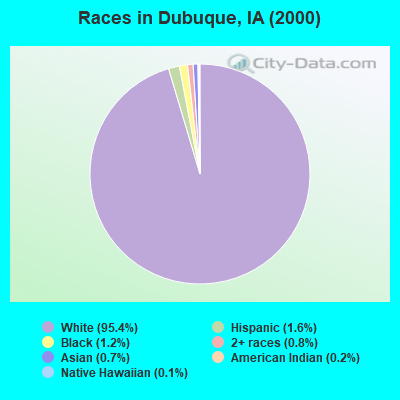
Race distribution in Dubuque
2000 2022
2,710,344 92.6% White alone 82,473 2.8% Hispanic 60,744 2.1% Black alone 36,345 1.2% Asian alone 25,472 0.9% Two or more races 7,955 0.3% American Indian alone 2,103 0.07% Other race alone 888 0.03% Native Hawaiian and Other
2,650,110 82.8% White alone 218,024 6.8% Hispanic 119,004 3.7% Black alone 115,286 3.6% Two or more races 74,892 2.3% Asian alone 9,260 0.3% Other race alone 8,595 0.3% Native Hawaiian and Other 5,346 0.2% American Indian alone
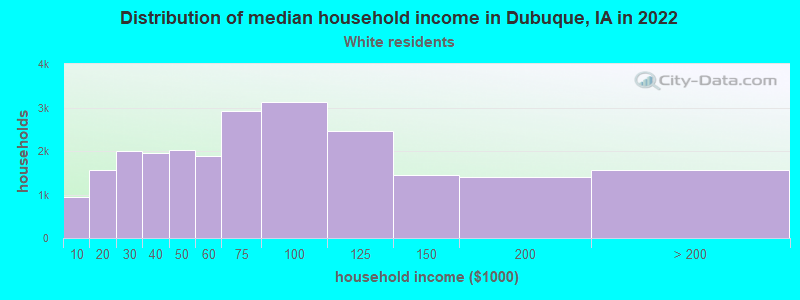
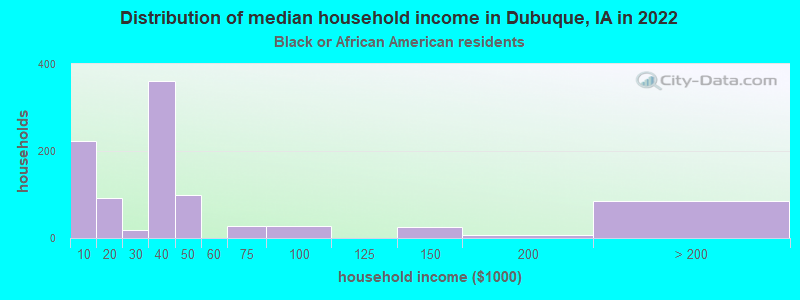
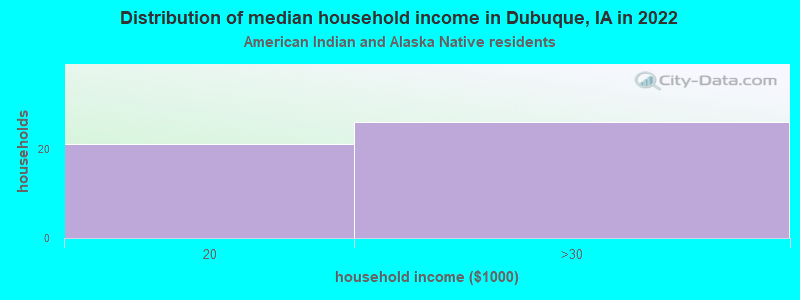
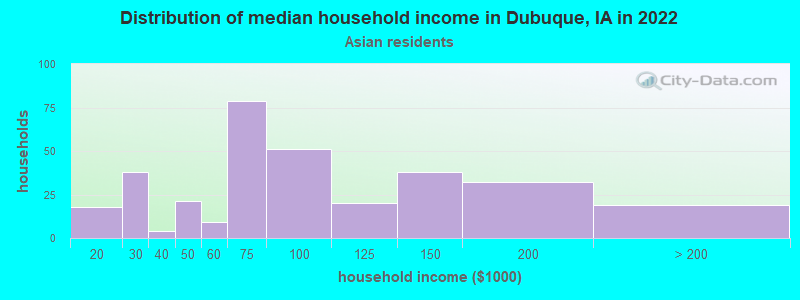
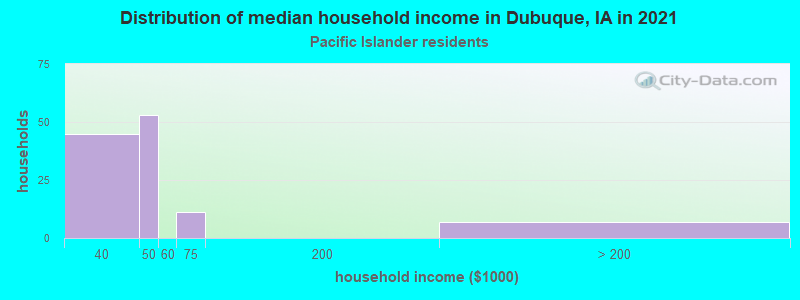
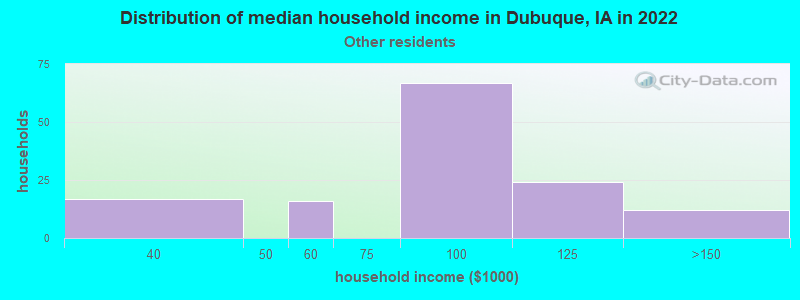
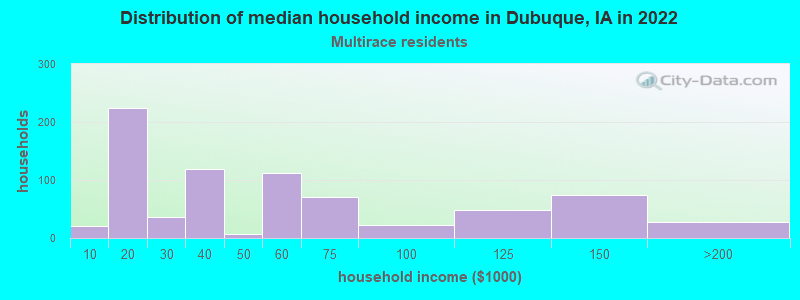
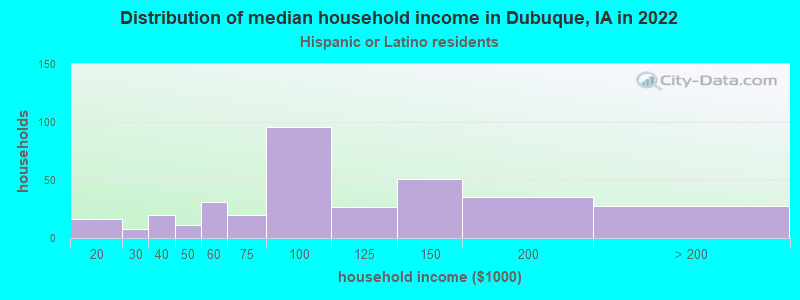
Income and house value in Dubuque Median household income in 2022 $64,478 White non-Hispanic householders$24,121 Black householders$108,574 Asian householders$43,665 Native Hawaiian and other Pacific Islander householders$96,060 Some other race householders$39,304 Two or more races householders$147,615 Hispanic or Latino race householdersMedian 2022 house value $194,677 White Non-Hispanic householders$216,039 Black or African American householders$143,145 American Indian or Alaska Native householders $367,112 Asian householders$49,550 Some other race householders$105,046 Two or more races householders$132,133 Hispanic or Latino householders
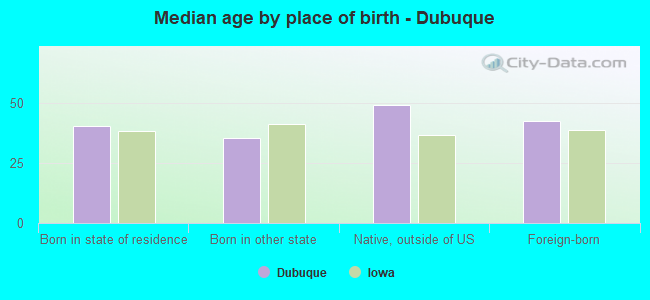
Median age by race in Dubuque
42.8 Median age for White residents40.5 45.4 23.6 Median age for Black or African American residents26.8 18.3 26.2 Median age for American Indian / Alaska Native residents-654,282,765.1 26.5 42.1 Median age for Asian residents36.6 39.9 18.9 Median age for Native Hawaiian / Pacific Islander residents32.7 11.8 34.0 Median age for Other race residents41.2 17.2 23.4 Median age for Two or more races residents20.3 29.1 43.1 Median age for White alone residents40.8 45.3 24.0 Median age for Hispanic or Latino residents29.9 20.6
Owner/renter occupied households by race in Dubuque
House owners and renters - White residents 15,827 67.7% Owner occupied7,567 32.3% Renter occupiedHouse owners and renters - Black or African American residents 163 18.5% Owner occupied720 81.5% Renter occupiedHouse owners and renters - American Indian / Alaska Native residents 19 41.9% Owner occupied27 58.1% Renter occupiedHouse owners and renters - Asian residents 189 52.6% Owner occupied170 47.4% Renter occupiedHouse owners and renters - Native Hawaiian / Pacific Islander residents 27 19.8% Owner occupied109 80.2% Renter occupiedHouse owners and renters - Other race residents 44 32.2% Owner occupied94 67.8% Renter occupiedHouse owners and renters - Two or more races residents 216 23.8% Owner occupied692 76.2% Renter occupiedHouse owners and renters - White alone residents 15,836 67.8% Owner occupied7,520 32.2% Renter occupiedHouse owners and renters - Hispanic or Latino residents 151 35.6% Owner occupied273 64.4% Renter occupied
Language usage in Dubuque
English speakers - Total 93.3% of residents of Dubuque speak English at home.
3.0% of residents speak Spanish at home 1,392 82.5% Speak English very well295 17.5% Speak English less than very well4.1% of residents speak other language at home 1,130 49.4% Speak English very well1,157 50.6% Speak English less than very well
English speakers - Born in the United States 96.8% of residents of Dubuque speak English at home.
3.0% of residents speak Spanish at home 468 97.9% Speak English very well10 2.1% Speak English less than very well0.3% of residents speak other language at home 37 82.2% Speak English very well8 17.8% Speak English less than very well
English speakers - Native, born elsewhere 86.6% of residents of Dubuque speak English at home.
11.8% of residents speak Spanish at home 30 96.8% Speak English very well1 3.2% Speak English less than very well4.2% of residents speak other language at home 11 100.0% Speak English very well
English speakers - Foreign-born 12.0% of residents of Dubuque speak English at home.
26.7% of residents speak Spanish at home 589 67.9% Speak English very well279 32.1% Speak English less than very well63.2% of residents speak other language at home 948 46.1% Speak English very well1,110 53.9% Speak English less than very well
White (Caucasian) - Speak only English Native:
99.0% (46,861)Foreign-born:
10.3% (157)
White (Caucasian) - Speak another language Native:
1.0% (465)Foreign-born:
90.8% (1,388)
Black or African American - Speak only English Native:
98.8% (2,181)Foreign-born:
43.4% (47)
Black or African American - Speak another language Native:
1.2% (27)Foreign-born:
41.1% (44)
Asian - Speak only English Native:
76.2% (155)Foreign-born:
26.8% (188)
Asian - Speak another language Native:
25.2% (51)Foreign-born:
74.6% (522)
Other race - Speak only English Native:
58.6% (165)Foreign-born:
4.4% (16)
Other race - Speak another language Native:
43.0% (121)Foreign-born:
97.2% (363)
Two or more races - Speak another language Native:
12.5% (248)Foreign-born:
100.0% (347)
White alone - Speak only English Native:
99.0% (46,679)Foreign-born:
12.3% (162)
White alone - Speak another language Native:
1.0% (457)Foreign-born:
89.7% (1,178)
Hispanic or Latino - Speak only English Native:
48.4% (494)Foreign-born:
2.2% (19)
Hispanic or Latino - Speak another language Native:
50.4% (514)Foreign-born:
99.6% (856)
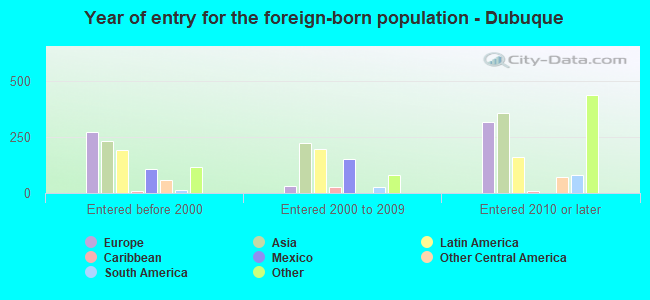
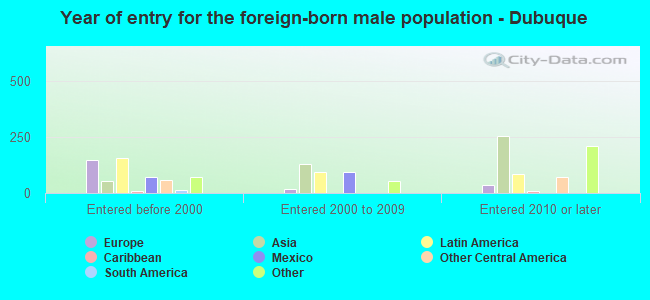
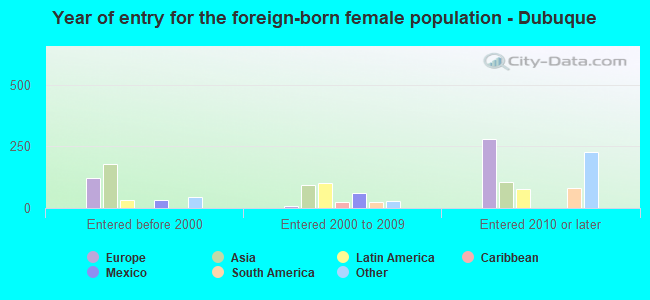
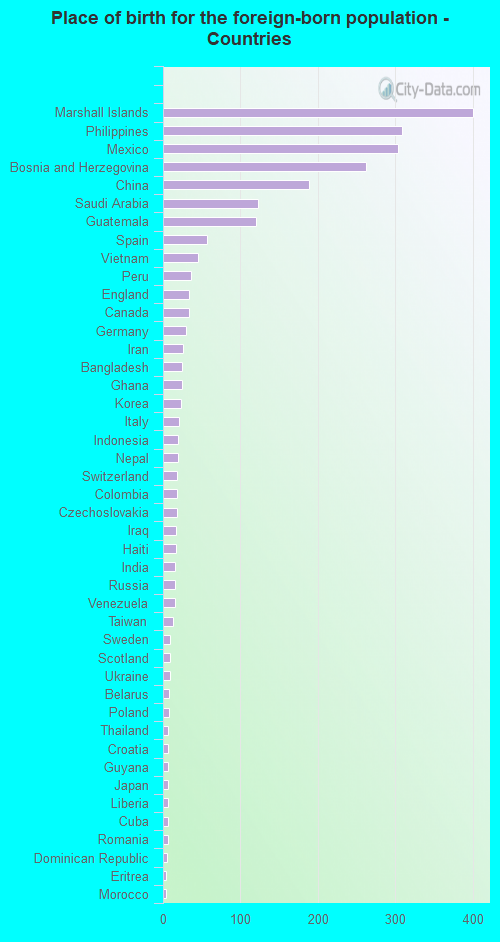
Foreign-born residents in Dubuque 2,418 residents are foreign born (1.4% Asia , 0.9% Latin America , 0.9% Europe , 0.7% Oceania ).
Marital status for residents in Dubuque Marital status - White (Caucasian) population 15 years and over
Males 40.5% Never married48.3% Now married0.6% Separated2.1% Widowed8.5% DivorcedFemales 33.5% Never married43.7% Now married1.0% Separated9.7% Widowed12.1% DivorcedWomen who gave birth in the past 12 months Now married:
64.9% (339)Unmarried:
35.1% (183)
Women who did not give birth in the past 12 months Now married:
35.7% (3,755)Unmarried:
64.3% (6,765)
Marital status - Black or African American population 15 years and over
Males 81.3% Never married8.1% Now married1.4% Separated0.0% Widowed9.2% DivorcedFemales 57.4% Never married18.2% Now married0.0% Separated1.8% Widowed22.6% DivorcedWomen who did not give birth in the past 12 months Now married:
18.5% (126)Unmarried:
81.5% (556)
Marital status - American Indian / Alaska Native population 15 years and over
Males 38.5% Never married0.0% Now married61.5% Separated0.0% Widowed0.0% DivorcedFemales 69.2% Never married30.8% Now married0.0% Separated0.0% Widowed0.0% DivorcedWomen who did not give birth in the past 12 months Now married:
0.0% (0)Unmarried:
100.0% (57)
Marital status - Asian population 15 years and over
Males 43.5% Never married53.2% Now married2.4% Separated0.9% Widowed0.0% DivorcedFemales 39.9% Never married40.5% Now married2.4% Separated4.3% Widowed12.8% DivorcedWomen who did not give birth in the past 12 months Now married:
28.9% (69)Unmarried:
71.1% (170)
Marital status - Native Hawaiian / Pacific Islander population 15 years and over
Males 52.5% Never married36.3% Now married0.0% Separated11.2% Widowed0.0% DivorcedFemales 58.9% Never married36.2% Now married0.0% Separated0.0% Widowed4.9% DivorcedWomen who did not give birth in the past 12 months Now married:
16.5% (33)Unmarried:
83.5% (166)
Marital status - Other race population 15 years and over
Males 61.2% Never married34.8% Now married0.0% Separated0.0% Widowed4.0% DivorcedFemales 59.2% Never married40.8% Now married0.0% Separated0.0% Widowed0.0% DivorcedWomen who did not give birth in the past 12 months Now married:
26.5% (28)Unmarried:
73.5% (79)
Marital status - Two or more races population 15 years and over
Males 79.7% Never married20.3% Now married0.0% Separated0.0% Widowed0.0% DivorcedFemales 54.0% Never married41.1% Now married0.0% Separated0.0% Widowed5.0% DivorcedWomen who gave birth in the past 12 months Now married:
100.0% (181)Unmarried:
0.0% (0)
Women who did not give birth in the past 12 months Now married:
25.2% (222)Unmarried:
74.8% (660)
Marital status - White alone, not Hispanic / Latino population 15 years and over
Males 40.5% Never married48.3% Now married0.6% Separated2.1% Widowed8.5% DivorcedFemales 33.2% Never married43.8% Now married1.0% Separated9.9% Widowed12.1% DivorcedWomen who gave birth in the past 12 months Now married:
64.9% (344)Unmarried:
35.1% (186)
Women who did not give birth in the past 12 months Now married:
35.7% (3,716)Unmarried:
64.3% (6,694)
Marital status - Hispanic or Latino population 15 years and over
Males 57.8% Never married37.6% Now married0.0% Separated1.2% Widowed3.4% DivorcedFemales 50.3% Never married46.7% Now married0.0% Separated0.0% Widowed3.0% DivorcedWomen who did not give birth in the past 12 months Now married:
36.3% (182)Unmarried:
63.7% (319)
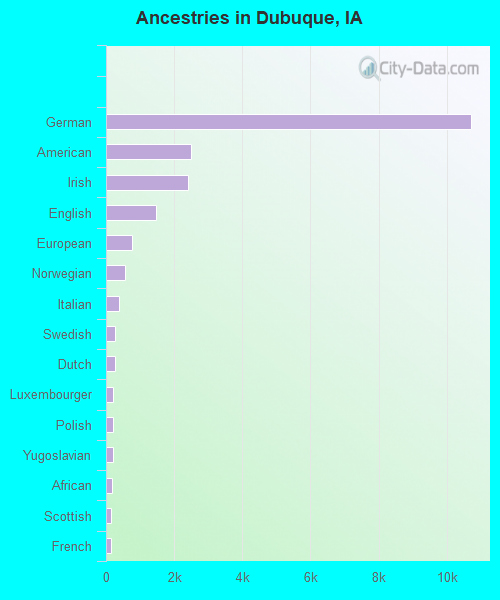
Ancestries in Dubuque
10,704 40.1% German2,505 9.4% American2,403 9.0% Irish1,468 5.5% English770 2.9% European564 2.1% Norwegian368 1.4% Italian277 1.0% Swedish264 1.0% Dutch219 0.8% Luxembourger207 0.8% Polish197 0.7% Yugoslavian186 0.7% African153 0.6% Scottish142 0.5% French84 0.3% Greek74 0.3% Czech67 0.3% French Canadian60 0.2% Iranian60 0.2% Swiss59 0.2% Danish53 0.2% Arab49 0.2% Scandinavian45 0.2% Scotch-Irish43 0.2% Northern European36 0.1% Welsh25 0.09% Slovak23 0.09% British22 0.08% Belgian21 0.08% Czechoslovakian18 0.07% Russian18 0.07% Haitian16 0.06% Eastern European11 0.04% Brazilian11 0.04% Lithuanian10 0.04% Lebanese9 0.03% Ghanaian9 0.03% Ukrainian8 0.03% Romanian8 0.03% Croatian7 0.03% Iraqi6 0.02% Austrian5 0.02% Hungarian5 0.02% Somali4 0.01% German Russian4 0.01% Egyptian2 0.01% Slovene2 0.01% Syrian2 0.01% Nigerian
Geographical mobility in Dubuque Same house 1 year ago 43,678 86.0% White (Caucasian)1,990 82.5% Black or African American123 100.0% American Indian / Alaska Native737 82.2% Asian700 98.2% Native Hawaiian / Pacific Islander480 74.6% Other race3,132 89.7% Two or more races43,258 86.0% White alone, not Hispanic / Latino1,340 76.1% Hispanic or LatinoMoved within same county 3,339 6.6% White / Caucasian281 11.6% Black or African American32 3.6% Asian19 2.7% Native Hawaiian / Pacific Islander99 15.3% Other race186 5.3% Two or more races3,344 6.6% White alone, not Hispanic / Latino191 10.8% Hispanic or LatinoMoved within same state 1,279 2.5% White / Caucasian81 3.4% Black or African American10 1.1% Asian64 1.8% Two or more races1,279 2.5% White alone, not Hispanic / LatinoMoved from different state 2,569 5.1% White / Caucasian56 2.3% Black or African American1 0.8% American Indian / Alaska Native90 10.0% Asian131 3.8% Two or more races2,492 5.0% White alone, not Hispanic / Latino136 7.7% Hispanic or LatinoMoved from abroad 57 0.1% White48 7.4% Other race33 0.1% White alone, not Hispanic / Latino166 9.4% Hispanic or Latino
Children Nativity (place of birth) in Dubuque
Children under 6 years - Living with two parents Both parents native 2,420 100.0% Native0 0.0% Foreign-bornBoth parents foreign-born 36 74.2% Native13 25.8% Foreign-bornOne native, one foreign-born parent 124 100.0% NativeChildren under 6 years - Living with one parent Native parent 1,024 100.0% NativeForeign-born parent 63 100.0% NativeChildren 6 to 17 years - Living with two parents Both parents native 4,022 100.0% NativeBoth parents foreign-born 254 66.6% Native128 33.4% Foreign-bornOne native, one foreign-born parent 139 100.0% NativeChildren 6 to 17 years - Living with one parent Native parent 2,354 100.0% NativeForeign-born parent 237 62.1% Native145 37.9% Foreign-born
Grandparents responsible for own grandchildren in Dubuque
Grandparents (30 to 59 years) White / Caucasian 28 65.7% Responsible for grandchildren15 34.3% Not responsible for grandchildrenNative Hawaiian / Pacific Islander 27 100.0% Not responsible for grandchildrenOther race 11 100.0% Responsible for grandchildrenWhite alone, not Hispanic / Latino 29 62.7% Responsible for grandchildren17 37.3% Not responsible for grandchildrenHispanic or Latino 8 100.0% Responsible for grandchildrenGrandparents (60 years and over) White / Caucasian 189 48.8% Responsible for grandchildren198 51.2% Not responsible for grandchildrenNative Hawaiian / Pacific Islander 42 100.0% Not responsible for grandchildrenWhite alone, not Hispanic / Latino 190 47.8% Responsible for grandchildren207 52.2% Not responsible for grandchildren