Races in Duncanville, Texas (TX) Detailed Stats
Data:
Races - White alone (%)
Races - White alone (% change since 2000)
Races - Black alone (%)
Races - Black alone (% change since 2000)
Races - American Indian alone (%)
Races - American Indian alone (% change since 2000)
Races - Asian alone (%)
Races - Asian alone (% change since 2000)
Races - Hispanic (%)
Races - Hispanic (% change since 2000)
Races - Native Hawaiian and Other Pacific Islander alone (%)
Races - Native Hawaiian and Other Pacific Islander alone (% change since 2000)
Races - Two or more races(%)
Races - Two or more races(% change since 2000)
Races - Other race alone (%)
Races - Other race alone (% change since 2000)
Racial diversity
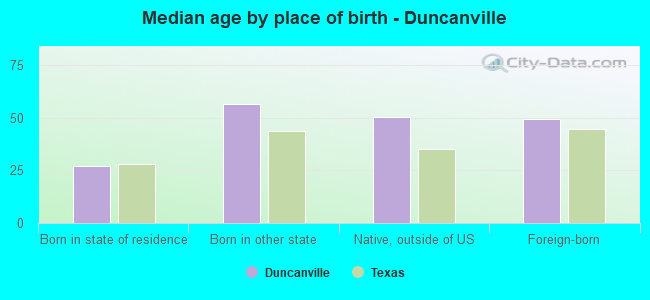
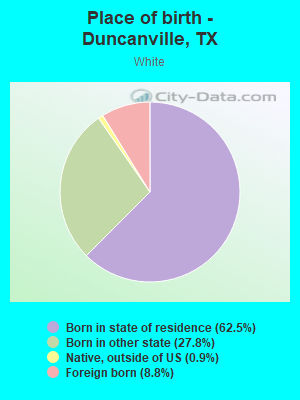
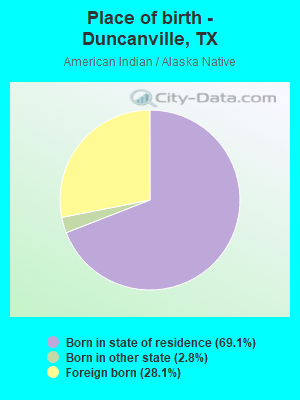
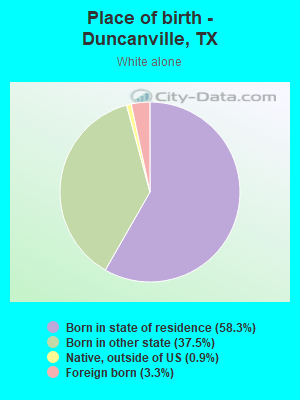
Place of birth - Born in state of residence (%)
Place of birth - Born in state of residence (%) - White
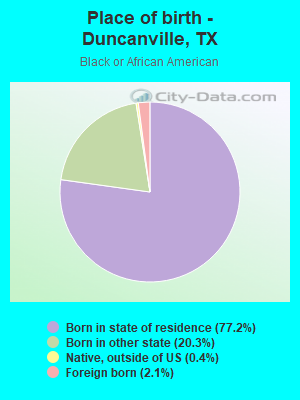
Place of birth - Born in state of residence (%) - Black or African American
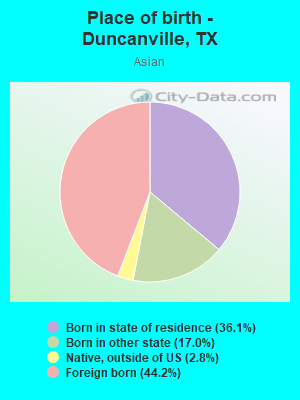
Place of birth - Born in state of residence (%) - Asian
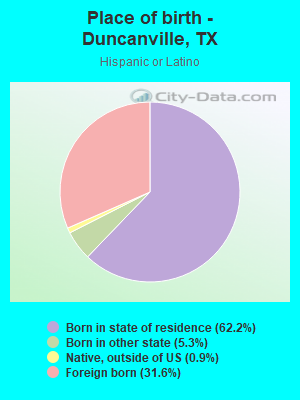
Place of birth - Born in state of residence (%) - Hispanic or Latino
Place of birth - Born in state of residence (%) - American Indian and Alaska Native
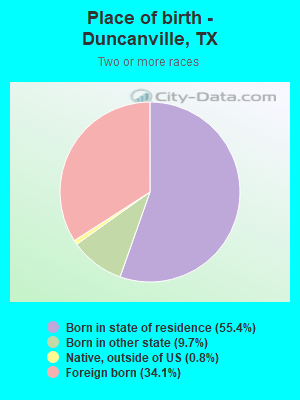
Place of birth - Born in state of residence (%) - Multirace
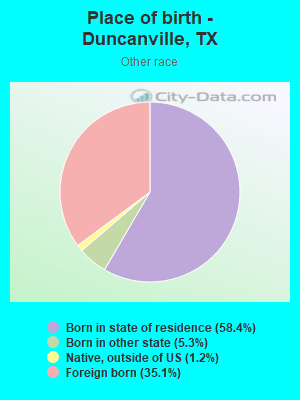
Place of birth - Born in state of residence (%) - Other Race
Place of birth - Born in other state (%)
Place of birth - Born in other state (%) - White
Place of birth - Born in other state (%) - Black or African American
Place of birth - Born in other state (%) - Asian
Place of birth - Born in other state (%) - Hispanic or Latino
Place of birth - Born in other state (%) - American Indian and Alaska Native
Place of birth - Born in other state (%) - Multirace
Place of birth - Born in other state (%) - Other Race
Place of birth - Native, outside of US (%)
Place of birth - Native, outside of US (%) - White
Place of birth - Native, outside of US (%) - Black or African American
Place of birth - Native, outside of US (%) - Asian
Place of birth - Native, outside of US (%) - Hispanic or Latino
Place of birth - Native, outside of US (%) - American Indian and Alaska Native
Place of birth - Native, outside of US (%) - Multirace
Place of birth - Native, outside of US (%) - Other Race
Place of birth - Foreign born (%)
Place of birth - Foreign born (%) - White
Place of birth - Foreign born (%) - Black or African American
Place of birth - Foreign born (%) - Asian
Place of birth - Foreign born (%) - Hispanic or Latino
Place of birth - Foreign born (%) - American Indian and Alaska Native
Place of birth - Foreign born (%) - Multirace
Place of birth - Foreign born (%) - Other Race
Residents speaking English at home (%)
Residents speaking English at home - Born in the United States (%)
Residents speaking English at home - Native, born elsewhere (%)
Residents speaking English at home - Foreign born (%)
Residents speaking Spanish at home (%)
Residents speaking Spanish at home - Born in the United States (%)
Residents speaking Spanish at home - Native, born elsewhere (%)
Residents speaking Spanish at home - Foreign born (%)
Residents speaking other language at home (%)
Residents speaking other language at home - Born in the United States (%)
Residents speaking other language at home - Native, born elsewhere (%)
Residents speaking other language at home - Foreign born (%)
Marital status - Never married (%)
Marital status - Now married (%)
Marital status - Separated (%)
Marital status - Widowed (%)
Marital status - Divorced (%)
Ancestries Reported - Arab (%)
Ancestries Reported - Czech (%)
Ancestries Reported - Danish (%)
Ancestries Reported - Dutch (%)
Ancestries Reported - English (%)
Ancestries Reported - French (%)
Ancestries Reported - French Canadian (%)
Ancestries Reported - German (%)
Ancestries Reported - Greek (%)
Ancestries Reported - Hungarian (%)
Ancestries Reported - Irish (%)
Ancestries Reported - Italian (%)
Ancestries Reported - Lithuanian (%)
Ancestries Reported - Norwegian (%)
Ancestries Reported - Polish (%)
Ancestries Reported - Portuguese (%)
Ancestries Reported - Russian (%)
Ancestries Reported - Scotch-Irish (%)
Ancestries Reported - Scottish (%)
Ancestries Reported - Slovak (%)
Ancestries Reported - Subsaharan African (%)
Ancestries Reported - Swedish (%)
Ancestries Reported - Swiss (%)
Ancestries Reported - Ukrainian (%)
Ancestries Reported - United States (%)
Ancestries Reported - Welsh (%)
Ancestries Reported - West Indian (%)
Ancestries Reported - Other (%)
Geographical mobility - Same house 1 year ago (%)
Geographical mobility - Same house 1 year ago (%) - White
Geographical mobility - Same house 1 year ago (%) - Black or African American
Geographical mobility - Same house 1 year ago (%) - Asian
Geographical mobility - Same house 1 year ago (%) - Hispanic or Latino
Geographical mobility - Same house 1 year ago (%) - American Indian and Alaska Native
Geographical mobility - Same house 1 year ago (%) - Multirace
Geographical mobility - Same house 1 year ago (%) - Other Race
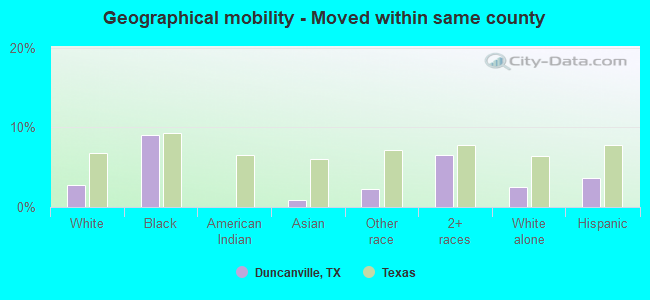
Geographical mobility - Moved within same county (%)
Geographical mobility - Moved within same county (%) - White
Geographical mobility - Moved within same county (%) - Black or African American
Geographical mobility - Moved within same county (%) - Asian
Geographical mobility - Moved within same county (%) - Hispanic or Latino
Geographical mobility - Moved within same county (%) - American Indian and Alaska Native
Geographical mobility - Moved within same county (%) - Multirace
Geographical mobility - Moved within same county (%) - Other Race
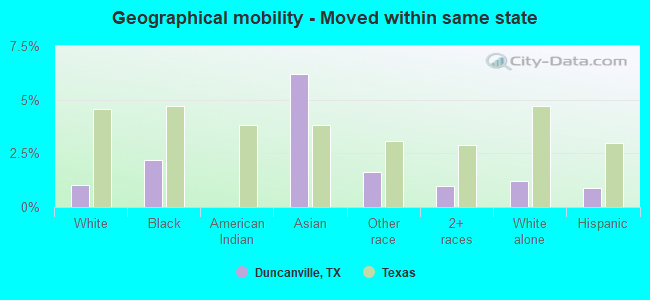
Geographical mobility - Moved from different county within same state (%)
Geographical mobility - Moved from different county within same state (%) - White
Geographical mobility - Moved from different county within same state (%) - Black or African American
Geographical mobility - Moved from different county within same state (%) - Asian
Geographical mobility - Moved from different county within same state (%) - Hispanic or Latino
Geographical mobility - Moved from different county within same state (%) - American Indian and Alaska Native
Geographical mobility - Moved from different county within same state (%) - Multirace
Geographical mobility - Moved from different county within same state (%) - Other Race
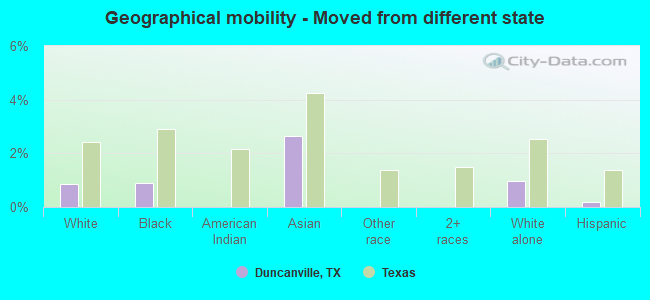
Geographical mobility - Moved from different state (%)
Geographical mobility - Moved from different state (%) - White
Geographical mobility - Moved from different state (%) - Black or African American
Geographical mobility - Moved from different state (%) - Asian
Geographical mobility - Moved from different state (%) - Hispanic or Latino
Geographical mobility - Moved from different state (%) - American Indian and Alaska Native
Geographical mobility - Moved from different state (%) - Multirace
Geographical mobility - Moved from different state (%) - Other Race
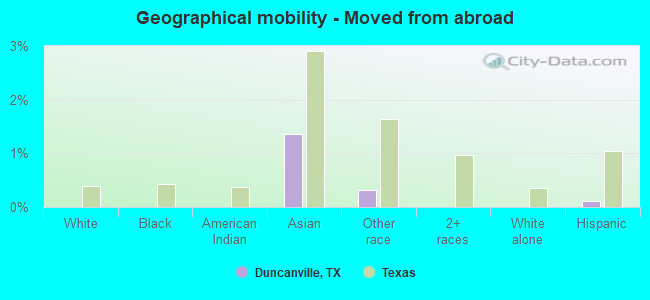
Geographical mobility - Moved from abroad (%)
Geographical mobility - Moved from abroad (%) - White
Geographical mobility - Moved from abroad (%) - Black or African American
Geographical mobility - Moved from abroad (%) - Asian
Geographical mobility - Moved from abroad (%) - Hispanic or Latino
Geographical mobility - Moved from abroad (%) - American Indian and Alaska Native
Geographical mobility - Moved from abroad (%) - Multirace
Geographical mobility - Moved from abroad (%) - Other Race
Place of birth for the foreign-born population - Ireland (%)
Place of birth for the foreign-born population - Denmark (%)
Place of birth for the foreign-born population - Norway (%)
Place of birth for the foreign-born population - Sweden (%)
Place of birth for the foreign-born population - United Kingdom (%)
Place of birth for the foreign-born population - England (%)
Place of birth for the foreign-born population - Scotland (%)
Place of birth for the foreign-born population - Other Northern Europe (%)
Place of birth for the foreign-born population - Austria (%)
Place of birth for the foreign-born population - Belgium (%)
Place of birth for the foreign-born population - France (%)
Place of birth for the foreign-born population - Germany (%)
Place of birth for the foreign-born population - Netherlands (%)
Place of birth for the foreign-born population - Switzerland (%)
Place of birth for the foreign-born population - Other Western Europe (%)
Place of birth for the foreign-born population - Greece (%)
Place of birth for the foreign-born population - Italy (%)
Place of birth for the foreign-born population - Portugal (%)
Place of birth for the foreign-born population - Spain (%)
Place of birth for the foreign-born population - Other Southern Europe (%)
Place of birth for the foreign-born population - Albania (%)
Place of birth for the foreign-born population - Belarus (%)
Place of birth for the foreign-born population - Bosnia and Herzegovina (%)
Place of birth for the foreign-born population - Bulgaria (%)
Place of birth for the foreign-born population - Croatia (%)
Place of birth for the foreign-born population - Czechoslovakia (%)
Place of birth for the foreign-born population - Hungary (%)
Place of birth for the foreign-born population - Latvia (%)
Place of birth for the foreign-born population - Lithuania (%)
Place of birth for the foreign-born population - North Macedonia (Macedonia) (%)
Place of birth for the foreign-born population - Moldova (%)
Place of birth for the foreign-born population - Poland (%)
Place of birth for the foreign-born population - Romania (%)
Place of birth for the foreign-born population - Russia (%)
Place of birth for the foreign-born population - Serbia (%)
Place of birth for the foreign-born population - Ukraine (%)
Place of birth for the foreign-born population - Other Eastern Europe (%)
Place of birth for the foreign-born population - China (%)
Place of birth for the foreign-born population - Hong Kong (%)
Place of birth for the foreign-born population - Taiwan (%)
Place of birth for the foreign-born population - Japan (%)
Place of birth for the foreign-born population - Korea (%)
Place of birth for the foreign-born population - Other Eastern Asia (%)
Place of birth for the foreign-born population - Afghanistan (%)
Place of birth for the foreign-born population - Bangladesh (%)
Place of birth for the foreign-born population - India (%)
Place of birth for the foreign-born population - Iran (%)
Place of birth for the foreign-born population - Kazakhstan (%)
Place of birth for the foreign-born population - Nepal (%)
Place of birth for the foreign-born population - Pakistan (%)
Place of birth for the foreign-born population - Sri Lanka (%)
Place of birth for the foreign-born population - Uzbekistan (%)
Place of birth for the foreign-born population - Other South Central Asia (%)
Place of birth for the foreign-born population - Burma (%)
Place of birth for the foreign-born population - Cambodia (%)
Place of birth for the foreign-born population - Indonesia (%)
Place of birth for the foreign-born population - Laos (%)
Place of birth for the foreign-born population - Malaysia (%)
Place of birth for the foreign-born population - Philippines (%)
Place of birth for the foreign-born population - Singapore (%)
Place of birth for the foreign-born population - Thailand (%)
Place of birth for the foreign-born population - Vietnam (%)
Place of birth for the foreign-born population - Other South Eastern Asia (%)
Place of birth for the foreign-born population - Armenia (%)
Place of birth for the foreign-born population - Iraq (%)
Place of birth for the foreign-born population - Israel (%)
Place of birth for the foreign-born population - Jordan (%)
Place of birth for the foreign-born population - Kuwait (%)
Place of birth for the foreign-born population - Lebanon (%)
Place of birth for the foreign-born population - Saudi Arabia (%)
Place of birth for the foreign-born population - Syria (%)
Place of birth for the foreign-born population - Turkey (%)
Place of birth for the foreign-born population - Yemen (%)
Place of birth for the foreign-born population - Other Western Asia (%)
Place of birth for the foreign-born population - Eritrea (%)
Place of birth for the foreign-born population - Ethiopia (%)
Place of birth for the foreign-born population - Kenya (%)
Place of birth for the foreign-born population - Somalia (%)
Place of birth for the foreign-born population - Uganda (%)
Place of birth for the foreign-born population - Zimbabwe (%)
Place of birth for the foreign-born population - Other Eastern Africa (%)
Place of birth for the foreign-born population - Cameroon (%)
Place of birth for the foreign-born population - Congo (%)
Place of birth for the foreign-born population - Democratic Republic of Congo (Zaire) (%)
Place of birth for the foreign-born population - Other Middle Africa (%)
Place of birth for the foreign-born population - Egypt (%)
Place of birth for the foreign-born population - Morocco (%)
Place of birth for the foreign-born population - Sudan (%)
Place of birth for the foreign-born population - Other Northern Africa (%)
Place of birth for the foreign-born population - South Africa (%)
Place of birth for the foreign-born population - Other Southern Africa (%)
Place of birth for the foreign-born population - Cabo Verde (%)
Place of birth for the foreign-born population - Ghana (%)
Place of birth for the foreign-born population - Liberia (%)
Place of birth for the foreign-born population - Nigeria (%)
Place of birth for the foreign-born population - Senegal (%)
Place of birth for the foreign-born population - Sierra Leone (%)
Place of birth for the foreign-born population - Other Western Africa (%)
Place of birth for the foreign-born population - Australia (%)
Place of birth for the foreign-born population - New Zealand (%)
Place of birth for the foreign-born population - Fiji (%)
Place of birth for the foreign-born population - Micronesia (%)
Place of birth for the foreign-born population - Bahamas (%)
Place of birth for the foreign-born population - Barbados (%)
Place of birth for the foreign-born population - Cuba (%)
Place of birth for the foreign-born population - Dominica (%)
Place of birth for the foreign-born population - Dominican Republic (%)
Place of birth for the foreign-born population - Grenada (%)
Place of birth for the foreign-born population - Haiti (%)
Place of birth for the foreign-born population - Jamaica (%)
Place of birth for the foreign-born population - St. Vincent and the Grenadines (%)
Place of birth for the foreign-born population - Trinidad and Tobago (%)
Place of birth for the foreign-born population - West Indies (%)
Place of birth for the foreign-born population - Other Caribbean (%)
Place of birth for the foreign-born population - Belize (%)
Place of birth for the foreign-born population - Costa Rica (%)
Place of birth for the foreign-born population - El Salvador (%)
Place of birth for the foreign-born population - Guatemala (%)
Place of birth for the foreign-born population - Honduras (%)
Place of birth for the foreign-born population - Mexico (%)
Place of birth for the foreign-born population - Nicaragua (%)
Place of birth for the foreign-born population - Panama (%)
Place of birth for the foreign-born population - Other Central America (%)
Place of birth for the foreign-born population - Argentina (%)
Place of birth for the foreign-born population - Bolivia (%)
Place of birth for the foreign-born population - Brazil (%)
Place of birth for the foreign-born population - Chile (%)
Place of birth for the foreign-born population - Colombia (%)
Place of birth for the foreign-born population - Ecuador (%)
Place of birth for the foreign-born population - Guyana (%)
Place of birth for the foreign-born population - Peru (%)
Place of birth for the foreign-born population - Uruguay (%)
Place of birth for the foreign-born population - Venezuela (%)
Place of birth for the foreign-born population - Other South America (%)
Place of birth for the foreign-born population - Canada (%)
Place of birth for the foreign-born population - Other Northern America (%)
Place of birth for the foreign-born population - Other (%)
Latest news about races in Duncanville, TX collected exclusively by city-data.com from local newspapers, TV, and radio stations
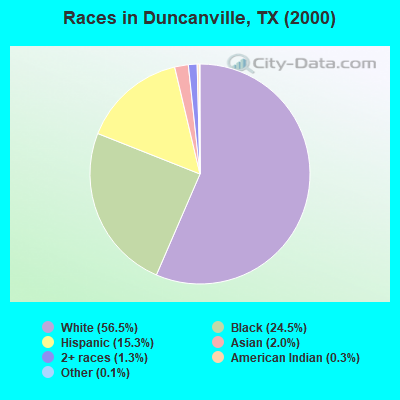
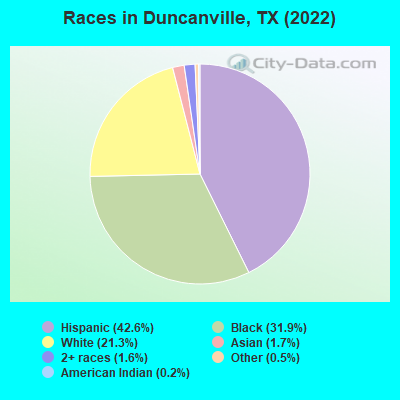
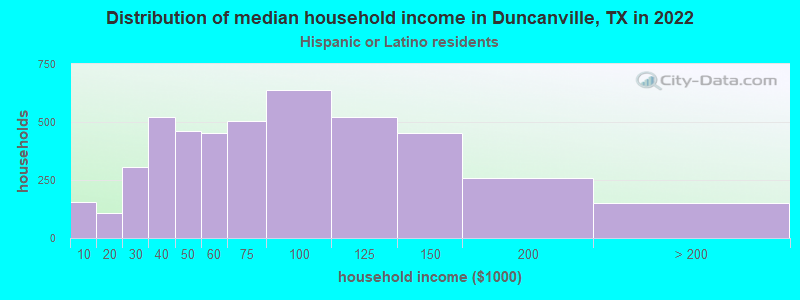
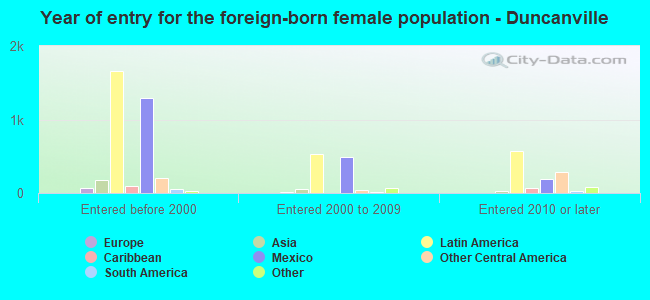
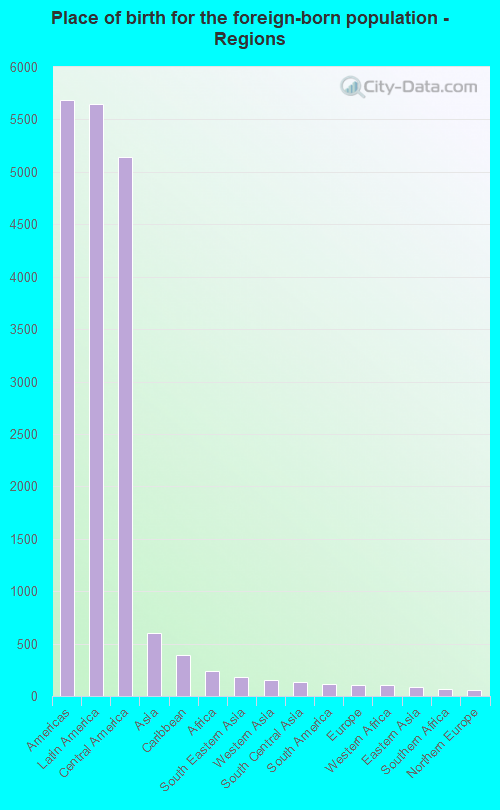
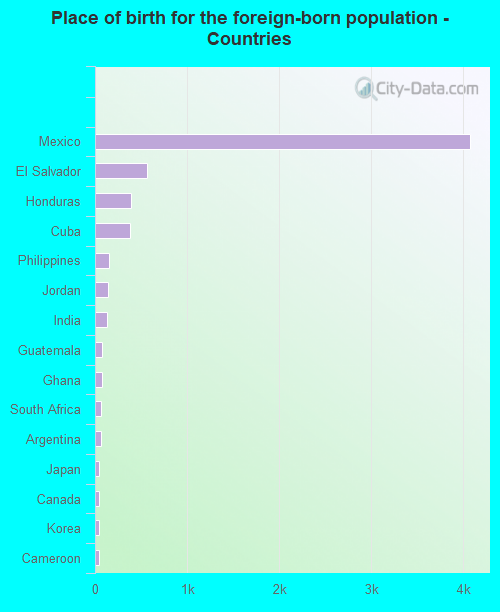
According to 2022 data, the most numerous races in Duncanville, TX are Hispanic (17,144 residents), White alone (8,588 residents), and Black alone (12,824 residents). 67.3% of Duncanville residents speak English at home. 16.5% of Duncanville, TX residents are foreign-born (13.5% born in Latin America), which is 3.0% less than the foreign-born rate of 17.0% across the entire state of Texas.
Race distribution in Duncanville
2000 2022
10,933,313 52.4% White alone 6,669,666 32.0% Hispanic 2,364,255 11.3% Black alone 554,445 2.7% Asian alone 230,567 1.1% Two or more races 68,859 0.3% American Indian alone 19,958 0.10% Other race alone 10,757 0.05% Native Hawaiian and Other
12,070,642 40.2% Hispanic 11,683,430 38.9% White alone 3,508,706 11.7% Black alone 1,608,173 5.4% Asian alone 956,560 3.2% Two or more races 125,763 0.4% Other race alone 47,023 0.2% American Indian alone 29,275 0.10% Native Hawaiian and Other
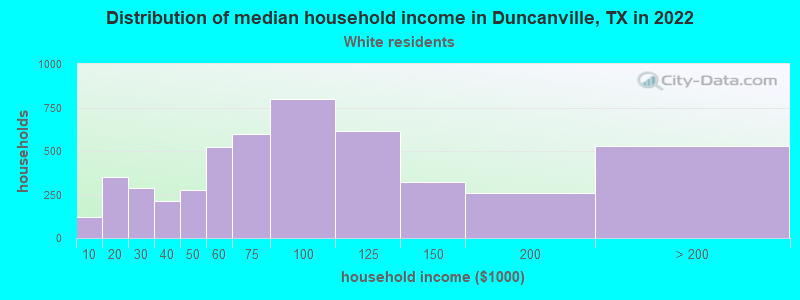
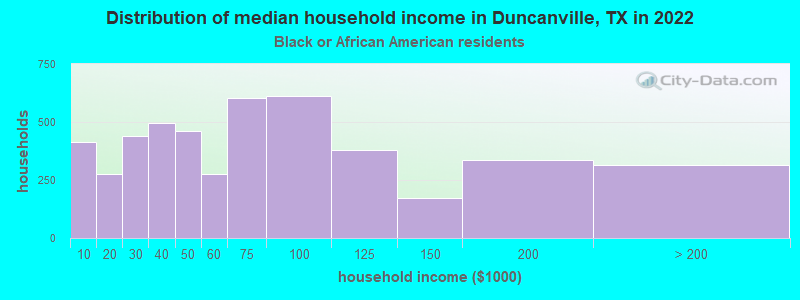
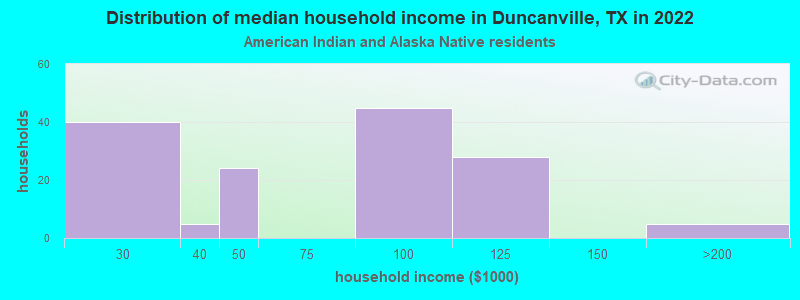
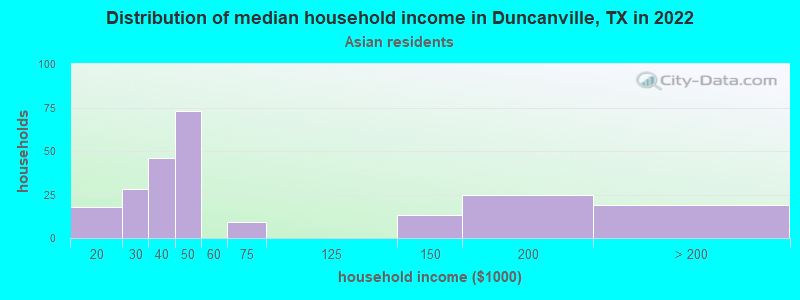
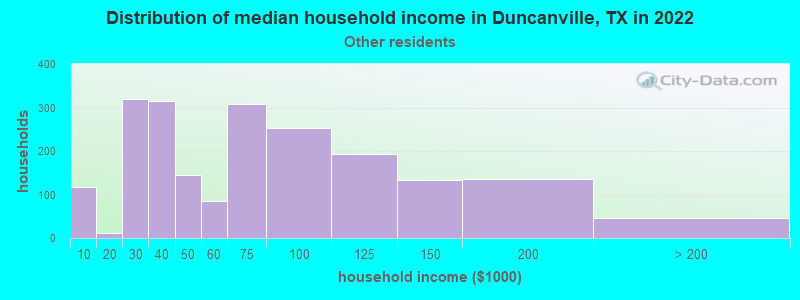
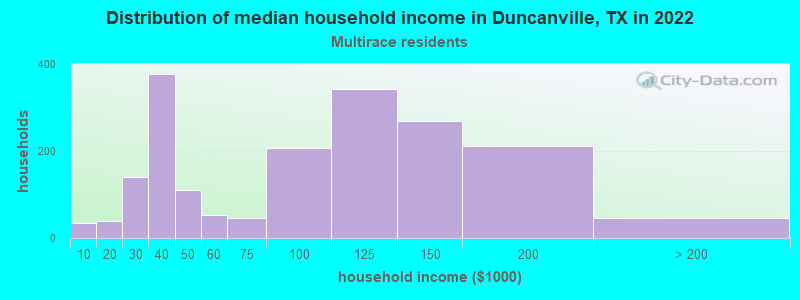
Income and house value in Duncanville Median household income in 2022 $72,542 White non-Hispanic householders$58,279 Black householders$47,241 Asian householders$55,325 Some other race householders$91,996 Two or more races householders$68,342 Hispanic or Latino race householdersMedian 2022 house value $260,544 White Non-Hispanic householders$246,816 Black or African American householders$169,311 American Indian or Alaska Native householders $318,888 Asian householders$243,099 Native Hawaiian and other Pacific Islander householders$205,633 Some other race householders$248,246 Two or more races householders$219,647 Hispanic or Latino householders
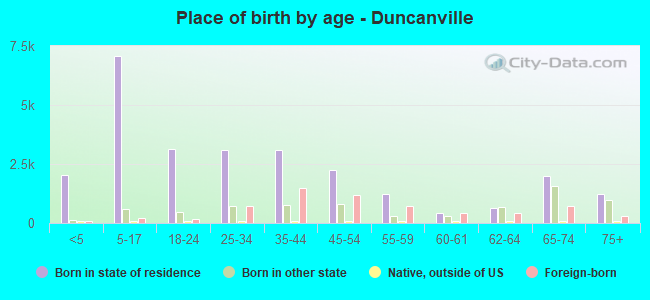
Median age by race in Duncanville
46.6 Median age for White residents46.2 47.2 36.1 Median age for Black or African American residents35.8 37.4 33.7 Median age for American Indian / Alaska Native residents42.7 30.9 34.3 Median age for Asian residents34.6 34.0 -711,469,533.3 Median age for Native Hawaiian / Pacific Islander residents-815,813,116.9 -464,594,127.3 28.6 Median age for Other race residents23.5 34.6 35.7 Median age for Two or more races residents40.9 26.2 60.5 Median age for White alone residents59.7 61.7 28.1 Median age for Hispanic or Latino residents27.5 28.9
Owner/renter occupied households by race in Duncanville
House owners and renters - White residents 4,453 85.8% Owner occupied737 14.2% Renter occupiedHouse owners and renters - Black or African American residents 1,817 37.6% Owner occupied3,011 62.4% Renter occupiedHouse owners and renters - American Indian / Alaska Native residents 108 74.2% Owner occupied37 25.8% Renter occupiedHouse owners and renters - Asian residents 91 40.2% Owner occupied135 59.8% Renter occupiedHouse owners and renters - Other race residents 1,252 60.5% Owner occupied817 39.5% Renter occupiedHouse owners and renters - Two or more races residents 1,215 66.6% Owner occupied609 33.4% Renter occupiedHouse owners and renters - White alone residents 3,681 85.3% Owner occupied632 14.7% Renter occupiedHouse owners and renters - Hispanic or Latino residents 3,293 73.2% Owner occupied1,204 26.8% Renter occupied
Language usage in Duncanville
English speakers - Total 67.3% of residents of Duncanville speak English at home.
30.8% of residents speak Spanish at home 6,992 59.7% Speak English very well4,718 40.3% Speak English less than very well2.0% of residents speak other language at home 657 86.8% Speak English very well100 13.2% Speak English less than very well
English speakers - Born in the United States 90.9% of residents of Duncanville speak English at home.
7.5% of residents speak Spanish at home 490 90.7% Speak English very well50 9.3% Speak English less than very well0.9% of residents speak other language at home 22 35.5% Speak English very well40 64.5% Speak English less than very well
English speakers - Native, born elsewhere 68.6% of residents of Duncanville speak English at home.
26.6% of residents speak Spanish at home 70 90.9% Speak English very well7 9.1% Speak English less than very well
English speakers - Foreign-born 8.5% of residents of Duncanville speak English at home.
81.5% of residents speak Spanish at home 1,314 26.0% Speak English very well3,748 74.0% Speak English less than very well10.1% of residents speak other language at home 548 87.7% Speak English very well77 12.3% Speak English less than very well
White (Caucasian) - Speak only English Native:
89.9% (9,418)Foreign-born:
11.6% (122)
White (Caucasian) - Speak another language Native:
11.4% (1,199)Foreign-born:
82.0% (864)
Black or African American - Speak only English Native:
98.8% (11,955)Foreign-born:
25.5% (69)
Black or African American - Speak another language Native:
1.3% (163)Foreign-born:
74.4% (202)
American Indian / Alaska Native - Speak another language Native:
71.7% (222)Foreign-born:
100.0% (141)
Asian - Speak only English Native:
87.6% (300)Foreign-born:
34.8% (108)
Asian - Speak another language Native:
7.0% (24)Foreign-born:
64.1% (199)
Other race - Speak only English Native:
31.6% (1,545)Foreign-born:
4.3% (114)
Other race - Speak another language Native:
68.5% (3,350)Foreign-born:
95.7% (2,505)
Two or more races - Speak only English Native:
44.9% (1,882)Foreign-born:
6.8% (167)
Two or more races - Speak another language Native:
54.5% (2,287)Foreign-born:
93.3% (2,293)
White alone - Speak only English Native:
99.6% (8,100)Foreign-born:
40.8% (116)
White alone - Speak another language Native:
1.0% (84)Foreign-born:
59.5% (170)
Hispanic or Latino - Speak only English Native:
37.6% (3,930)Foreign-born:
3.9% (204)
Hispanic or Latino - Speak another language Native:
62.8% (6,564)Foreign-born:
96.0% (5,071)
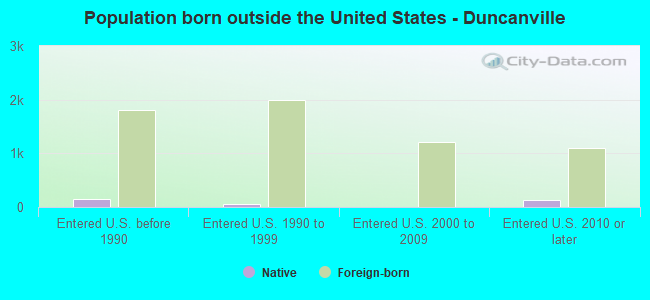
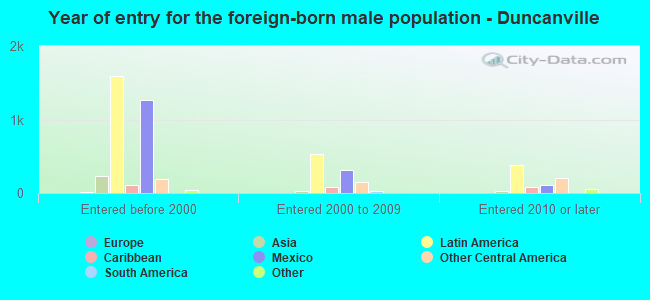
Foreign-born residents in Duncanville 6,643 residents are foreign born (13.5% Latin America ).
This city:
16.5%Texas:
17.1%
Marital status for residents in Duncanville Marital status - White (Caucasian) population 15 years and over
Males 32.1% Never married54.6% Now married1.6% Separated3.7% Widowed8.0% DivorcedFemales 22.8% Never married48.0% Now married1.4% Separated15.1% Widowed12.8% DivorcedWomen who gave birth in the past 12 months Now married:
38.7% (41)Unmarried:
61.3% (65)
Women who did not give birth in the past 12 months Now married:
43.4% (845)Unmarried:
56.6% (1,100)
Marital status - Black or African American population 15 years and over
Males 57.5% Never married33.8% Now married0.2% Separated2.9% Widowed5.6% DivorcedFemales 41.5% Never married33.2% Now married6.2% Separated4.8% Widowed14.2% DivorcedWomen who gave birth in the past 12 months Now married:
38.3% (74)Unmarried:
61.7% (119)
Women who did not give birth in the past 12 months Now married:
29.4% (881)Unmarried:
70.6% (2,116)
Marital status - American Indian / Alaska Native population 15 years and over
Males 17.5% Never married52.4% Now married0.0% Separated0.0% Widowed30.2% DivorcedFemales 35.6% Never married62.8% Now married1.7% Separated0.0% Widowed0.0% DivorcedWomen who gave birth in the past 12 months Now married:
0.0% (0)Unmarried:
100.0% (12)
Women who did not give birth in the past 12 months Now married:
59.4% (73)Unmarried:
40.6% (50)
Marital status - Asian population 15 years and over
Males 33.1% Never married66.9% Now married0.0% Separated0.0% Widowed0.0% DivorcedFemales 17.9% Never married56.5% Now married0.0% Separated25.5% Widowed0.0% DivorcedWomen who gave birth in the past 12 months Now married:
100.0% (38)Unmarried:
0.0% (0)
Women who did not give birth in the past 12 months Now married:
24.4% (19)Unmarried:
75.6% (59)
Marital status - Other race population 15 years and over
Males 47.8% Never married42.7% Now married1.6% Separated2.0% Widowed5.9% DivorcedFemales 29.5% Never married45.8% Now married4.7% Separated6.6% Widowed13.4% DivorcedWomen who gave birth in the past 12 months Now married:
100.0% (59)Unmarried:
0.0% (0)
Women who did not give birth in the past 12 months Now married:
46.3% (929)Unmarried:
53.7% (1,077)
Marital status - Two or more races population 15 years and over
Males 29.4% Never married50.3% Now married7.3% Separated0.6% Widowed12.3% DivorcedFemales 41.0% Never married40.7% Now married1.0% Separated6.7% Widowed10.6% DivorcedWomen who gave birth in the past 12 months Now married:
89.3% (112)Unmarried:
10.7% (13)
Women who did not give birth in the past 12 months Now married:
30.8% (619)Unmarried:
69.2% (1,388)
Marital status - White alone, not Hispanic / Latino population 15 years and over
Males 22.5% Never married59.7% Now married2.3% Separated5.5% Widowed10.1% DivorcedFemales 14.3% Never married50.0% Now married0.0% Separated22.0% Widowed13.7% DivorcedWomen who gave birth in the past 12 months Now married:
0.0% (0)Unmarried:
100.0% (8)
Women who did not give birth in the past 12 months Now married:
48.8% (555)Unmarried:
51.2% (583)
Marital status - Hispanic or Latino population 15 years and over
Males 42.2% Never married47.0% Now married2.6% Separated1.1% Widowed7.0% DivorcedFemales 35.3% Never married44.7% Now married3.1% Separated5.5% Widowed11.5% DivorcedWomen who gave birth in the past 12 months Now married:
58.2% (140)Unmarried:
41.8% (100)
Women who did not give birth in the past 12 months Now married:
40.0% (1,682)Unmarried:
60.0% (2,522)
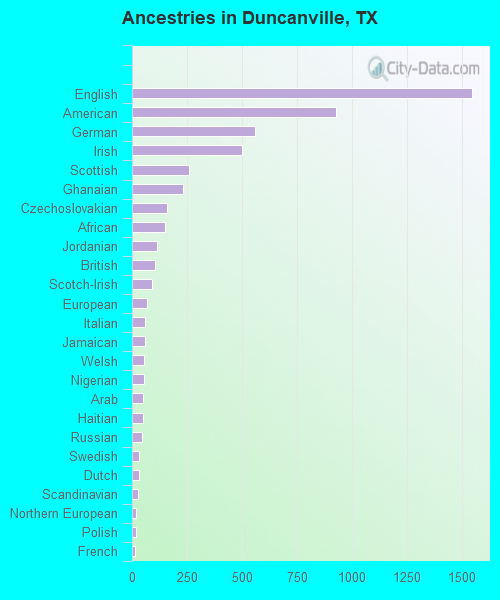
Ancestries in Duncanville
1,547 5.5% English927 3.3% American558 2.0% German499 1.8% Irish258 0.9% Scottish230 0.8% Ghanaian157 0.6% Czechoslovakian151 0.5% African113 0.4% Jordanian104 0.4% British92 0.3% Scotch-Irish69 0.2% European60 0.2% Italian58 0.2% Jamaican55 0.2% Welsh53 0.2% Nigerian51 0.2% Arab49 0.2% Haitian45 0.2% Russian32 0.1% Swedish30 0.1% Dutch29 0.1% Scandinavian19 0.07% Northern European18 0.06% Polish15 0.05% French8 0.03% Romanian8 0.03% Dutch West Indian4 0.01% Finnish3 0.01% Eastern European
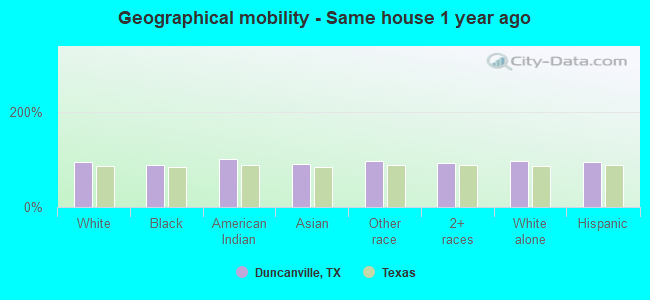
Geographical mobility in Duncanville Same house 1 year ago 10,975 94.6% White (Caucasian)11,230 87.5% Black or African American482 100.0% American Indian / Alaska Native588 90.9% Asian7,519 96.7% Other race6,586 92.7% Two or more races8,205 95.6% White alone, not Hispanic / Latino16,058 95.0% Hispanic or LatinoMoved within same county 317 2.7% White / Caucasian1,166 9.1% Black or African American5 0.8% Asian177 2.3% Other race465 6.5% Two or more races218 2.5% White alone, not Hispanic / Latino614 3.6% Hispanic or LatinoMoved within same state 116 1.0% White / Caucasian281 2.2% Black or African American40 6.2% Asian129 1.7% Other race70 1.0% Two or more races104 1.2% White alone, not Hispanic / Latino150 0.9% Hispanic or LatinoMoved from different state 100 0.9% White / Caucasian113 0.9% Black or African American17 2.7% Asian82 1.0% White alone, not Hispanic / Latino29 0.2% Hispanic or LatinoMoved from abroad 9 1.4% Asian25 0.3% Other race19 0.1% Hispanic or Latino
Children Nativity (place of birth) in Duncanville
Children under 6 years - Living with two parents Both parents native 990 100.0% NativeBoth parents foreign-born 573 100.0% NativeOne native, one foreign-born parent 316 100.0% NativeChildren under 6 years - Living with one parent Native parent 679 95.2% Native34 4.8% Foreign-bornForeign-born parent 119 100.0% NativeChildren 6 to 17 years - Living with two parents Both parents native 1,553 99.9% Native2 0.1% Foreign-bornBoth parents foreign-born 1,424 96.2% Native56 3.8% Foreign-bornOne native, one foreign-born parent 454 100.0% NativeChildren 6 to 17 years - Living with one parent Native parent 2,545 100.0% NativeForeign-born parent 731 50.7% Native711 49.3% Foreign-born
Grandparents responsible for own grandchildren in Duncanville
Grandparents (30 to 59 years) White / Caucasian 14 26.6% Responsible for grandchildren39 73.4% Not responsible for grandchildrenBlack or African American 218 82.3% Responsible for grandchildren47 17.7% Not responsible for grandchildrenAmerican Indian / Alaska Native 37 100.0% Not responsible for grandchildrenOther race 37 15.9% Responsible for grandchildren195 84.1% Not responsible for grandchildrenTwo or more races 35 33.7% Responsible for grandchildren70 66.3% Not responsible for grandchildrenWhite alone, not Hispanic / Latino 13 53.5% Responsible for grandchildren11 46.5% Not responsible for grandchildrenHispanic or Latino 52 18.6% Responsible for grandchildren225 81.4% Not responsible for grandchildrenGrandparents (60 years and over) White / Caucasian 31 29.2% Responsible for grandchildren76 70.8% Not responsible for grandchildrenBlack or African American 240 57.3% Responsible for grandchildren178 42.7% Not responsible for grandchildrenOther race 69 23.3% Responsible for grandchildren227 76.7% Not responsible for grandchildrenTwo or more races 10 19.7% Responsible for grandchildren43 80.3% Not responsible for grandchildrenWhite alone, not Hispanic / Latino 31 26.7% Responsible for grandchildren84 73.3% Not responsible for grandchildrenHispanic or Latino 61 18.7% Responsible for grandchildren266 81.3% Not responsible for grandchildren