Races in Dundalk, Maryland (MD) Detailed Stats
Data:
Races - White alone (%)
Races - White alone (% change since 2000)
Races - Black alone (%)
Races - Black alone (% change since 2000)
Races - American Indian alone (%)
Races - American Indian alone (% change since 2000)
Races - Asian alone (%)
Races - Asian alone (% change since 2000)
Races - Hispanic (%)
Races - Hispanic (% change since 2000)
Races - Native Hawaiian and Other Pacific Islander alone (%)
Races - Native Hawaiian and Other Pacific Islander alone (% change since 2000)
Races - Two or more races(%)
Races - Two or more races(% change since 2000)
Races - Other race alone (%)
Races - Other race alone (% change since 2000)
Racial diversity
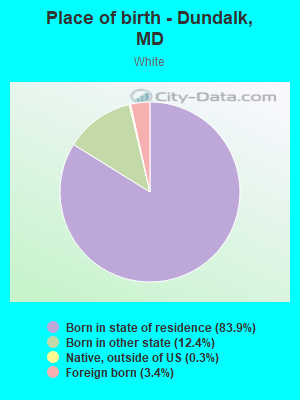
Place of birth - Born in state of residence (%)
Place of birth - Born in state of residence (%) - White
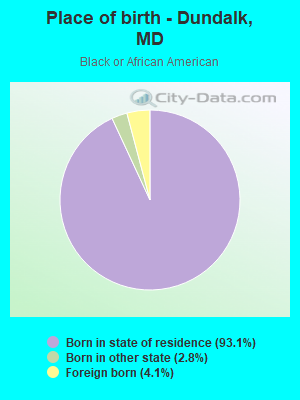
Place of birth - Born in state of residence (%) - Black or African American
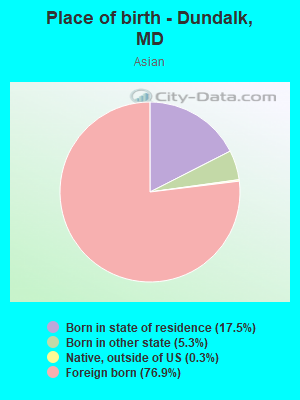
Place of birth - Born in state of residence (%) - Asian
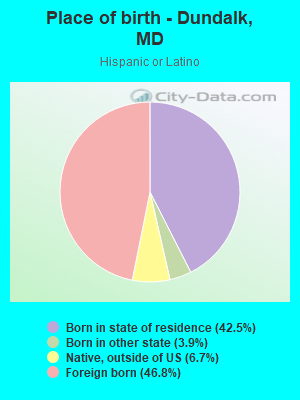
Place of birth - Born in state of residence (%) - Hispanic or Latino
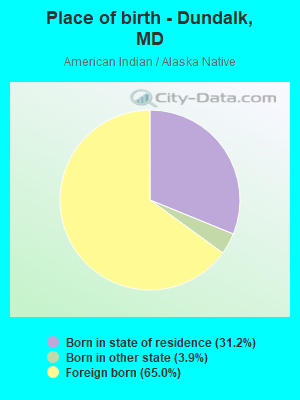
Place of birth - Born in state of residence (%) - American Indian and Alaska Native
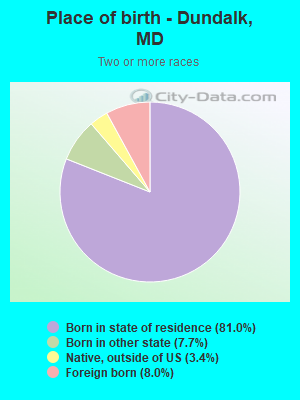
Place of birth - Born in state of residence (%) - Multirace
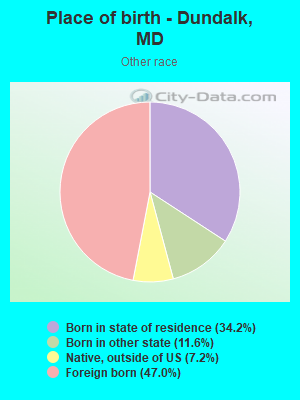
Place of birth - Born in state of residence (%) - Other Race
Place of birth - Born in other state (%)
Place of birth - Born in other state (%) - White
Place of birth - Born in other state (%) - Black or African American
Place of birth - Born in other state (%) - Asian
Place of birth - Born in other state (%) - Hispanic or Latino
Place of birth - Born in other state (%) - American Indian and Alaska Native
Place of birth - Born in other state (%) - Multirace
Place of birth - Born in other state (%) - Other Race
Place of birth - Native, outside of US (%)
Place of birth - Native, outside of US (%) - White
Place of birth - Native, outside of US (%) - Black or African American
Place of birth - Native, outside of US (%) - Asian
Place of birth - Native, outside of US (%) - Hispanic or Latino
Place of birth - Native, outside of US (%) - American Indian and Alaska Native
Place of birth - Native, outside of US (%) - Multirace
Place of birth - Native, outside of US (%) - Other Race
Place of birth - Foreign born (%)
Place of birth - Foreign born (%) - White
Place of birth - Foreign born (%) - Black or African American
Place of birth - Foreign born (%) - Asian
Place of birth - Foreign born (%) - Hispanic or Latino
Place of birth - Foreign born (%) - American Indian and Alaska Native
Place of birth - Foreign born (%) - Multirace
Place of birth - Foreign born (%) - Other Race
Residents speaking English at home (%)
Residents speaking English at home - Born in the United States (%)
Residents speaking English at home - Native, born elsewhere (%)
Residents speaking English at home - Foreign born (%)
Residents speaking Spanish at home (%)
Residents speaking Spanish at home - Born in the United States (%)
Residents speaking Spanish at home - Native, born elsewhere (%)
Residents speaking Spanish at home - Foreign born (%)
Residents speaking other language at home (%)
Residents speaking other language at home - Born in the United States (%)
Residents speaking other language at home - Native, born elsewhere (%)
Residents speaking other language at home - Foreign born (%)
Marital status - Never married (%)
Marital status - Now married (%)
Marital status - Separated (%)
Marital status - Widowed (%)
Marital status - Divorced (%)
Ancestries Reported - Arab (%)
Ancestries Reported - Czech (%)
Ancestries Reported - Danish (%)
Ancestries Reported - Dutch (%)
Ancestries Reported - English (%)
Ancestries Reported - French (%)
Ancestries Reported - French Canadian (%)
Ancestries Reported - German (%)
Ancestries Reported - Greek (%)
Ancestries Reported - Hungarian (%)
Ancestries Reported - Irish (%)
Ancestries Reported - Italian (%)
Ancestries Reported - Lithuanian (%)
Ancestries Reported - Norwegian (%)
Ancestries Reported - Polish (%)
Ancestries Reported - Portuguese (%)
Ancestries Reported - Russian (%)
Ancestries Reported - Scotch-Irish (%)
Ancestries Reported - Scottish (%)
Ancestries Reported - Slovak (%)
Ancestries Reported - Subsaharan African (%)
Ancestries Reported - Swedish (%)
Ancestries Reported - Swiss (%)
Ancestries Reported - Ukrainian (%)
Ancestries Reported - United States (%)
Ancestries Reported - Welsh (%)
Ancestries Reported - West Indian (%)
Ancestries Reported - Other (%)
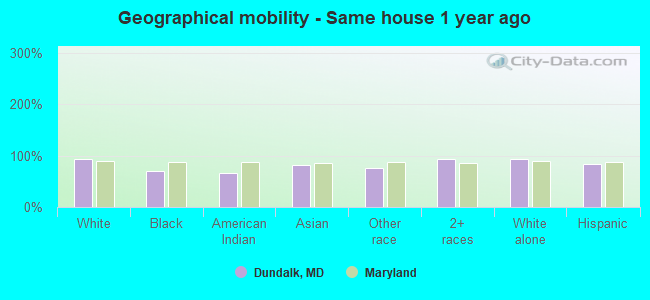
Geographical mobility - Same house 1 year ago (%)
Geographical mobility - Same house 1 year ago (%) - White
Geographical mobility - Same house 1 year ago (%) - Black or African American
Geographical mobility - Same house 1 year ago (%) - Asian
Geographical mobility - Same house 1 year ago (%) - Hispanic or Latino
Geographical mobility - Same house 1 year ago (%) - American Indian and Alaska Native
Geographical mobility - Same house 1 year ago (%) - Multirace
Geographical mobility - Same house 1 year ago (%) - Other Race
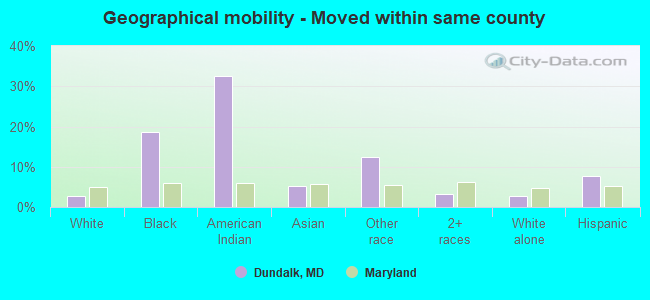
Geographical mobility - Moved within same county (%)
Geographical mobility - Moved within same county (%) - White
Geographical mobility - Moved within same county (%) - Black or African American
Geographical mobility - Moved within same county (%) - Asian
Geographical mobility - Moved within same county (%) - Hispanic or Latino
Geographical mobility - Moved within same county (%) - American Indian and Alaska Native
Geographical mobility - Moved within same county (%) - Multirace
Geographical mobility - Moved within same county (%) - Other Race
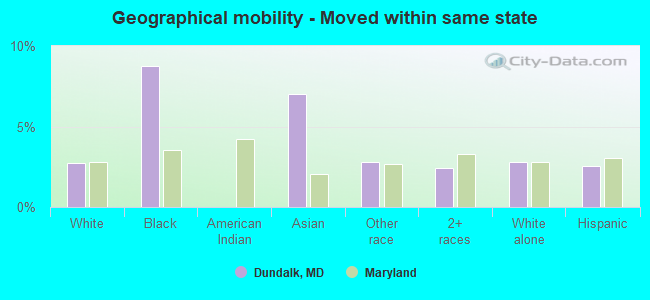
Geographical mobility - Moved from different county within same state (%)
Geographical mobility - Moved from different county within same state (%) - White
Geographical mobility - Moved from different county within same state (%) - Black or African American
Geographical mobility - Moved from different county within same state (%) - Asian
Geographical mobility - Moved from different county within same state (%) - Hispanic or Latino
Geographical mobility - Moved from different county within same state (%) - American Indian and Alaska Native
Geographical mobility - Moved from different county within same state (%) - Multirace
Geographical mobility - Moved from different county within same state (%) - Other Race
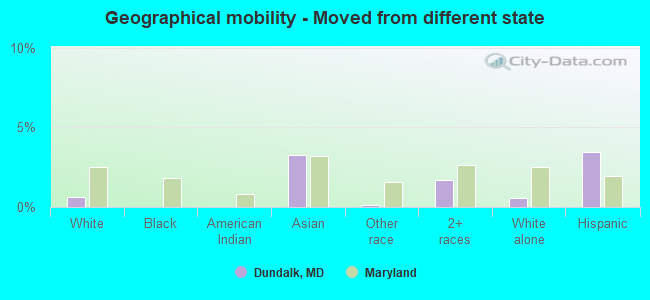
Geographical mobility - Moved from different state (%)
Geographical mobility - Moved from different state (%) - White
Geographical mobility - Moved from different state (%) - Black or African American
Geographical mobility - Moved from different state (%) - Asian
Geographical mobility - Moved from different state (%) - Hispanic or Latino
Geographical mobility - Moved from different state (%) - American Indian and Alaska Native
Geographical mobility - Moved from different state (%) - Multirace
Geographical mobility - Moved from different state (%) - Other Race
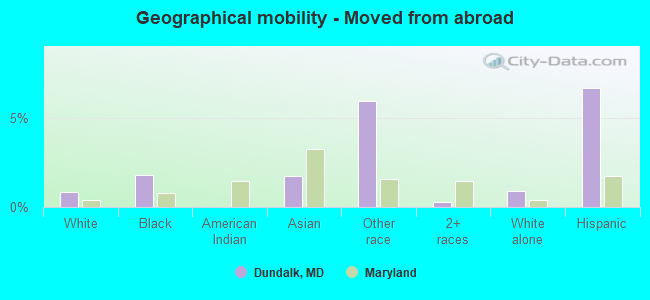
Geographical mobility - Moved from abroad (%)
Geographical mobility - Moved from abroad (%) - White
Geographical mobility - Moved from abroad (%) - Black or African American
Geographical mobility - Moved from abroad (%) - Asian
Geographical mobility - Moved from abroad (%) - Hispanic or Latino
Geographical mobility - Moved from abroad (%) - American Indian and Alaska Native
Geographical mobility - Moved from abroad (%) - Multirace
Geographical mobility - Moved from abroad (%) - Other Race
Place of birth for the foreign-born population - Ireland (%)
Place of birth for the foreign-born population - Denmark (%)
Place of birth for the foreign-born population - Norway (%)
Place of birth for the foreign-born population - Sweden (%)
Place of birth for the foreign-born population - United Kingdom (%)
Place of birth for the foreign-born population - England (%)
Place of birth for the foreign-born population - Scotland (%)
Place of birth for the foreign-born population - Other Northern Europe (%)
Place of birth for the foreign-born population - Austria (%)
Place of birth for the foreign-born population - Belgium (%)
Place of birth for the foreign-born population - France (%)
Place of birth for the foreign-born population - Germany (%)
Place of birth for the foreign-born population - Netherlands (%)
Place of birth for the foreign-born population - Switzerland (%)
Place of birth for the foreign-born population - Other Western Europe (%)
Place of birth for the foreign-born population - Greece (%)
Place of birth for the foreign-born population - Italy (%)
Place of birth for the foreign-born population - Portugal (%)
Place of birth for the foreign-born population - Spain (%)
Place of birth for the foreign-born population - Other Southern Europe (%)
Place of birth for the foreign-born population - Albania (%)
Place of birth for the foreign-born population - Belarus (%)
Place of birth for the foreign-born population - Bosnia and Herzegovina (%)
Place of birth for the foreign-born population - Bulgaria (%)
Place of birth for the foreign-born population - Croatia (%)
Place of birth for the foreign-born population - Czechoslovakia (%)
Place of birth for the foreign-born population - Hungary (%)
Place of birth for the foreign-born population - Latvia (%)
Place of birth for the foreign-born population - Lithuania (%)
Place of birth for the foreign-born population - North Macedonia (Macedonia) (%)
Place of birth for the foreign-born population - Moldova (%)
Place of birth for the foreign-born population - Poland (%)
Place of birth for the foreign-born population - Romania (%)
Place of birth for the foreign-born population - Russia (%)
Place of birth for the foreign-born population - Serbia (%)
Place of birth for the foreign-born population - Ukraine (%)
Place of birth for the foreign-born population - Other Eastern Europe (%)
Place of birth for the foreign-born population - China (%)
Place of birth for the foreign-born population - Hong Kong (%)
Place of birth for the foreign-born population - Taiwan (%)
Place of birth for the foreign-born population - Japan (%)
Place of birth for the foreign-born population - Korea (%)
Place of birth for the foreign-born population - Other Eastern Asia (%)
Place of birth for the foreign-born population - Afghanistan (%)
Place of birth for the foreign-born population - Bangladesh (%)
Place of birth for the foreign-born population - India (%)
Place of birth for the foreign-born population - Iran (%)
Place of birth for the foreign-born population - Kazakhstan (%)
Place of birth for the foreign-born population - Nepal (%)
Place of birth for the foreign-born population - Pakistan (%)
Place of birth for the foreign-born population - Sri Lanka (%)
Place of birth for the foreign-born population - Uzbekistan (%)
Place of birth for the foreign-born population - Other South Central Asia (%)
Place of birth for the foreign-born population - Burma (%)
Place of birth for the foreign-born population - Cambodia (%)
Place of birth for the foreign-born population - Indonesia (%)
Place of birth for the foreign-born population - Laos (%)
Place of birth for the foreign-born population - Malaysia (%)
Place of birth for the foreign-born population - Philippines (%)
Place of birth for the foreign-born population - Singapore (%)
Place of birth for the foreign-born population - Thailand (%)
Place of birth for the foreign-born population - Vietnam (%)
Place of birth for the foreign-born population - Other South Eastern Asia (%)
Place of birth for the foreign-born population - Armenia (%)
Place of birth for the foreign-born population - Iraq (%)
Place of birth for the foreign-born population - Israel (%)
Place of birth for the foreign-born population - Jordan (%)
Place of birth for the foreign-born population - Kuwait (%)
Place of birth for the foreign-born population - Lebanon (%)
Place of birth for the foreign-born population - Saudi Arabia (%)
Place of birth for the foreign-born population - Syria (%)
Place of birth for the foreign-born population - Turkey (%)
Place of birth for the foreign-born population - Yemen (%)
Place of birth for the foreign-born population - Other Western Asia (%)
Place of birth for the foreign-born population - Eritrea (%)
Place of birth for the foreign-born population - Ethiopia (%)
Place of birth for the foreign-born population - Kenya (%)
Place of birth for the foreign-born population - Somalia (%)
Place of birth for the foreign-born population - Uganda (%)
Place of birth for the foreign-born population - Zimbabwe (%)
Place of birth for the foreign-born population - Other Eastern Africa (%)
Place of birth for the foreign-born population - Cameroon (%)
Place of birth for the foreign-born population - Congo (%)
Place of birth for the foreign-born population - Democratic Republic of Congo (Zaire) (%)
Place of birth for the foreign-born population - Other Middle Africa (%)
Place of birth for the foreign-born population - Egypt (%)
Place of birth for the foreign-born population - Morocco (%)
Place of birth for the foreign-born population - Sudan (%)
Place of birth for the foreign-born population - Other Northern Africa (%)
Place of birth for the foreign-born population - South Africa (%)
Place of birth for the foreign-born population - Other Southern Africa (%)
Place of birth for the foreign-born population - Cabo Verde (%)
Place of birth for the foreign-born population - Ghana (%)
Place of birth for the foreign-born population - Liberia (%)
Place of birth for the foreign-born population - Nigeria (%)
Place of birth for the foreign-born population - Senegal (%)
Place of birth for the foreign-born population - Sierra Leone (%)
Place of birth for the foreign-born population - Other Western Africa (%)
Place of birth for the foreign-born population - Australia (%)
Place of birth for the foreign-born population - New Zealand (%)
Place of birth for the foreign-born population - Fiji (%)
Place of birth for the foreign-born population - Micronesia (%)
Place of birth for the foreign-born population - Bahamas (%)
Place of birth for the foreign-born population - Barbados (%)
Place of birth for the foreign-born population - Cuba (%)
Place of birth for the foreign-born population - Dominica (%)
Place of birth for the foreign-born population - Dominican Republic (%)
Place of birth for the foreign-born population - Grenada (%)
Place of birth for the foreign-born population - Haiti (%)
Place of birth for the foreign-born population - Jamaica (%)
Place of birth for the foreign-born population - St. Vincent and the Grenadines (%)
Place of birth for the foreign-born population - Trinidad and Tobago (%)
Place of birth for the foreign-born population - West Indies (%)
Place of birth for the foreign-born population - Other Caribbean (%)
Place of birth for the foreign-born population - Belize (%)
Place of birth for the foreign-born population - Costa Rica (%)
Place of birth for the foreign-born population - El Salvador (%)
Place of birth for the foreign-born population - Guatemala (%)
Place of birth for the foreign-born population - Honduras (%)
Place of birth for the foreign-born population - Mexico (%)
Place of birth for the foreign-born population - Nicaragua (%)
Place of birth for the foreign-born population - Panama (%)
Place of birth for the foreign-born population - Other Central America (%)
Place of birth for the foreign-born population - Argentina (%)
Place of birth for the foreign-born population - Bolivia (%)
Place of birth for the foreign-born population - Brazil (%)
Place of birth for the foreign-born population - Chile (%)
Place of birth for the foreign-born population - Colombia (%)
Place of birth for the foreign-born population - Ecuador (%)
Place of birth for the foreign-born population - Guyana (%)
Place of birth for the foreign-born population - Peru (%)
Place of birth for the foreign-born population - Uruguay (%)
Place of birth for the foreign-born population - Venezuela (%)
Place of birth for the foreign-born population - Other South America (%)
Place of birth for the foreign-born population - Canada (%)
Place of birth for the foreign-born population - Other Northern America (%)
Place of birth for the foreign-born population - Other (%)
Latest news about races in Dundalk, MD collected exclusively by city-data.com from local newspapers, TV, and radio stations
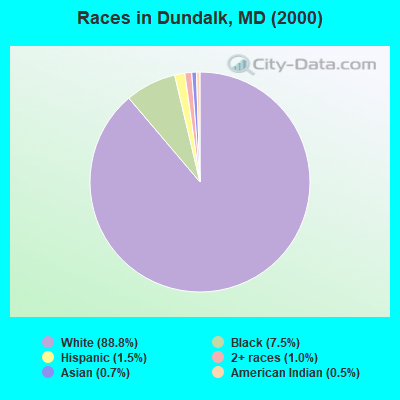
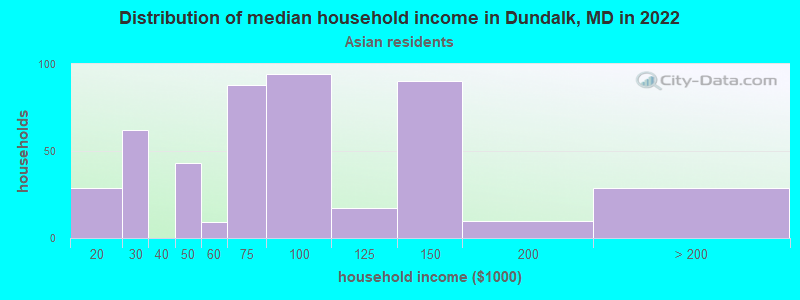
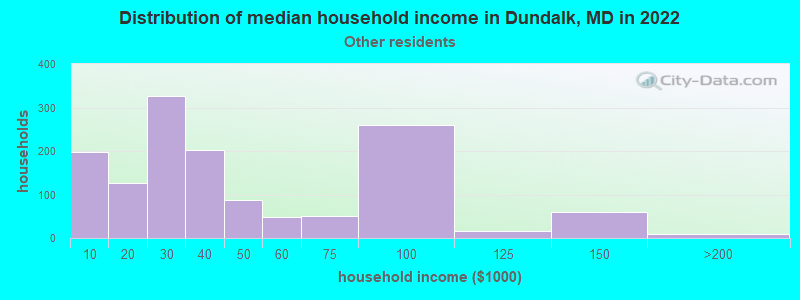
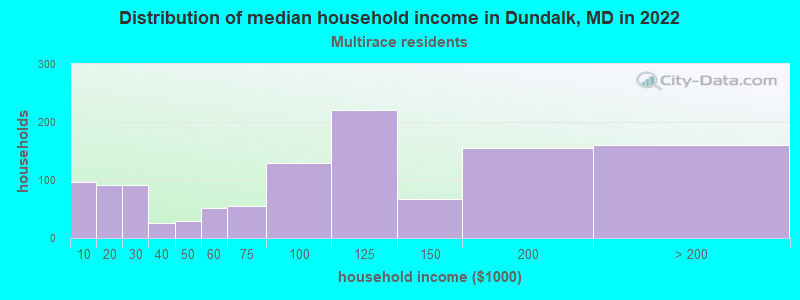
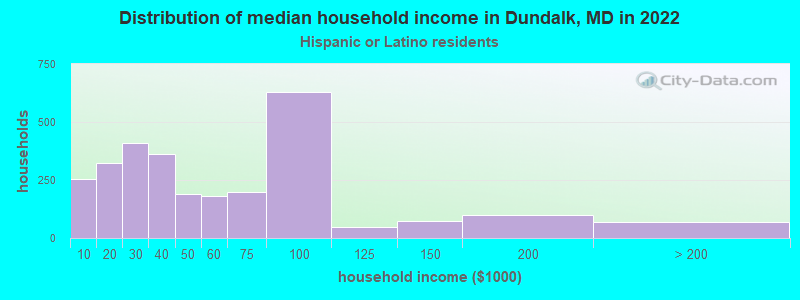
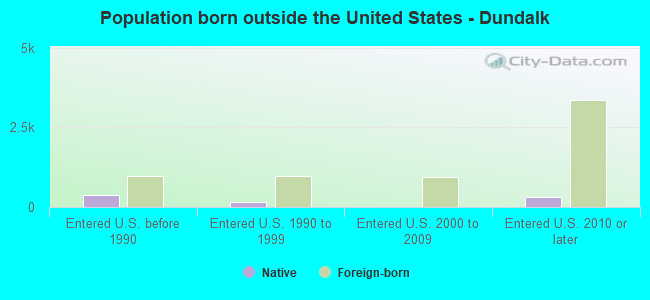
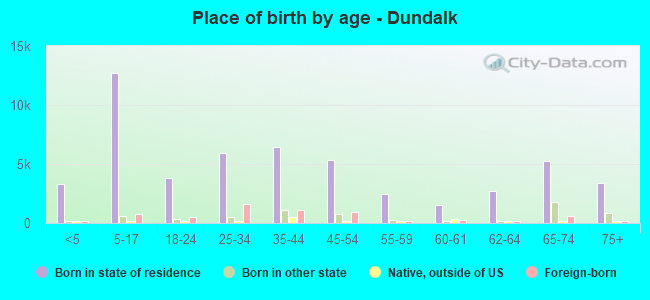
According to 2022 data, the most numerous races in Dundalk, MD are White alone (40,395 residents), Black alone (11,007 residents), and Hispanic (8,460 residents). 87.0% of Dundalk residents speak English at home. 9.5% of Dundalk, MD residents are foreign-born (5.6% born in Latin America, 1.9% born in Asia), which is 68.4% less than the foreign-born rate of 16.0% across the entire state of Maryland.
Race distribution in Dundalk
2000 2022
3,286,547 62.1% White alone 1,464,735 27.7% Black alone 227,916 4.3% Hispanic 209,738 4.0% Asian alone 82,946 1.6% Two or more races 13,312 0.3% American Indian alone 9,379 0.2% Other race alone 1,913 0.04% Native Hawaiian and Other
2,906,492 47.1% White alone 1,800,914 29.2% Black alone 705,842 11.4% Hispanic 401,818 6.5% Asian alone 291,317 4.7% Two or more races 46,930 0.8% Other race alone 8,930 0.1% American Indian alone 2,417 0.04% Native Hawaiian and Other
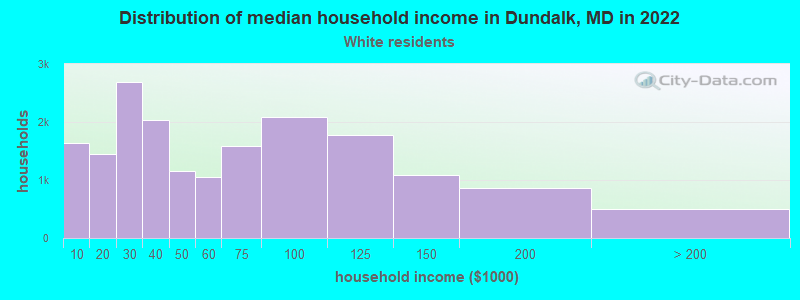
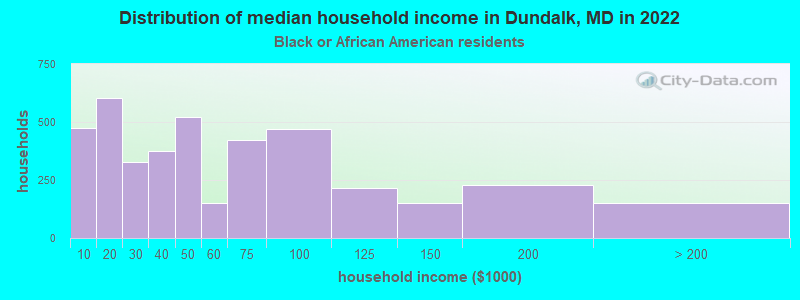
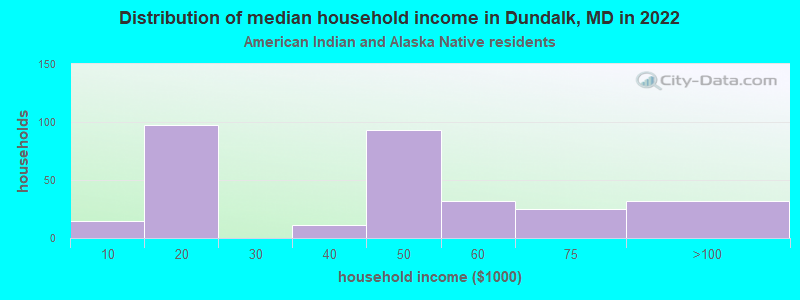
Income and house value in Dundalk Median household income in 2022 $49,458 White non-Hispanic householders$35,186 Black householders$39,655 American Indian and Alaska Native householders$96,787 Asian householders$51,086 Some other race householders$126,723 Two or more races householders$52,204 Hispanic or Latino race householdersMedian 2022 house value $200,136 White Non-Hispanic householders$156,575 Black or African American householders$187,793 American Indian or Alaska Native householders $209,816 Asian householders$163,351 Some other race householders$210,784 Two or more races householders$172,063 Hispanic or Latino householders
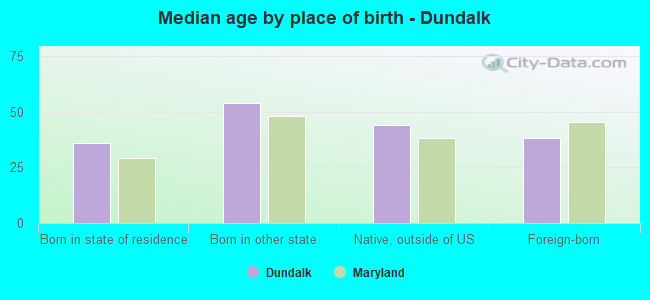
Median age by race in Dundalk
49.7 Median age for White residents42.1 54.3 30.8 Median age for Black or African American residents27.4 35.1 41.9 Median age for American Indian / Alaska Native residents37.0 43.9 60.4 Median age for Asian residents39.0 60.9 -666,666,666.0 Median age for Native Hawaiian / Pacific Islander residents-666,666,666.0 -666,666,666.0 20.1 Median age for Other race residents20.2 17.9 15.1 Median age for Two or more races residents17.8 9.9 50.5 Median age for White alone residents42.9 54.6 25.2 Median age for Hispanic or Latino residents22.7 28.4
Owner/renter occupied households by race in Dundalk
House owners and renters - White residents 13,422 74.9% Owner occupied4,493 25.1% Renter occupiedHouse owners and renters - Black or African American residents 1,659 34.9% Owner occupied3,095 65.1% Renter occupiedHouse owners and renters - American Indian / Alaska Native residents 155 42.1% Owner occupied213 57.9% Renter occupiedHouse owners and renters - Asian residents 297 55.7% Owner occupied236 44.3% Renter occupiedHouse owners and renters - Other race residents 1,052 61.4% Owner occupied660 38.6% Renter occupiedHouse owners and renters - Two or more races residents 861 68.0% Owner occupied405 32.0% Renter occupiedHouse owners and renters - White alone residents 13,102 76.8% Owner occupied3,948 23.2% Renter occupiedHouse owners and renters - Hispanic or Latino residents 1,429 54.3% Owner occupied1,205 45.7% Renter occupied
Language usage in Dundalk
English speakers - Total 87.0% of residents of Dundalk speak English at home.
9.3% of residents speak Spanish at home 2,841 49.0% Speak English very well2,952 51.0% Speak English less than very well3.6% of residents speak other language at home 1,253 55.5% Speak English very well1,006 44.5% Speak English less than very well
English speakers - Born in the United States 90.6% of residents of Dundalk speak English at home.
8.9% of residents speak Spanish at home 556 79.4% Speak English very well144 20.6% Speak English less than very well0.9% of residents speak other language at home 65 95.6% Speak English very well3 4.4% Speak English less than very well
English speakers - Native, born elsewhere 61.7% of residents of Dundalk speak English at home.
41.4% of residents speak Spanish at home 142 23.5% Speak English very well461 76.5% Speak English less than very well0.5% of residents speak other language at home 8 100.0% Speak English very well
English speakers - Foreign-born 18.4% of residents of Dundalk speak English at home.
53.9% of residents speak Spanish at home 1,144 34.3% Speak English very well2,196 65.7% Speak English less than very well28.2% of residents speak other language at home 836 47.9% Speak English very well910 52.1% Speak English less than very well
White (Caucasian) - Speak only English Native:
98.4% (38,101)Foreign-born:
31.3% (400)
White (Caucasian) - Speak another language Native:
1.6% (633)Foreign-born:
68.7% (879)
Black or African American - Speak only English Native:
99.4% (10,103)Foreign-born:
37.3% (118)
Black or African American - Speak another language Native:
1.0% (102)Foreign-born:
59.8% (190)
American Indian / Alaska Native - Speak only English Native:
62.9% (240)Foreign-born:
1.4% (8)
American Indian / Alaska Native - Speak another language Native:
32.6% (124)Foreign-born:
100.0% (581)
Asian - Speak only English Native:
58.3% (150)Foreign-born:
15.5% (189)
Asian - Speak another language Native:
41.9% (107)Foreign-born:
84.8% (1,029)
Other race - Speak another language Native:
99.2% (2,693)Foreign-born:
100.0% (3,521)
Two or more races - Speak only English Native:
92.6% (3,711)Foreign-born:
16.0% (64)
Two or more races - Speak another language Native:
7.8% (314)Foreign-born:
72.8% (291)
White alone - Speak only English Native:
99.1% (37,278)Foreign-born:
38.5% (400)
White alone - Speak another language Native:
0.9% (337)Foreign-born:
61.5% (639)
Hispanic or Latino - Speak another language Native:
67.3% (2,078)Foreign-born:
100.0% (3,761)
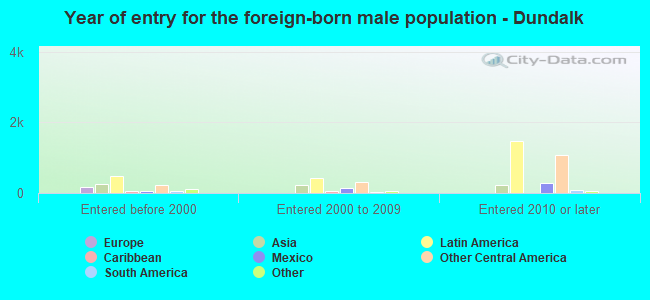
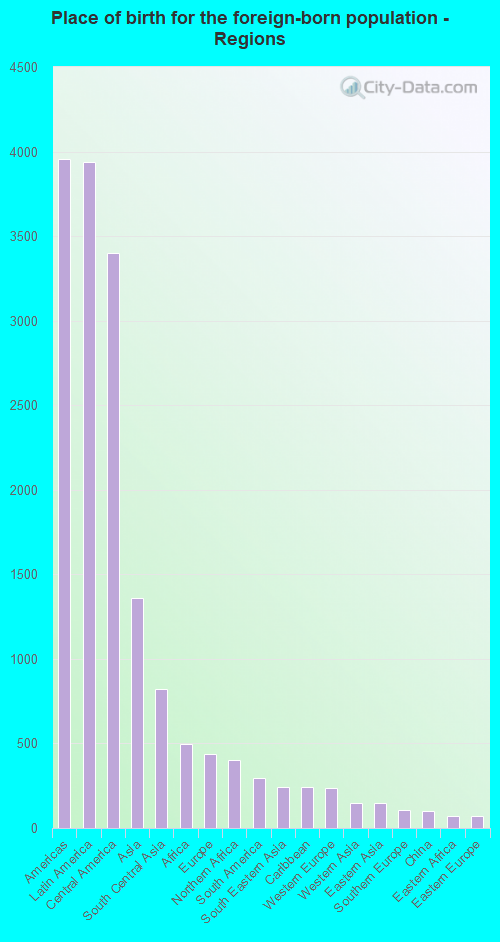
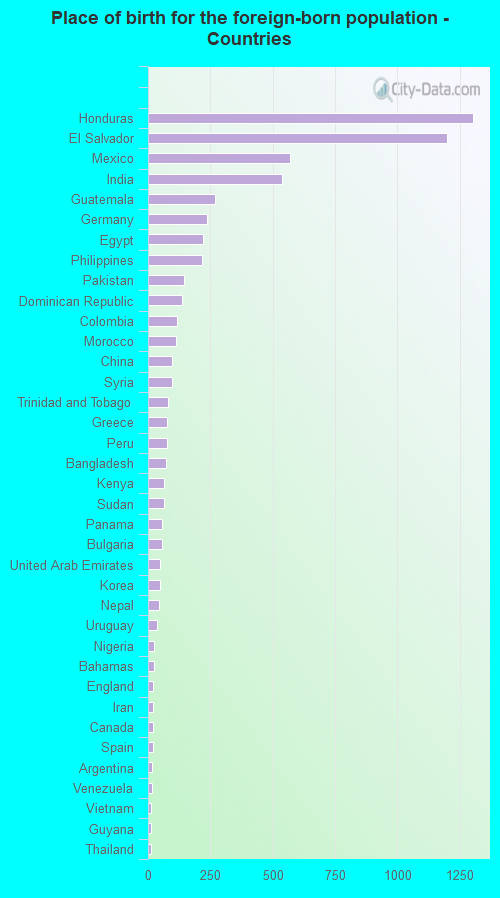
Foreign-born residents in Dundalk 6,267 residents are foreign born (5.6% Latin America , 1.9% Asia ).
This city:
9.5%Maryland:
15.7%
Marital status for residents in Dundalk Marital status - White (Caucasian) population 15 years and over
Males 42.8% Never married41.2% Now married1.3% Separated4.7% Widowed10.0% DivorcedFemales 26.8% Never married36.8% Now married2.2% Separated17.5% Widowed16.8% DivorcedWomen who gave birth in the past 12 months Now married:
42.8% (176)Unmarried:
57.2% (234)
Women who did not give birth in the past 12 months Now married:
35.3% (3,089)Unmarried:
64.7% (5,665)
Marital status - Black or African American population 15 years and over
Males 54.7% Never married31.0% Now married0.0% Separated0.0% Widowed14.3% DivorcedFemales 62.4% Never married23.0% Now married0.0% Separated0.6% Widowed14.0% DivorcedWomen who gave birth in the past 12 months Now married:
21.1% (28)Unmarried:
78.9% (105)
Women who did not give birth in the past 12 months Now married:
26.1% (814)Unmarried:
73.9% (2,303)
Marital status - American Indian / Alaska Native population 15 years and over
Males 52.8% Never married45.0% Now married2.2% Separated0.0% Widowed0.0% DivorcedFemales 16.9% Never married33.7% Now married6.9% Separated31.8% Widowed10.7% DivorcedWomen who gave birth in the past 12 months Now married:
100.0% (1)Unmarried:
0.0% (0)
Women who did not give birth in the past 12 months Now married:
70.1% (154)Unmarried:
29.9% (66)
Marital status - Asian population 15 years and over
Males 16.8% Never married77.9% Now married0.0% Separated2.1% Widowed3.2% DivorcedFemales 25.9% Never married58.7% Now married4.4% Separated2.5% Widowed8.5% DivorcedWomen who gave birth in the past 12 months Now married:
100.0% (9)Unmarried:
0.0% (0)
Women who did not give birth in the past 12 months Now married:
49.9% (168)Unmarried:
50.1% (169)
Marital status - Other race population 15 years and over
Males 44.9% Never married45.4% Now married1.6% Separated0.0% Widowed8.1% DivorcedFemales 43.8% Never married38.0% Now married6.5% Separated11.2% Widowed0.4% DivorcedWomen who gave birth in the past 12 months Now married:
100.0% (158)Unmarried:
0.0% (0)
Women who did not give birth in the past 12 months Now married:
38.3% (448)Unmarried:
61.7% (722)
Marital status - Two or more races population 15 years and over
Males 52.8% Never married35.8% Now married2.2% Separated3.2% Widowed6.1% DivorcedFemales 52.0% Never married31.4% Now married0.0% Separated5.4% Widowed11.2% DivorcedWomen who gave birth in the past 12 months Now married:
100.0% (8)Unmarried:
0.0% (0)
Women who did not give birth in the past 12 months Now married:
27.0% (277)Unmarried:
73.0% (750)
Marital status - White alone, not Hispanic / Latino population 15 years and over
Males 40.6% Never married43.1% Now married0.7% Separated5.0% Widowed10.6% DivorcedFemales 25.9% Never married37.3% Now married2.2% Separated17.9% Widowed16.7% DivorcedWomen who gave birth in the past 12 months Now married:
43.3% (177)Unmarried:
56.7% (232)
Women who did not give birth in the past 12 months Now married:
34.4% (2,855)Unmarried:
65.6% (5,434)
Marital status - Hispanic or Latino population 15 years and over
Males 53.0% Never married37.3% Now married1.0% Separated0.5% Widowed8.2% DivorcedFemales 46.8% Never married38.5% Now married3.8% Separated6.2% Widowed4.7% DivorcedWomen who gave birth in the past 12 months Now married:
95.3% (108)Unmarried:
4.7% (5)
Women who did not give birth in the past 12 months Now married:
41.7% (777)Unmarried:
58.3% (1,087)
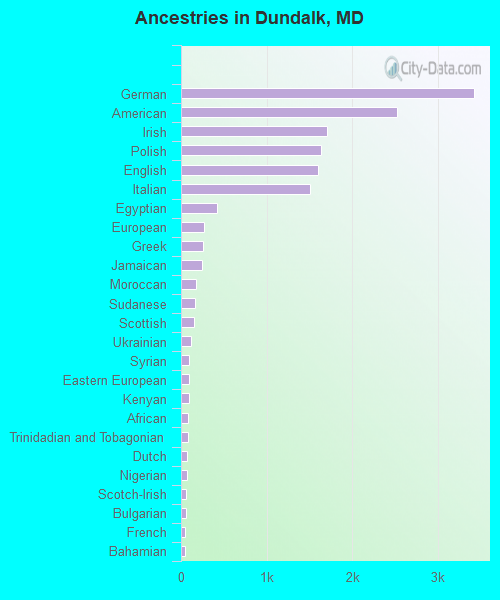
Ancestries in Dundalk
3,425 11.2% German2,524 8.2% American1,707 5.6% Irish1,639 5.4% Polish1,595 5.2% English1,502 4.9% Italian423 1.4% Egyptian272 0.9% European252 0.8% Greek243 0.8% Jamaican170 0.6% Moroccan168 0.5% Sudanese148 0.5% Scottish112 0.4% Ukrainian99 0.3% Syrian97 0.3% Eastern European90 0.3% Kenyan83 0.3% African78 0.3% Trinidadian and Tobagonian69 0.2% Dutch68 0.2% Nigerian61 0.2% Scotch-Irish59 0.2% Bulgarian52 0.2% French50 0.2% Bahamian44 0.1% Czechoslovakian40 0.1% Russian38 0.1% Portuguese27 0.09% Slovak26 0.08% Iranian25 0.08% Welsh24 0.08% Czech22 0.07% Norwegian20 0.07% Lithuanian18 0.06% Hungarian17 0.06% Northern European14 0.05% French Canadian14 0.05% Slovene14 0.05% Croatian13 0.04% British12 0.04% Romanian12 0.04% Belgian10 0.03% Scandinavian10 0.03% Swedish7 0.02% Finnish6 0.02% Turkish5 0.02% Pennsylvania German4 0.01% Austrian3 0.01% Estonian
Geographical mobility in Dundalk Same house 1 year ago 37,695 93.1% White (Caucasian)8,512 70.9% Black or African American611 66.4% American Indian / Alaska Native1,282 82.7% Asian3,365 76.2% Other race4,744 93.8% Two or more races36,386 93.0% White alone, not Hispanic / Latino6,873 84.6% Hispanic or LatinoMoved within same county 1,079 2.7% White / Caucasian2,235 18.6% Black or African American299 32.5% American Indian / Alaska Native79 5.1% Asian552 12.5% Other race160 3.2% Two or more races1,079 2.8% White alone, not Hispanic / Latino625 7.7% Hispanic or LatinoMoved within same state 1,098 2.7% White / Caucasian1,048 8.7% Black or African American108 7.0% Asian123 2.8% Other race121 2.4% Two or more races1,098 2.8% White alone, not Hispanic / Latino207 2.6% Hispanic or LatinoMoved from different state 266 0.7% White / Caucasian51 3.3% Asian5 0.1% Other race86 1.7% Two or more races216 0.6% White alone, not Hispanic / Latino282 3.5% Hispanic or LatinoMoved from abroad 347 0.9% White212 1.8% Black or African American26 1.7% Asian263 5.9% Other race14 0.3% Two or more races347 0.9% White alone, not Hispanic / Latino539 6.6% Hispanic or Latino
Children Nativity (place of birth) in Dundalk
Children under 6 years - Living with two parents Both parents native 1,008 99.0% Native11 1.0% Foreign-bornBoth parents foreign-born 599 92.3% Native50 7.7% Foreign-bornOne native, one foreign-born parent 73 100.0% NativeChildren under 6 years - Living with one parent Native parent 2,411 100.0% NativeForeign-born parent 447 83.1% Native91 16.9% Foreign-bornChildren 6 to 17 years - Living with two parents Both parents native 3,346 100.0% NativeBoth parents foreign-born 871 72.2% Native335 27.8% Foreign-bornOne native, one foreign-born parent 270 100.0% NativeChildren 6 to 17 years - Living with one parent Native parent 4,543 100.0% NativeForeign-born parent 680 63.2% Native396 36.8% Foreign-born
Grandparents responsible for own grandchildren in Dundalk
Grandparents (30 to 59 years) White / Caucasian 277 69.4% Responsible for grandchildren122 30.6% Not responsible for grandchildrenBlack or African American 10 15.2% Responsible for grandchildren58 84.8% Not responsible for grandchildrenAsian 6 100.0% Not responsible for grandchildrenOther race 32 43.1% Responsible for grandchildren42 56.9% Not responsible for grandchildrenTwo or more races 19 100.0% Not responsible for grandchildrenWhite alone, not Hispanic / Latino 277 69.4% Responsible for grandchildren122 30.6% Not responsible for grandchildrenHispanic or Latino 32 43.9% Responsible for grandchildren41 56.1% Not responsible for grandchildrenGrandparents (60 years and over) White / Caucasian 923 53.0% Responsible for grandchildren818 47.0% Not responsible for grandchildrenBlack or African American 28 22.9% Responsible for grandchildren95 77.1% Not responsible for grandchildrenAsian 18 32.2% Responsible for grandchildren37 67.8% Not responsible for grandchildrenOther race 9 100.0% Not responsible for grandchildrenTwo or more races 9 100.0% Responsible for grandchildrenWhite alone, not Hispanic / Latino 923 53.0% Responsible for grandchildren818 47.0% Not responsible for grandchildrenHispanic or Latino 21 100.0% Not responsible for grandchildren