Races in Dunkirk, New York (NY) Detailed Stats
Data:
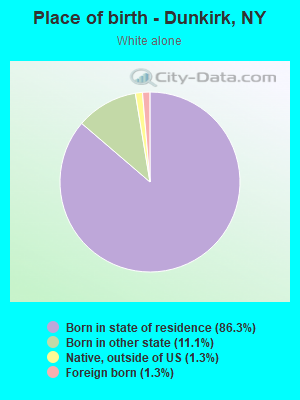
Races - White alone (%)
Races - White alone (% change since 2000)
Races - Black alone (%)
Races - Black alone (% change since 2000)
Races - American Indian alone (%)
Races - American Indian alone (% change since 2000)
Races - Asian alone (%)
Races - Asian alone (% change since 2000)
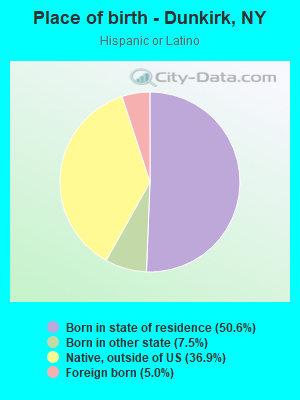
Races - Hispanic (%)
Races - Hispanic (% change since 2000)
Races - Native Hawaiian and Other Pacific Islander alone (%)
Races - Native Hawaiian and Other Pacific Islander alone (% change since 2000)
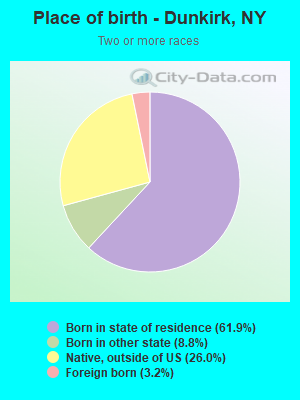
Races - Two or more races(%)
Races - Two or more races(% change since 2000)
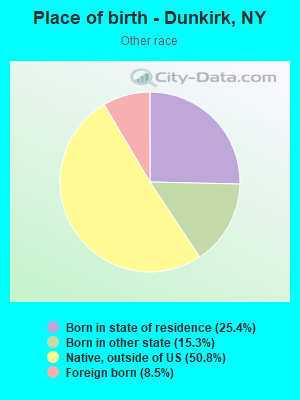
Races - Other race alone (%)
Races - Other race alone (% change since 2000)
Racial diversity
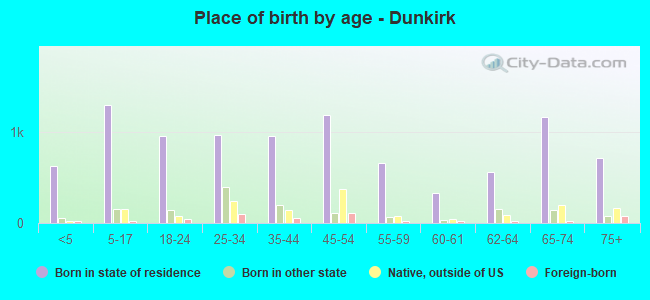
Place of birth - Born in state of residence (%)
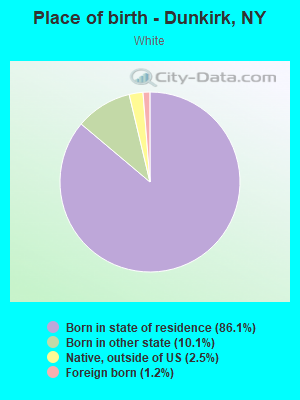
Place of birth - Born in state of residence (%) - White
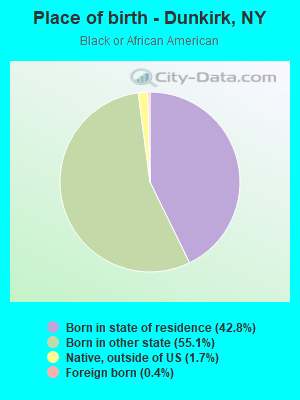
Place of birth - Born in state of residence (%) - Black or African American
Place of birth - Born in state of residence (%) - Asian
Place of birth - Born in state of residence (%) - Hispanic or Latino
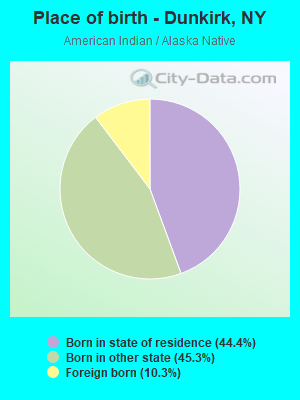
Place of birth - Born in state of residence (%) - American Indian and Alaska Native
Place of birth - Born in state of residence (%) - Multirace
Place of birth - Born in state of residence (%) - Other Race
Place of birth - Born in other state (%)
Place of birth - Born in other state (%) - White
Place of birth - Born in other state (%) - Black or African American
Place of birth - Born in other state (%) - Asian
Place of birth - Born in other state (%) - Hispanic or Latino
Place of birth - Born in other state (%) - American Indian and Alaska Native
Place of birth - Born in other state (%) - Multirace
Place of birth - Born in other state (%) - Other Race
Place of birth - Native, outside of US (%)
Place of birth - Native, outside of US (%) - White
Place of birth - Native, outside of US (%) - Black or African American
Place of birth - Native, outside of US (%) - Asian
Place of birth - Native, outside of US (%) - Hispanic or Latino
Place of birth - Native, outside of US (%) - American Indian and Alaska Native
Place of birth - Native, outside of US (%) - Multirace
Place of birth - Native, outside of US (%) - Other Race
Place of birth - Foreign born (%)
Place of birth - Foreign born (%) - White
Place of birth - Foreign born (%) - Black or African American
Place of birth - Foreign born (%) - Asian
Place of birth - Foreign born (%) - Hispanic or Latino
Place of birth - Foreign born (%) - American Indian and Alaska Native
Place of birth - Foreign born (%) - Multirace
Place of birth - Foreign born (%) - Other Race
Residents speaking English at home (%)
Residents speaking English at home - Born in the United States (%)
Residents speaking English at home - Native, born elsewhere (%)
Residents speaking English at home - Foreign born (%)
Residents speaking Spanish at home (%)
Residents speaking Spanish at home - Born in the United States (%)
Residents speaking Spanish at home - Native, born elsewhere (%)
Residents speaking Spanish at home - Foreign born (%)
Residents speaking other language at home (%)
Residents speaking other language at home - Born in the United States (%)
Residents speaking other language at home - Native, born elsewhere (%)
Residents speaking other language at home - Foreign born (%)
Marital status - Never married (%)
Marital status - Now married (%)
Marital status - Separated (%)
Marital status - Widowed (%)
Marital status - Divorced (%)
Ancestries Reported - Arab (%)
Ancestries Reported - Czech (%)
Ancestries Reported - Danish (%)
Ancestries Reported - Dutch (%)
Ancestries Reported - English (%)
Ancestries Reported - French (%)
Ancestries Reported - French Canadian (%)
Ancestries Reported - German (%)
Ancestries Reported - Greek (%)
Ancestries Reported - Hungarian (%)
Ancestries Reported - Irish (%)
Ancestries Reported - Italian (%)
Ancestries Reported - Lithuanian (%)
Ancestries Reported - Norwegian (%)
Ancestries Reported - Polish (%)
Ancestries Reported - Portuguese (%)
Ancestries Reported - Russian (%)
Ancestries Reported - Scotch-Irish (%)
Ancestries Reported - Scottish (%)
Ancestries Reported - Slovak (%)
Ancestries Reported - Subsaharan African (%)
Ancestries Reported - Swedish (%)
Ancestries Reported - Swiss (%)
Ancestries Reported - Ukrainian (%)
Ancestries Reported - United States (%)
Ancestries Reported - Welsh (%)
Ancestries Reported - West Indian (%)
Ancestries Reported - Other (%)
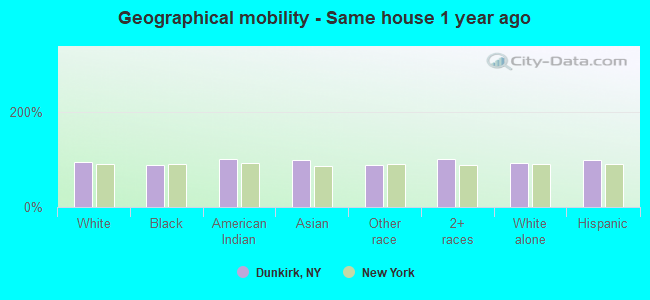
Geographical mobility - Same house 1 year ago (%)
Geographical mobility - Same house 1 year ago (%) - White
Geographical mobility - Same house 1 year ago (%) - Black or African American
Geographical mobility - Same house 1 year ago (%) - Asian
Geographical mobility - Same house 1 year ago (%) - Hispanic or Latino
Geographical mobility - Same house 1 year ago (%) - American Indian and Alaska Native
Geographical mobility - Same house 1 year ago (%) - Multirace
Geographical mobility - Same house 1 year ago (%) - Other Race
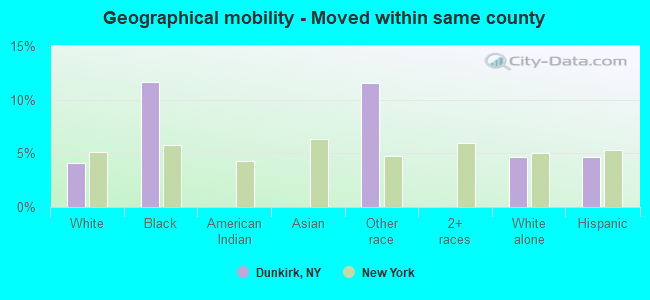
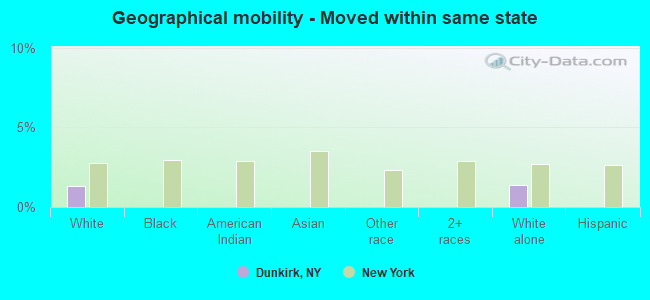
Geographical mobility - Moved within same county (%)
Geographical mobility - Moved within same county (%) - White
Geographical mobility - Moved within same county (%) - Black or African American
Geographical mobility - Moved within same county (%) - Asian
Geographical mobility - Moved within same county (%) - Hispanic or Latino
Geographical mobility - Moved within same county (%) - American Indian and Alaska Native
Geographical mobility - Moved within same county (%) - Multirace
Geographical mobility - Moved within same county (%) - Other Race
Geographical mobility - Moved from different county within same state (%)
Geographical mobility - Moved from different county within same state (%) - White
Geographical mobility - Moved from different county within same state (%) - Black or African American
Geographical mobility - Moved from different county within same state (%) - Asian
Geographical mobility - Moved from different county within same state (%) - Hispanic or Latino
Geographical mobility - Moved from different county within same state (%) - American Indian and Alaska Native
Geographical mobility - Moved from different county within same state (%) - Multirace
Geographical mobility - Moved from different county within same state (%) - Other Race
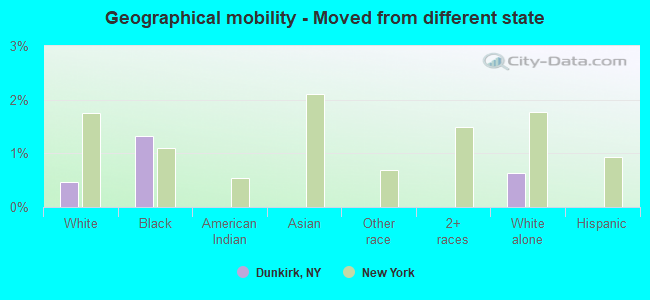
Geographical mobility - Moved from different state (%)
Geographical mobility - Moved from different state (%) - White
Geographical mobility - Moved from different state (%) - Black or African American
Geographical mobility - Moved from different state (%) - Asian
Geographical mobility - Moved from different state (%) - Hispanic or Latino
Geographical mobility - Moved from different state (%) - American Indian and Alaska Native
Geographical mobility - Moved from different state (%) - Multirace
Geographical mobility - Moved from different state (%) - Other Race
Geographical mobility - Moved from abroad (%)
Geographical mobility - Moved from abroad (%) - White
Geographical mobility - Moved from abroad (%) - Black or African American
Geographical mobility - Moved from abroad (%) - Asian
Geographical mobility - Moved from abroad (%) - Hispanic or Latino
Geographical mobility - Moved from abroad (%) - American Indian and Alaska Native
Geographical mobility - Moved from abroad (%) - Multirace
Geographical mobility - Moved from abroad (%) - Other Race
Place of birth for the foreign-born population - Ireland (%)
Place of birth for the foreign-born population - Denmark (%)
Place of birth for the foreign-born population - Norway (%)
Place of birth for the foreign-born population - Sweden (%)
Place of birth for the foreign-born population - United Kingdom (%)
Place of birth for the foreign-born population - England (%)
Place of birth for the foreign-born population - Scotland (%)
Place of birth for the foreign-born population - Other Northern Europe (%)
Place of birth for the foreign-born population - Austria (%)
Place of birth for the foreign-born population - Belgium (%)
Place of birth for the foreign-born population - France (%)
Place of birth for the foreign-born population - Germany (%)
Place of birth for the foreign-born population - Netherlands (%)
Place of birth for the foreign-born population - Switzerland (%)
Place of birth for the foreign-born population - Other Western Europe (%)
Place of birth for the foreign-born population - Greece (%)
Place of birth for the foreign-born population - Italy (%)
Place of birth for the foreign-born population - Portugal (%)
Place of birth for the foreign-born population - Spain (%)
Place of birth for the foreign-born population - Other Southern Europe (%)
Place of birth for the foreign-born population - Albania (%)
Place of birth for the foreign-born population - Belarus (%)
Place of birth for the foreign-born population - Bosnia and Herzegovina (%)
Place of birth for the foreign-born population - Bulgaria (%)
Place of birth for the foreign-born population - Croatia (%)
Place of birth for the foreign-born population - Czechoslovakia (%)
Place of birth for the foreign-born population - Hungary (%)
Place of birth for the foreign-born population - Latvia (%)
Place of birth for the foreign-born population - Lithuania (%)
Place of birth for the foreign-born population - North Macedonia (Macedonia) (%)
Place of birth for the foreign-born population - Moldova (%)
Place of birth for the foreign-born population - Poland (%)
Place of birth for the foreign-born population - Romania (%)
Place of birth for the foreign-born population - Russia (%)
Place of birth for the foreign-born population - Serbia (%)
Place of birth for the foreign-born population - Ukraine (%)
Place of birth for the foreign-born population - Other Eastern Europe (%)
Place of birth for the foreign-born population - China (%)
Place of birth for the foreign-born population - Hong Kong (%)
Place of birth for the foreign-born population - Taiwan (%)
Place of birth for the foreign-born population - Japan (%)
Place of birth for the foreign-born population - Korea (%)
Place of birth for the foreign-born population - Other Eastern Asia (%)
Place of birth for the foreign-born population - Afghanistan (%)
Place of birth for the foreign-born population - Bangladesh (%)
Place of birth for the foreign-born population - India (%)
Place of birth for the foreign-born population - Iran (%)
Place of birth for the foreign-born population - Kazakhstan (%)
Place of birth for the foreign-born population - Nepal (%)
Place of birth for the foreign-born population - Pakistan (%)
Place of birth for the foreign-born population - Sri Lanka (%)
Place of birth for the foreign-born population - Uzbekistan (%)
Place of birth for the foreign-born population - Other South Central Asia (%)
Place of birth for the foreign-born population - Burma (%)
Place of birth for the foreign-born population - Cambodia (%)
Place of birth for the foreign-born population - Indonesia (%)
Place of birth for the foreign-born population - Laos (%)
Place of birth for the foreign-born population - Malaysia (%)
Place of birth for the foreign-born population - Philippines (%)
Place of birth for the foreign-born population - Singapore (%)
Place of birth for the foreign-born population - Thailand (%)
Place of birth for the foreign-born population - Vietnam (%)
Place of birth for the foreign-born population - Other South Eastern Asia (%)
Place of birth for the foreign-born population - Armenia (%)
Place of birth for the foreign-born population - Iraq (%)
Place of birth for the foreign-born population - Israel (%)
Place of birth for the foreign-born population - Jordan (%)
Place of birth for the foreign-born population - Kuwait (%)
Place of birth for the foreign-born population - Lebanon (%)
Place of birth for the foreign-born population - Saudi Arabia (%)
Place of birth for the foreign-born population - Syria (%)
Place of birth for the foreign-born population - Turkey (%)
Place of birth for the foreign-born population - Yemen (%)
Place of birth for the foreign-born population - Other Western Asia (%)
Place of birth for the foreign-born population - Eritrea (%)
Place of birth for the foreign-born population - Ethiopia (%)
Place of birth for the foreign-born population - Kenya (%)
Place of birth for the foreign-born population - Somalia (%)
Place of birth for the foreign-born population - Uganda (%)
Place of birth for the foreign-born population - Zimbabwe (%)
Place of birth for the foreign-born population - Other Eastern Africa (%)
Place of birth for the foreign-born population - Cameroon (%)
Place of birth for the foreign-born population - Congo (%)
Place of birth for the foreign-born population - Democratic Republic of Congo (Zaire) (%)
Place of birth for the foreign-born population - Other Middle Africa (%)
Place of birth for the foreign-born population - Egypt (%)
Place of birth for the foreign-born population - Morocco (%)
Place of birth for the foreign-born population - Sudan (%)
Place of birth for the foreign-born population - Other Northern Africa (%)
Place of birth for the foreign-born population - South Africa (%)
Place of birth for the foreign-born population - Other Southern Africa (%)
Place of birth for the foreign-born population - Cabo Verde (%)
Place of birth for the foreign-born population - Ghana (%)
Place of birth for the foreign-born population - Liberia (%)
Place of birth for the foreign-born population - Nigeria (%)
Place of birth for the foreign-born population - Senegal (%)
Place of birth for the foreign-born population - Sierra Leone (%)
Place of birth for the foreign-born population - Other Western Africa (%)
Place of birth for the foreign-born population - Australia (%)
Place of birth for the foreign-born population - New Zealand (%)
Place of birth for the foreign-born population - Fiji (%)
Place of birth for the foreign-born population - Micronesia (%)
Place of birth for the foreign-born population - Bahamas (%)
Place of birth for the foreign-born population - Barbados (%)
Place of birth for the foreign-born population - Cuba (%)
Place of birth for the foreign-born population - Dominica (%)
Place of birth for the foreign-born population - Dominican Republic (%)
Place of birth for the foreign-born population - Grenada (%)
Place of birth for the foreign-born population - Haiti (%)
Place of birth for the foreign-born population - Jamaica (%)
Place of birth for the foreign-born population - St. Vincent and the Grenadines (%)
Place of birth for the foreign-born population - Trinidad and Tobago (%)
Place of birth for the foreign-born population - West Indies (%)
Place of birth for the foreign-born population - Other Caribbean (%)
Place of birth for the foreign-born population - Belize (%)
Place of birth for the foreign-born population - Costa Rica (%)
Place of birth for the foreign-born population - El Salvador (%)
Place of birth for the foreign-born population - Guatemala (%)
Place of birth for the foreign-born population - Honduras (%)
Place of birth for the foreign-born population - Mexico (%)
Place of birth for the foreign-born population - Nicaragua (%)
Place of birth for the foreign-born population - Panama (%)
Place of birth for the foreign-born population - Other Central America (%)
Place of birth for the foreign-born population - Argentina (%)
Place of birth for the foreign-born population - Bolivia (%)
Place of birth for the foreign-born population - Brazil (%)
Place of birth for the foreign-born population - Chile (%)
Place of birth for the foreign-born population - Colombia (%)
Place of birth for the foreign-born population - Ecuador (%)
Place of birth for the foreign-born population - Guyana (%)
Place of birth for the foreign-born population - Peru (%)
Place of birth for the foreign-born population - Uruguay (%)
Place of birth for the foreign-born population - Venezuela (%)
Place of birth for the foreign-born population - Other South America (%)
Place of birth for the foreign-born population - Canada (%)
Place of birth for the foreign-born population - Other Northern America (%)
Place of birth for the foreign-born population - Other (%)
Latest news about races in Dunkirk, NY collected exclusively by city-data.com from local newspapers, TV, and radio stations
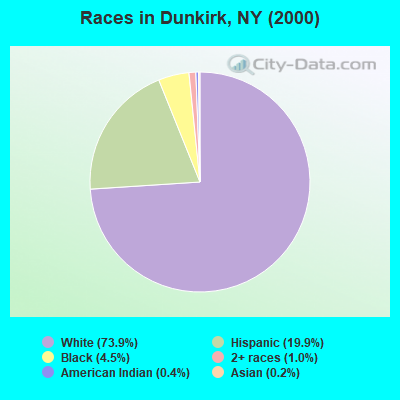
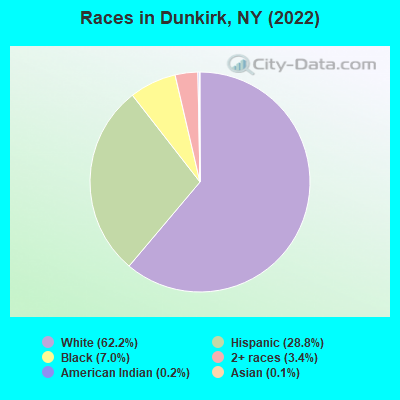
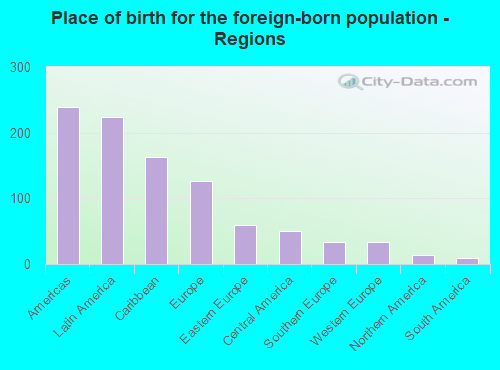
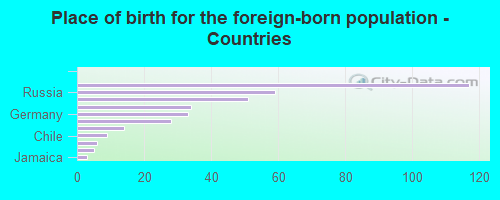
According to 2022 data, the most numerous races in Dunkirk, NY are White alone (7,790 residents), Hispanic (3,608 residents), and Black alone (871 residents). 78.7% of Dunkirk residents speak English at home. 2.9% of Dunkirk, NY residents are foreign-born (1.8% born in Latin America, 1.0% born in Europe), which is 653.0% less than the foreign-born rate of 22.0% across the entire state of New York.
Race distribution in Dunkirk
2000 2022
11,760,981 62.0% White alone 2,867,583 15.1% Hispanic 2,812,623 14.8% Black alone 1,035,926 5.5% Asian alone 366,116 1.9% Two or more races 75,499 0.4% Other race alone 52,499 0.3% American Indian alone 5,230 0.03% Native Hawaiian and Other
10,408,933 52.9% White alone 3,867,299 19.7% Hispanic 2,633,840 13.4% Black alone 1,776,286 9.0% Asian alone 732,670 3.7% Two or more races 216,110 1.1% Other race alone 35,082 0.2% American Indian alone 6,931 0.04% Native Hawaiian and Other
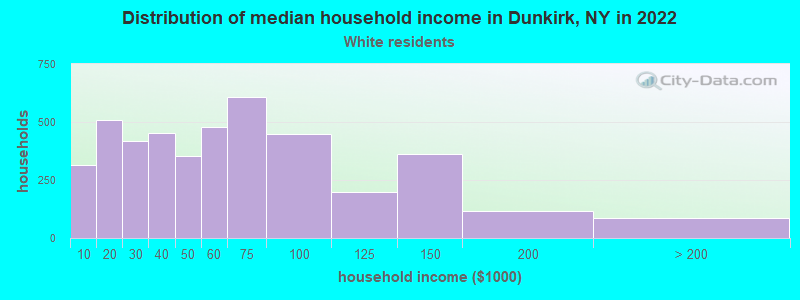
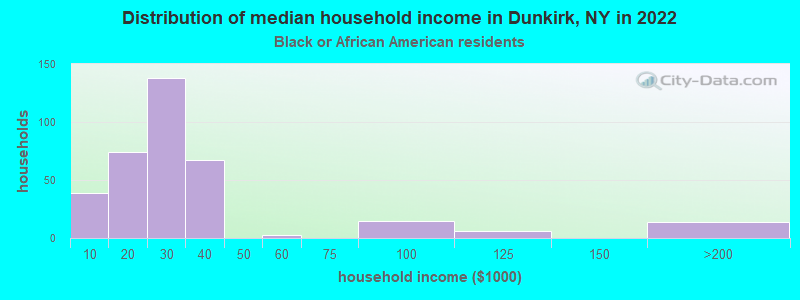
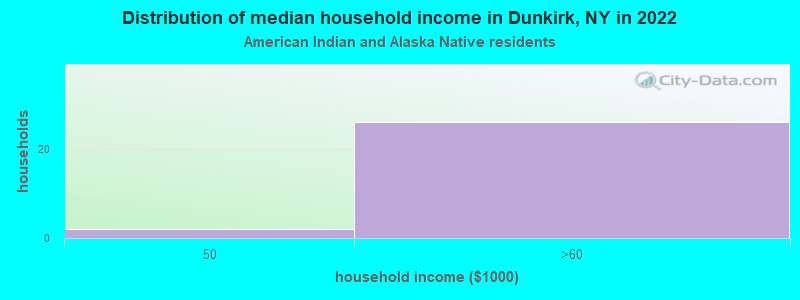
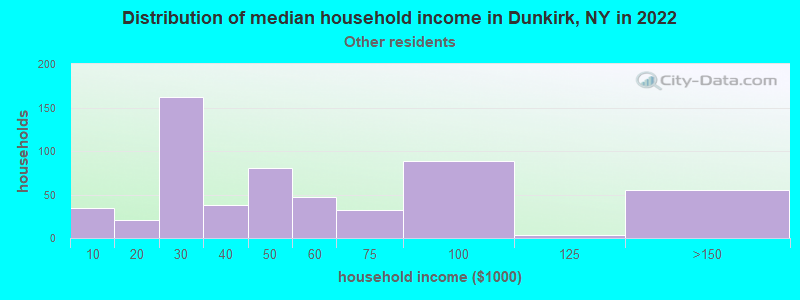
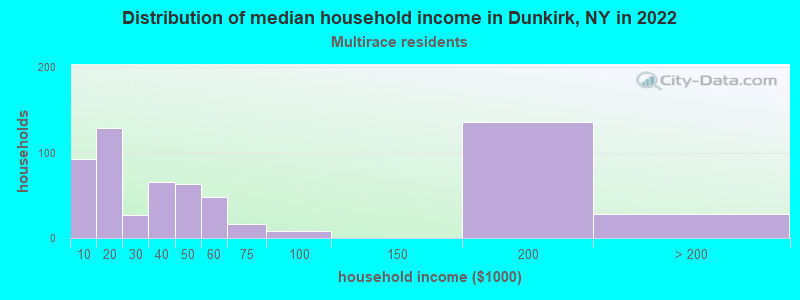
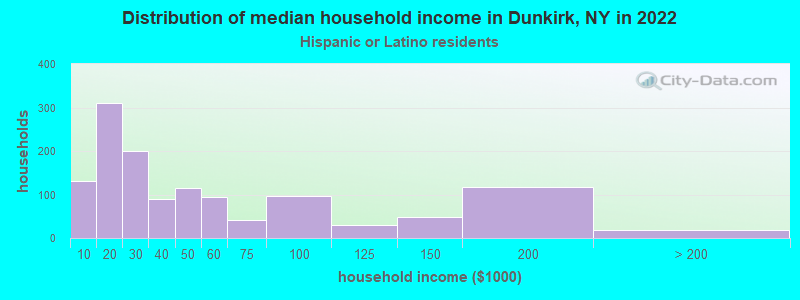
Income and house value in Dunkirk Median household income in 2022 $53,988 White non-Hispanic householders$30,343 Black householders$43,044 Some other race householders$42,794 Two or more races householders$30,898 Hispanic or Latino race householdersMedian 2022 house value $96,876 White Non-Hispanic householders$65,737 Black or African American householders$50,076 American Indian or Alaska Native householders$68,286 Some other race householders$136,573 Two or more races householders$74,113 Hispanic or Latino householders
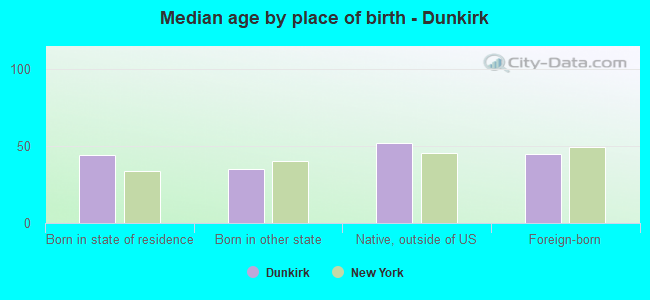
Median age by race in Dunkirk
51.2 Median age for White residents50.6 52.3 39.5 Median age for Black or African American residents30.8 42.6 25.8 Median age for American Indian / Alaska Native residents12.5 24.8 38.1 Median age for Asian residents-565,573,769.9 31.2 -487,992,314.6 Median age for Native Hawaiian / Pacific Islander residents-477,502,295.2 -497,387,669.3 30.8 Median age for Other race residents35.8 40.8 19.6 Median age for Two or more races residents24.7 18.6 52.9 Median age for White alone residents52.6 52.4 30.5 Median age for Hispanic or Latino residents29.9 30.3
Owner/renter occupied households by race in Dunkirk
House owners and renters - White residents 2,959 66.7% Owner occupied1,480 33.3% Renter occupiedHouse owners and renters - Black or African American residents 98 46.5% Owner occupied113 53.5% Renter occupiedHouse owners and renters - American Indian / Alaska Native residents 2 6.5% Owner occupied27 93.5% Renter occupiedHouse owners and renters - Asian residents 12 100.0% Owner occupiedHouse owners and renters - Other race residents 488 59.3% Owner occupied335 40.7% Renter occupiedHouse owners and renters - Two or more races residents 137 26.2% Owner occupied387 73.8% Renter occupiedHouse owners and renters - White alone residents 2,887 69.0% Owner occupied1,295 31.0% Renter occupiedHouse owners and renters - Hispanic or Latino residents 563 38.2% Owner occupied912 61.8% Renter occupied
Language usage in Dunkirk
English speakers - Total 78.7% of residents of Dunkirk speak English at home.
19.5% of residents speak Spanish at home 1,328 57.5% Speak English very well980 42.5% Speak English less than very well2.0% of residents speak other language at home 217 93.5% Speak English very well15 6.5% Speak English less than very well
English speakers - Born in the United States 90.8% of residents of Dunkirk speak English at home.
6.1% of residents speak Spanish at home 88 100.0% Speak English very well
English speakers - Native, born elsewhere 16.9% of residents of Dunkirk speak English at home.
82.8% of residents speak Spanish at home 517 41.4% Speak English very well733 58.6% Speak English less than very well
English speakers - Foreign-born 25.4% of residents of Dunkirk speak English at home.
32.7% of residents speak Spanish at home 46 34.1% Speak English very well89 65.9% Speak English less than very well8.7% of residents speak other language at home 15 41.7% Speak English very well21 58.3% Speak English less than very well
White (Caucasian) - Speak only English Native:
93.7% (7,483)Foreign-born:
57.3% (60)
White (Caucasian) - Speak another language Native:
6.3% (503)Foreign-born:
14.2% (15)
Black or African American - Speak only English Native:
85.5% (811)Foreign-born:
97.5% (4)
American Indian / Alaska Native - Speak another language Native:
21.1% (17)Foreign-born:
100.0% (9)
Other race - Speak another language Native:
86.9% (1,305)Foreign-born:
100.0% (146)
Two or more races - Speak only English Native:
57.2% (907)Foreign-born:
29.0% (21)
Two or more races - Speak another language Native:
43.5% (690)Foreign-born:
70.3% (51)
White alone - Speak only English Native:
97.2% (7,220)Foreign-born:
52.9% (55)
White alone - Speak another language Native:
2.7% (197)Foreign-born:
17.2% (18)
Hispanic or Latino - Speak only English Native:
27.6% (838)Foreign-born:
7.5% (14)
Hispanic or Latino - Speak another language Native:
75.9% (2,306)Foreign-born:
92.3% (170)
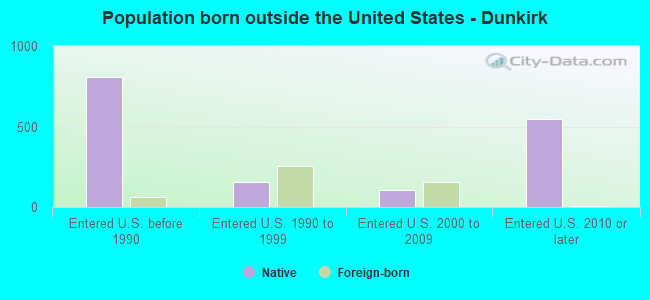
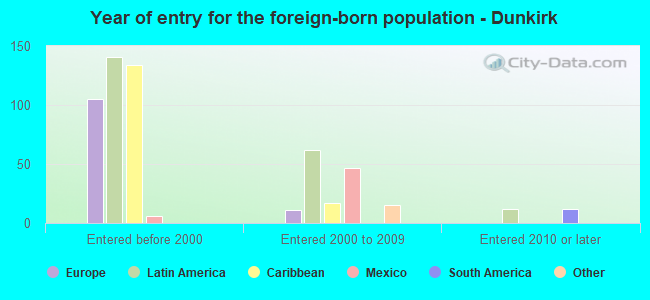
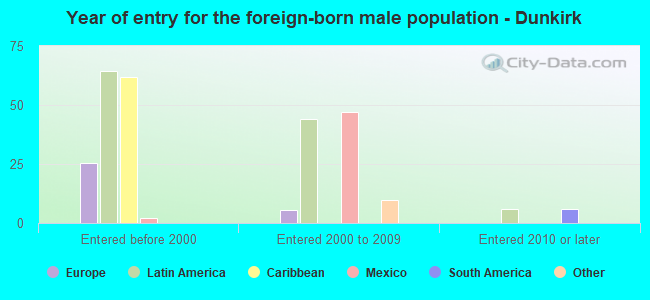
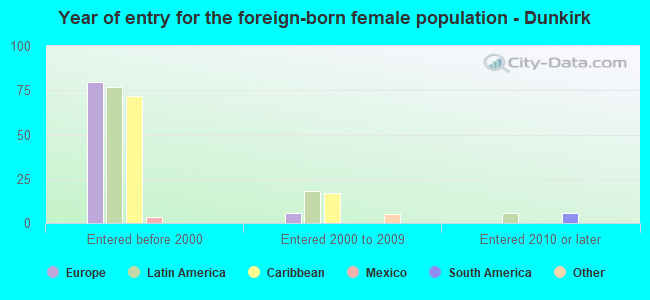
Foreign-born residents in Dunkirk 366 residents are foreign born (1.8% Latin America , 1.0% Europe ).
This city:
2.9%New York:
22.6%
Marital status for residents in Dunkirk Marital status - White (Caucasian) population 15 years and over
Males 45.8% Never married34.5% Now married1.6% Separated3.5% Widowed14.6% DivorcedFemales 31.5% Never married37.6% Now married2.3% Separated11.7% Widowed16.9% DivorcedWomen who gave birth in the past 12 months Now married:
7.8% (9)Unmarried:
92.2% (102)
Women who did not give birth in the past 12 months Now married:
34.0% (513)Unmarried:
66.0% (997)
Marital status - Black or African American population 15 years and over
Males 86.7% Never married13.3% Now married0.0% Separated0.0% Widowed0.0% DivorcedFemales 65.6% Never married18.5% Now married0.0% Separated10.9% Widowed5.0% DivorcedWomen who did not give birth in the past 12 months Now married:
20.9% (50)Unmarried:
79.1% (190)
Marital status - American Indian / Alaska Native population 15 years and over
Males 60.0% Never married40.0% Now married0.0% Separated0.0% Widowed0.0% DivorcedFemales 38.5% Never married61.5% Now married0.0% Separated0.0% Widowed0.0% DivorcedWomen who did not give birth in the past 12 months Now married:
21.1% (6)Unmarried:
78.9% (21)
Marital status - Other race population 15 years and over
Males 40.5% Never married46.0% Now married1.9% Separated0.0% Widowed11.5% DivorcedFemales 54.7% Never married35.0% Now married2.9% Separated1.0% Widowed6.4% DivorcedWomen who gave birth in the past 12 months Now married:
68.2% (50)Unmarried:
31.8% (23)
Women who did not give birth in the past 12 months Now married:
32.2% (122)Unmarried:
67.8% (258)
Marital status - Two or more races population 15 years and over
Males 47.8% Never married30.2% Now married0.0% Separated8.6% Widowed13.3% DivorcedFemales 55.9% Never married13.6% Now married4.3% Separated6.8% Widowed19.4% DivorcedWomen who did not give birth in the past 12 months Now married:
15.4% (46)Unmarried:
84.6% (255)
Marital status - White alone, not Hispanic / Latino population 15 years and over
Males 44.2% Never married36.7% Now married1.3% Separated3.8% Widowed14.0% DivorcedFemales 31.2% Never married38.9% Now married1.9% Separated11.1% Widowed16.8% DivorcedWomen who gave birth in the past 12 months Now married:
7.8% (9)Unmarried:
92.2% (104)
Women who did not give birth in the past 12 months Now married:
33.1% (457)Unmarried:
66.9% (923)
Marital status - Hispanic or Latino population 15 years and over
Males 49.8% Never married31.6% Now married1.9% Separated3.3% Widowed13.4% DivorcedFemales 50.6% Never married25.7% Now married4.6% Separated5.6% Widowed13.4% DivorcedWomen who gave birth in the past 12 months Now married:
68.2% (45)Unmarried:
31.8% (21)
Women who did not give birth in the past 12 months Now married:
29.6% (217)Unmarried:
70.4% (516)
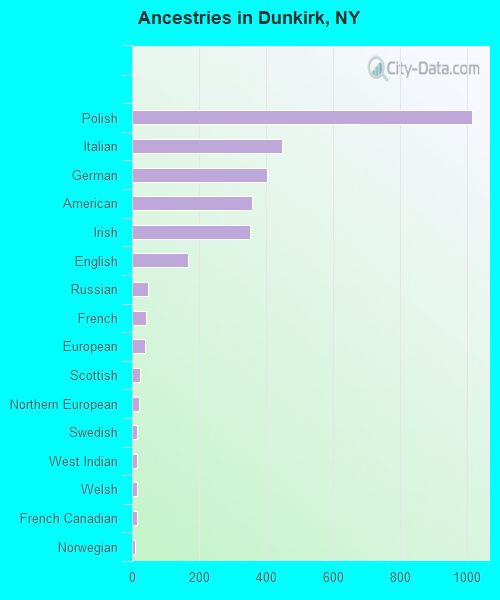
Ancestries in Dunkirk
1,015 18.8% Polish449 8.3% Italian402 7.4% German359 6.6% American352 6.5% Irish167 3.1% English49 0.9% Russian41 0.8% French38 0.7% European23 0.4% Scottish22 0.4% Northern European16 0.3% Swedish16 0.3% West Indian15 0.3% Welsh14 0.3% French Canadian10 0.2% Norwegian8 0.1% Syrian6 0.1% Eastern European6 0.1% Haitian6 0.1% Yugoslavian5 0.09% Portuguese3 0.06% British3 0.06% Jamaican
Geographical mobility in Dunkirk Same house 1 year ago 7,916 94.6% White (Caucasian)1,071 88.9% Black or African American96 100.0% American Indian / Alaska Native13 99.1% Asian1,252 87.7% Other race1,771 99.7% Two or more races7,208 93.4% White alone, not Hispanic / Latino3,458 99.3% Hispanic or LatinoMoved within same county 342 4.1% White / Caucasian140 11.6% Black or African American165 11.5% Other race359 4.7% White alone, not Hispanic / Latino164 4.7% Hispanic or LatinoMoved within same state 108 1.3% White / Caucasian108 1.4% White alone, not Hispanic / LatinoMoved from different state 38 0.5% White / Caucasian16 1.3% Black or African American49 0.6% White alone, not Hispanic / Latino
Children Nativity (place of birth) in Dunkirk
Children under 6 years - Living with two parents Both parents native 125 100.0% NativeOne native, one foreign-born parent 77 100.0% NativeChildren under 6 years - Living with one parent Native parent 534 100.0% NativeChildren 6 to 17 years - Living with two parents Both parents native 471 100.0% NativeBoth parents foreign-born 11 100.0% NativeOne native, one foreign-born parent 25 100.0% NativeChildren 6 to 17 years - Living with one parent Native parent 826 100.0% NativeForeign-born parent 15 50.4% Native15 49.6% Foreign-born
Grandparents responsible for own grandchildren in Dunkirk
Grandparents (30 to 59 years) White / Caucasian 16 100.0% Not responsible for grandchildrenWhite alone, not Hispanic / Latino 16 100.0% Not responsible for grandchildren
Grandparents (60 years and over) White / Caucasian 15 100.0% Not responsible for grandchildrenWhite alone, not Hispanic / Latino 15 100.0% Not responsible for grandchildren