Races in Durham, North Carolina (NC) Detailed Stats
Data:
Races - White alone (%)
Races - White alone (% change since 2000)
Races - Black alone (%)
Races - Black alone (% change since 2000)
Races - American Indian alone (%)
Races - American Indian alone (% change since 2000)
Races - Asian alone (%)
Races - Asian alone (% change since 2000)
Races - Hispanic (%)
Races - Hispanic (% change since 2000)
Races - Native Hawaiian and Other Pacific Islander alone (%)
Races - Native Hawaiian and Other Pacific Islander alone (% change since 2000)
Races - Two or more races(%)
Races - Two or more races(% change since 2000)
Races - Other race alone (%)
Races - Other race alone (% change since 2000)
Racial diversity
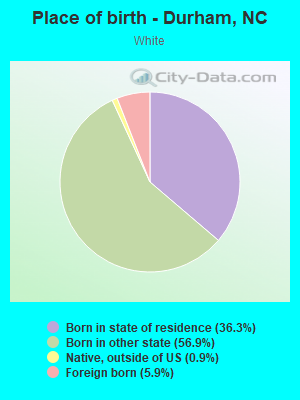
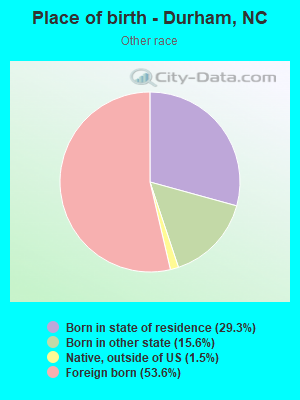
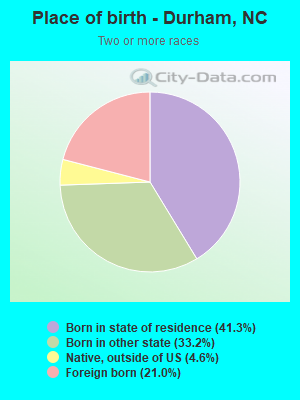
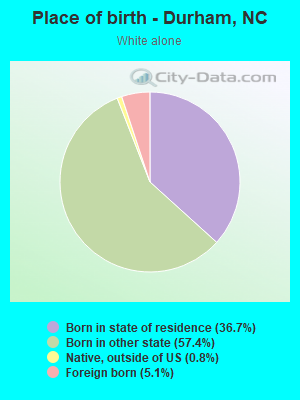
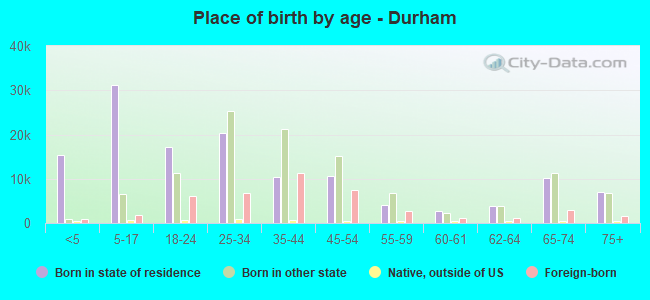
Place of birth - Born in state of residence (%)
Place of birth - Born in state of residence (%) - White
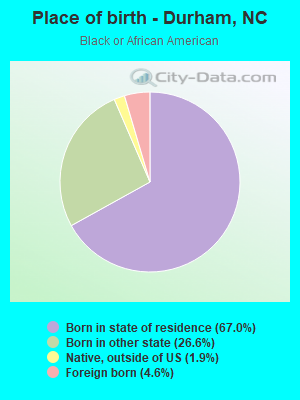
Place of birth - Born in state of residence (%) - Black or African American
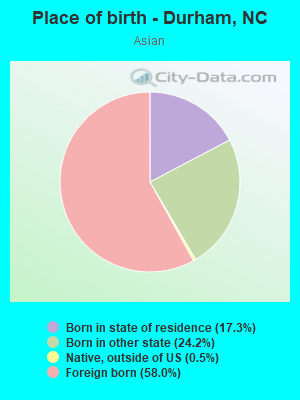
Place of birth - Born in state of residence (%) - Asian
Place of birth - Born in state of residence (%) - Hispanic or Latino
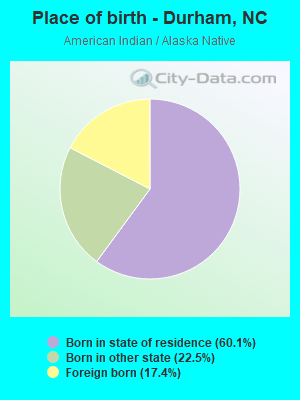
Place of birth - Born in state of residence (%) - American Indian and Alaska Native
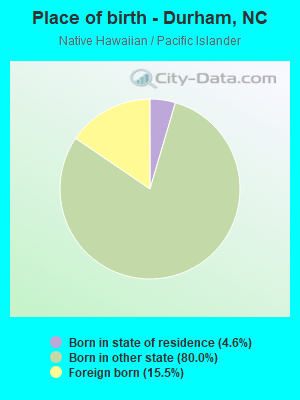
Place of birth - Born in state of residence (%) - Multirace
Place of birth - Born in state of residence (%) - Other Race
Place of birth - Born in other state (%)
Place of birth - Born in other state (%) - White
Place of birth - Born in other state (%) - Black or African American
Place of birth - Born in other state (%) - Asian
Place of birth - Born in other state (%) - Hispanic or Latino
Place of birth - Born in other state (%) - American Indian and Alaska Native
Place of birth - Born in other state (%) - Multirace
Place of birth - Born in other state (%) - Other Race
Place of birth - Native, outside of US (%)
Place of birth - Native, outside of US (%) - White
Place of birth - Native, outside of US (%) - Black or African American
Place of birth - Native, outside of US (%) - Asian
Place of birth - Native, outside of US (%) - Hispanic or Latino
Place of birth - Native, outside of US (%) - American Indian and Alaska Native
Place of birth - Native, outside of US (%) - Multirace
Place of birth - Native, outside of US (%) - Other Race
Place of birth - Foreign born (%)
Place of birth - Foreign born (%) - White
Place of birth - Foreign born (%) - Black or African American
Place of birth - Foreign born (%) - Asian
Place of birth - Foreign born (%) - Hispanic or Latino
Place of birth - Foreign born (%) - American Indian and Alaska Native
Place of birth - Foreign born (%) - Multirace
Place of birth - Foreign born (%) - Other Race
Residents speaking English at home (%)
Residents speaking English at home - Born in the United States (%)
Residents speaking English at home - Native, born elsewhere (%)
Residents speaking English at home - Foreign born (%)
Residents speaking Spanish at home (%)
Residents speaking Spanish at home - Born in the United States (%)
Residents speaking Spanish at home - Native, born elsewhere (%)
Residents speaking Spanish at home - Foreign born (%)
Residents speaking other language at home (%)
Residents speaking other language at home - Born in the United States (%)
Residents speaking other language at home - Native, born elsewhere (%)
Residents speaking other language at home - Foreign born (%)
Marital status - Never married (%)
Marital status - Now married (%)
Marital status - Separated (%)
Marital status - Widowed (%)
Marital status - Divorced (%)
Ancestries Reported - Arab (%)
Ancestries Reported - Czech (%)
Ancestries Reported - Danish (%)
Ancestries Reported - Dutch (%)
Ancestries Reported - English (%)
Ancestries Reported - French (%)
Ancestries Reported - French Canadian (%)
Ancestries Reported - German (%)
Ancestries Reported - Greek (%)
Ancestries Reported - Hungarian (%)
Ancestries Reported - Irish (%)
Ancestries Reported - Italian (%)
Ancestries Reported - Lithuanian (%)
Ancestries Reported - Norwegian (%)
Ancestries Reported - Polish (%)
Ancestries Reported - Portuguese (%)
Ancestries Reported - Russian (%)
Ancestries Reported - Scotch-Irish (%)
Ancestries Reported - Scottish (%)
Ancestries Reported - Slovak (%)
Ancestries Reported - Subsaharan African (%)
Ancestries Reported - Swedish (%)
Ancestries Reported - Swiss (%)
Ancestries Reported - Ukrainian (%)
Ancestries Reported - United States (%)
Ancestries Reported - Welsh (%)
Ancestries Reported - West Indian (%)
Ancestries Reported - Other (%)
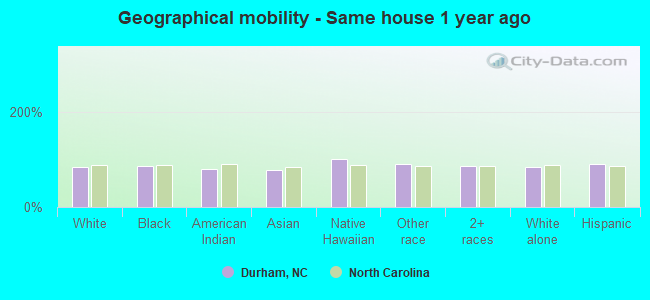
Geographical mobility - Same house 1 year ago (%)
Geographical mobility - Same house 1 year ago (%) - White
Geographical mobility - Same house 1 year ago (%) - Black or African American
Geographical mobility - Same house 1 year ago (%) - Asian
Geographical mobility - Same house 1 year ago (%) - Hispanic or Latino
Geographical mobility - Same house 1 year ago (%) - American Indian and Alaska Native
Geographical mobility - Same house 1 year ago (%) - Multirace
Geographical mobility - Same house 1 year ago (%) - Other Race
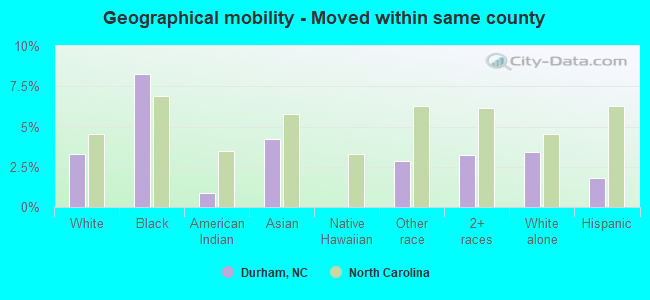
Geographical mobility - Moved within same county (%)
Geographical mobility - Moved within same county (%) - White
Geographical mobility - Moved within same county (%) - Black or African American
Geographical mobility - Moved within same county (%) - Asian
Geographical mobility - Moved within same county (%) - Hispanic or Latino
Geographical mobility - Moved within same county (%) - American Indian and Alaska Native
Geographical mobility - Moved within same county (%) - Multirace
Geographical mobility - Moved within same county (%) - Other Race
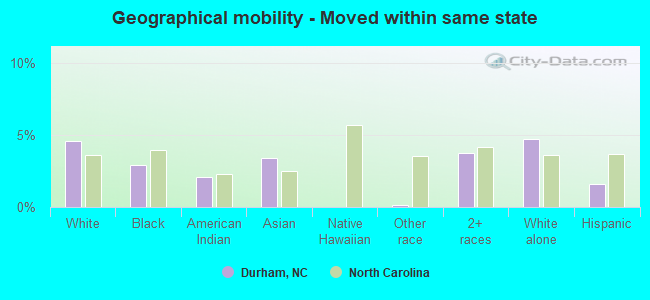
Geographical mobility - Moved from different county within same state (%)
Geographical mobility - Moved from different county within same state (%) - White
Geographical mobility - Moved from different county within same state (%) - Black or African American
Geographical mobility - Moved from different county within same state (%) - Asian
Geographical mobility - Moved from different county within same state (%) - Hispanic or Latino
Geographical mobility - Moved from different county within same state (%) - American Indian and Alaska Native
Geographical mobility - Moved from different county within same state (%) - Multirace
Geographical mobility - Moved from different county within same state (%) - Other Race
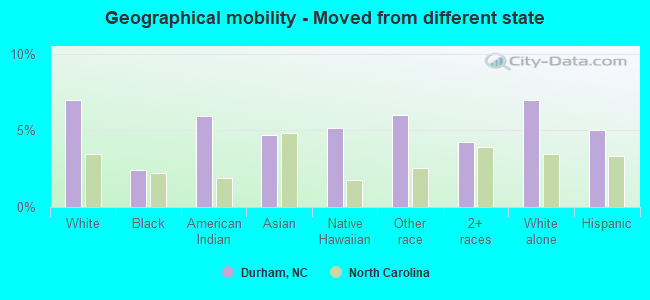
Geographical mobility - Moved from different state (%)
Geographical mobility - Moved from different state (%) - White
Geographical mobility - Moved from different state (%) - Black or African American
Geographical mobility - Moved from different state (%) - Asian
Geographical mobility - Moved from different state (%) - Hispanic or Latino
Geographical mobility - Moved from different state (%) - American Indian and Alaska Native
Geographical mobility - Moved from different state (%) - Multirace
Geographical mobility - Moved from different state (%) - Other Race
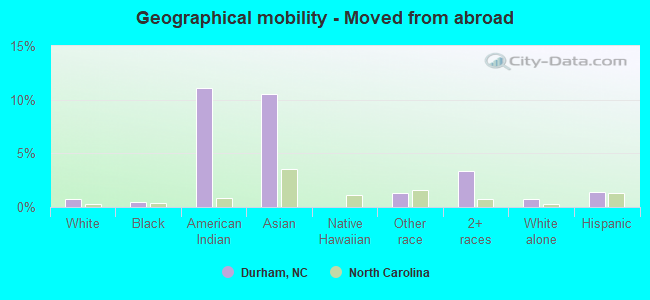
Geographical mobility - Moved from abroad (%)
Geographical mobility - Moved from abroad (%) - White
Geographical mobility - Moved from abroad (%) - Black or African American
Geographical mobility - Moved from abroad (%) - Asian
Geographical mobility - Moved from abroad (%) - Hispanic or Latino
Geographical mobility - Moved from abroad (%) - American Indian and Alaska Native
Geographical mobility - Moved from abroad (%) - Multirace
Geographical mobility - Moved from abroad (%) - Other Race
Place of birth for the foreign-born population - Ireland (%)
Place of birth for the foreign-born population - Denmark (%)
Place of birth for the foreign-born population - Norway (%)
Place of birth for the foreign-born population - Sweden (%)
Place of birth for the foreign-born population - United Kingdom (%)
Place of birth for the foreign-born population - England (%)
Place of birth for the foreign-born population - Scotland (%)
Place of birth for the foreign-born population - Other Northern Europe (%)
Place of birth for the foreign-born population - Austria (%)
Place of birth for the foreign-born population - Belgium (%)
Place of birth for the foreign-born population - France (%)
Place of birth for the foreign-born population - Germany (%)
Place of birth for the foreign-born population - Netherlands (%)
Place of birth for the foreign-born population - Switzerland (%)
Place of birth for the foreign-born population - Other Western Europe (%)
Place of birth for the foreign-born population - Greece (%)
Place of birth for the foreign-born population - Italy (%)
Place of birth for the foreign-born population - Portugal (%)
Place of birth for the foreign-born population - Spain (%)
Place of birth for the foreign-born population - Other Southern Europe (%)
Place of birth for the foreign-born population - Albania (%)
Place of birth for the foreign-born population - Belarus (%)
Place of birth for the foreign-born population - Bosnia and Herzegovina (%)
Place of birth for the foreign-born population - Bulgaria (%)
Place of birth for the foreign-born population - Croatia (%)
Place of birth for the foreign-born population - Czechoslovakia (%)
Place of birth for the foreign-born population - Hungary (%)
Place of birth for the foreign-born population - Latvia (%)
Place of birth for the foreign-born population - Lithuania (%)
Place of birth for the foreign-born population - North Macedonia (Macedonia) (%)
Place of birth for the foreign-born population - Moldova (%)
Place of birth for the foreign-born population - Poland (%)
Place of birth for the foreign-born population - Romania (%)
Place of birth for the foreign-born population - Russia (%)
Place of birth for the foreign-born population - Serbia (%)
Place of birth for the foreign-born population - Ukraine (%)
Place of birth for the foreign-born population - Other Eastern Europe (%)
Place of birth for the foreign-born population - China (%)
Place of birth for the foreign-born population - Hong Kong (%)
Place of birth for the foreign-born population - Taiwan (%)
Place of birth for the foreign-born population - Japan (%)
Place of birth for the foreign-born population - Korea (%)
Place of birth for the foreign-born population - Other Eastern Asia (%)
Place of birth for the foreign-born population - Afghanistan (%)
Place of birth for the foreign-born population - Bangladesh (%)
Place of birth for the foreign-born population - India (%)
Place of birth for the foreign-born population - Iran (%)
Place of birth for the foreign-born population - Kazakhstan (%)
Place of birth for the foreign-born population - Nepal (%)
Place of birth for the foreign-born population - Pakistan (%)
Place of birth for the foreign-born population - Sri Lanka (%)
Place of birth for the foreign-born population - Uzbekistan (%)
Place of birth for the foreign-born population - Other South Central Asia (%)
Place of birth for the foreign-born population - Burma (%)
Place of birth for the foreign-born population - Cambodia (%)
Place of birth for the foreign-born population - Indonesia (%)
Place of birth for the foreign-born population - Laos (%)
Place of birth for the foreign-born population - Malaysia (%)
Place of birth for the foreign-born population - Philippines (%)
Place of birth for the foreign-born population - Singapore (%)
Place of birth for the foreign-born population - Thailand (%)
Place of birth for the foreign-born population - Vietnam (%)
Place of birth for the foreign-born population - Other South Eastern Asia (%)
Place of birth for the foreign-born population - Armenia (%)
Place of birth for the foreign-born population - Iraq (%)
Place of birth for the foreign-born population - Israel (%)
Place of birth for the foreign-born population - Jordan (%)
Place of birth for the foreign-born population - Kuwait (%)
Place of birth for the foreign-born population - Lebanon (%)
Place of birth for the foreign-born population - Saudi Arabia (%)
Place of birth for the foreign-born population - Syria (%)
Place of birth for the foreign-born population - Turkey (%)
Place of birth for the foreign-born population - Yemen (%)
Place of birth for the foreign-born population - Other Western Asia (%)
Place of birth for the foreign-born population - Eritrea (%)
Place of birth for the foreign-born population - Ethiopia (%)
Place of birth for the foreign-born population - Kenya (%)
Place of birth for the foreign-born population - Somalia (%)
Place of birth for the foreign-born population - Uganda (%)
Place of birth for the foreign-born population - Zimbabwe (%)
Place of birth for the foreign-born population - Other Eastern Africa (%)
Place of birth for the foreign-born population - Cameroon (%)
Place of birth for the foreign-born population - Congo (%)
Place of birth for the foreign-born population - Democratic Republic of Congo (Zaire) (%)
Place of birth for the foreign-born population - Other Middle Africa (%)
Place of birth for the foreign-born population - Egypt (%)
Place of birth for the foreign-born population - Morocco (%)
Place of birth for the foreign-born population - Sudan (%)
Place of birth for the foreign-born population - Other Northern Africa (%)
Place of birth for the foreign-born population - South Africa (%)
Place of birth for the foreign-born population - Other Southern Africa (%)
Place of birth for the foreign-born population - Cabo Verde (%)
Place of birth for the foreign-born population - Ghana (%)
Place of birth for the foreign-born population - Liberia (%)
Place of birth for the foreign-born population - Nigeria (%)
Place of birth for the foreign-born population - Senegal (%)
Place of birth for the foreign-born population - Sierra Leone (%)
Place of birth for the foreign-born population - Other Western Africa (%)
Place of birth for the foreign-born population - Australia (%)
Place of birth for the foreign-born population - New Zealand (%)
Place of birth for the foreign-born population - Fiji (%)
Place of birth for the foreign-born population - Micronesia (%)
Place of birth for the foreign-born population - Bahamas (%)
Place of birth for the foreign-born population - Barbados (%)
Place of birth for the foreign-born population - Cuba (%)
Place of birth for the foreign-born population - Dominica (%)
Place of birth for the foreign-born population - Dominican Republic (%)
Place of birth for the foreign-born population - Grenada (%)
Place of birth for the foreign-born population - Haiti (%)
Place of birth for the foreign-born population - Jamaica (%)
Place of birth for the foreign-born population - St. Vincent and the Grenadines (%)
Place of birth for the foreign-born population - Trinidad and Tobago (%)
Place of birth for the foreign-born population - West Indies (%)
Place of birth for the foreign-born population - Other Caribbean (%)
Place of birth for the foreign-born population - Belize (%)
Place of birth for the foreign-born population - Costa Rica (%)
Place of birth for the foreign-born population - El Salvador (%)
Place of birth for the foreign-born population - Guatemala (%)
Place of birth for the foreign-born population - Honduras (%)
Place of birth for the foreign-born population - Mexico (%)
Place of birth for the foreign-born population - Nicaragua (%)
Place of birth for the foreign-born population - Panama (%)
Place of birth for the foreign-born population - Other Central America (%)
Place of birth for the foreign-born population - Argentina (%)
Place of birth for the foreign-born population - Bolivia (%)
Place of birth for the foreign-born population - Brazil (%)
Place of birth for the foreign-born population - Chile (%)
Place of birth for the foreign-born population - Colombia (%)
Place of birth for the foreign-born population - Ecuador (%)
Place of birth for the foreign-born population - Guyana (%)
Place of birth for the foreign-born population - Peru (%)
Place of birth for the foreign-born population - Uruguay (%)
Place of birth for the foreign-born population - Venezuela (%)
Place of birth for the foreign-born population - Other South America (%)
Place of birth for the foreign-born population - Canada (%)
Place of birth for the foreign-born population - Other Northern America (%)
Place of birth for the foreign-born population - Other (%)
Latest news about races in Durham, NC collected exclusively by city-data.com from local newspapers, TV, and radio stations
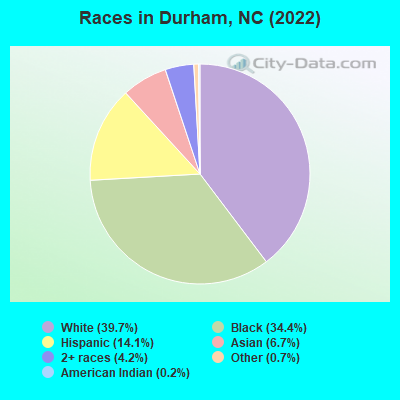
According to 2022 data, the most numerous races in Durham, NC are White alone (115,735 residents), Black alone (100,298 residents), and Hispanic (41,166 residents). 79.1% of Durham residents speak English at home. 15.3% of Durham, NC residents are foreign-born (7.0% born in Latin America, 4.3% born in Asia, 1.7% born in Africa), which is 47.7% greater than the foreign-born rate of 8.0% across the entire state of North Carolina.
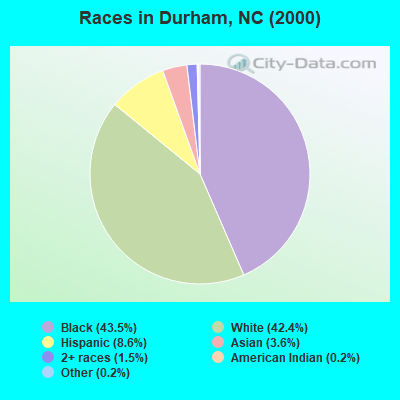
Race distribution in Durham
2000 2022
81,370 43.5% Black alone 79,277 42.4% White alone 16,012 8.6% Hispanic 6,782 3.6% Asian alone 2,721 1.5% Two or more races 455 0.2% American Indian alone 360 0.2% Other race alone 58 0.03% Native Hawaiian and Other
115,735 39.7% White alone 100,298 34.4% Black alone 41,166 14.1% Hispanic 19,658 6.7% Asian alone 12,252 4.2% Two or more races 2,095 0.7% Other race alone 640 0.2% American Indian alone
2000 2022
5,647,155 70.2% White alone 1,723,301 21.4% Black alone 378,963 4.7% Hispanic 112,416 1.4% Asian alone 95,333 1.2% American Indian alone 79,965 1.0% Two or more races 9,015 0.1% Other race alone 3,165 0.04% Native Hawaiian and Other
6,497,519 60.7% White alone 2,155,650 20.1% Black alone 1,114,799 10.4% Hispanic 438,061 4.1% Two or more races 341,052 3.2% Asian alone 91,758 0.9% American Indian alone 50,180 0.5% Other race alone 9,954 0.09% Native Hawaiian and Other
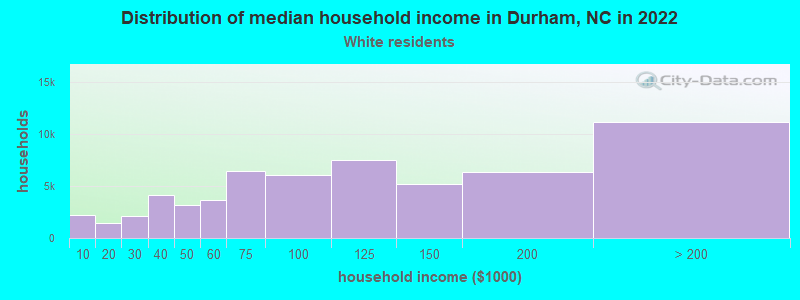
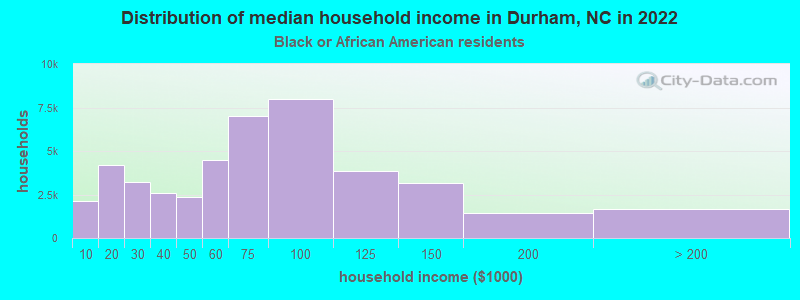
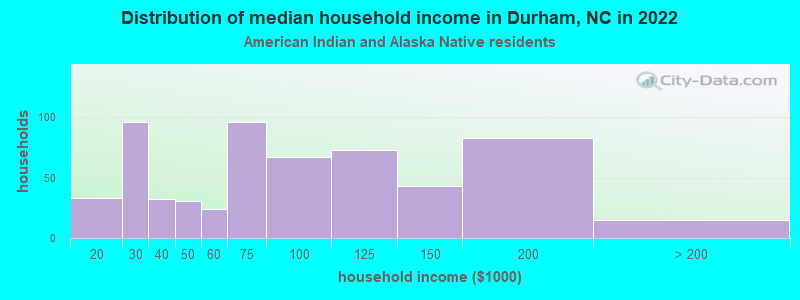
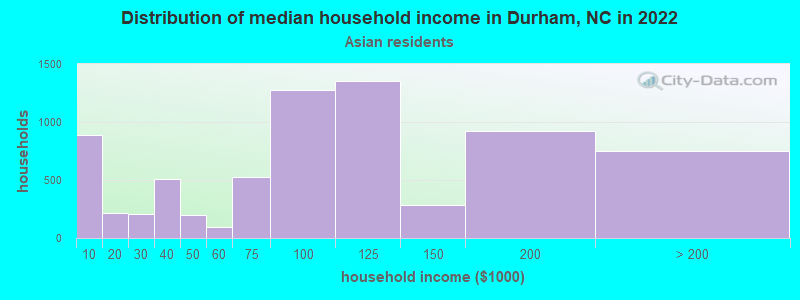
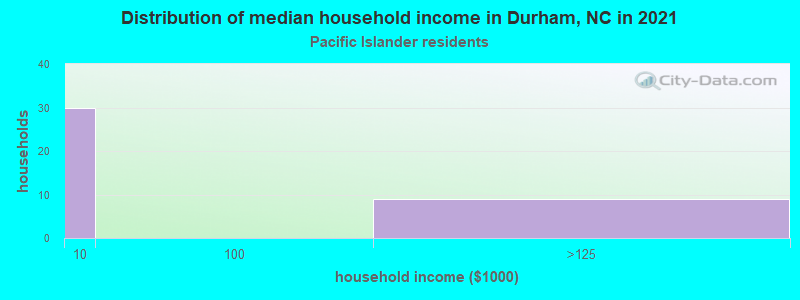
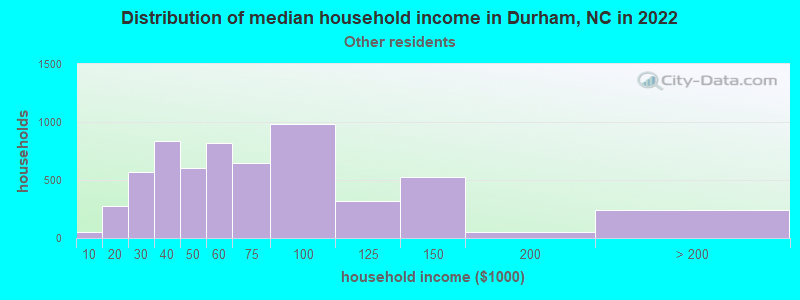
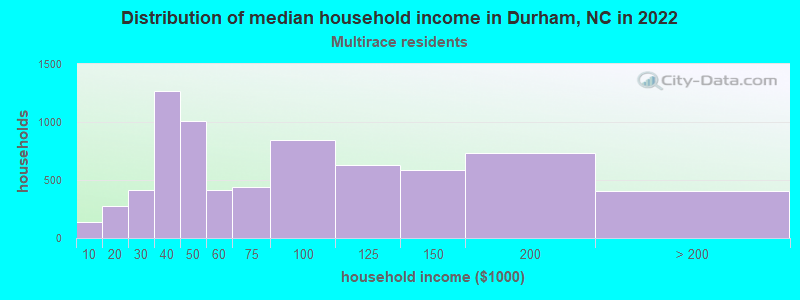
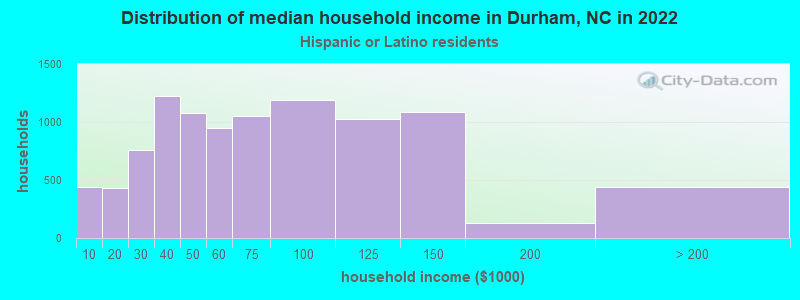
Income and house value in Durham Median household income in 2022 $101,415 White non-Hispanic householders$67,876 Black householders$67,232 American Indian and Alaska Native householders$91,206 Asian householders$57,219 Some other race householders$72,619 Two or more races householders$62,841 Hispanic or Latino race householdersMedian 2022 house value $438,746 White Non-Hispanic householders$297,106 Black or African American householders$422,462 American Indian or Alaska Native householders $426,456 Asian householders$323,221 Some other race householders$384,363 Two or more races householders$402,491 Hispanic or Latino householders
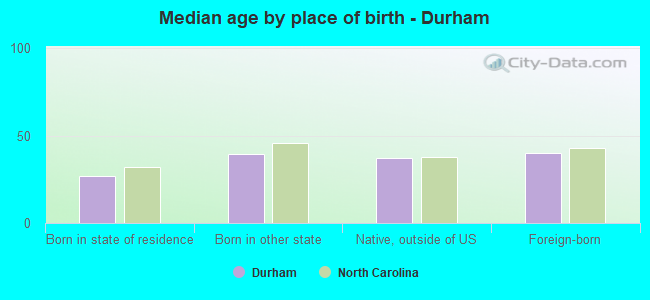
Median age by race in Durham
37.6 Median age for White residents37.3 37.8 36.6 Median age for Black or African American residents34.5 37.7 26.5 Median age for American Indian / Alaska Native residents27.7 22.6 32.6 Median age for Asian residents32.8 32.6 -666,666,666.0 Median age for Native Hawaiian / Pacific Islander residents-666,666,666.0 -666,666,666.0 25.3 Median age for Other race residents28.3 21.6 24.6 Median age for Two or more races residents24.7 24.6 37.8 Median age for White alone residents37.4 38.0 24.4 Median age for Hispanic or Latino residents28.3 21.0
Owner/renter occupied households by race in Durham
House owners and renters - White residents 36,936 62.3% Owner occupied22,398 37.7% Renter occupiedHouse owners and renters - Black or African American residents 19,060 43.2% Owner occupied25,010 56.8% Renter occupiedHouse owners and renters - American Indian / Alaska Native residents 192 32.6% Owner occupied398 67.4% Renter occupiedHouse owners and renters - Asian residents 3,861 53.4% Owner occupied3,370 46.6% Renter occupiedHouse owners and renters - Native Hawaiian / Pacific Islander residents 38 100.0% Renter occupiedHouse owners and renters - Other race residents 2,453 32.8% Owner occupied5,016 67.2% Renter occupiedHouse owners and renters - Two or more races residents 2,193 36.6% Owner occupied3,791 63.4% Renter occupiedHouse owners and renters - White alone residents 36,200 62.3% Owner occupied21,887 37.7% Renter occupiedHouse owners and renters - Hispanic or Latino residents 3,387 34.6% Owner occupied6,416 65.4% Renter occupied
Language usage in Durham
English speakers - Total 79.1% of residents of Durham speak English at home.
12.4% of residents speak Spanish at home 18,659 54.8% Speak English very well15,381 45.2% Speak English less than very well8.5% of residents speak other language at home 17,029 73.3% Speak English very well6,190 26.7% Speak English less than very well
English speakers - Born in the United States 90.7% of residents of Durham speak English at home.
6.2% of residents speak Spanish at home 6,779 99.2% Speak English very well54 0.8% Speak English less than very well3.1% of residents speak other language at home 2,847 82.3% Speak English very well612 17.7% Speak English less than very well
English speakers - Native, born elsewhere 79.7% of residents of Durham speak English at home.
18.0% of residents speak Spanish at home 335 42.0% Speak English very well462 58.0% Speak English less than very well2.3% of residents speak other language at home 103 100.0% Speak English very well
English speakers - Foreign-born 14.9% of residents of Durham speak English at home.
43.7% of residents speak Spanish at home 4,290 23.2% Speak English very well14,234 76.8% Speak English less than very well41.4% of residents speak other language at home 12,170 69.4% Speak English very well5,372 30.6% Speak English less than very well
White (Caucasian) - Speak only English Native:
95.1% (101,524)Foreign-born:
31.2% (2,198)
White (Caucasian) - Speak another language Native:
4.9% (5,185)Foreign-born:
68.8% (4,837)
Black or African American - Speak only English Native:
98.8% (91,053)Foreign-born:
34.0% (1,576)
Black or African American - Speak another language Native:
1.2% (1,093)Foreign-born:
66.0% (3,056)
American Indian / Alaska Native - Speak only English Native:
75.5% (688)Foreign-born:
9.6% (32)
American Indian / Alaska Native - Speak another language Native:
28.9% (263)Foreign-born:
87.0% (294)
Asian - Speak only English Native:
61.6% (4,549)Foreign-born:
12.8% (1,449)
Asian - Speak another language Native:
38.4% (2,832)Foreign-born:
87.2% (9,902)
Other race - Speak only English Native:
18.0% (2,052)Foreign-born:
1.2% (180)
Other race - Speak another language Native:
82.0% (9,321)Foreign-born:
98.8% (14,610)
Two or more races - Speak only English Native:
83.1% (11,240)Foreign-born:
20.9% (892)
Two or more races - Speak another language Native:
16.9% (2,294)Foreign-born:
79.1% (3,375)
White alone - Speak only English Native:
95.9% (100,258)Foreign-born:
29.2% (1,694)
White alone - Speak another language Native:
4.1% (4,264)Foreign-born:
70.8% (4,098)
Hispanic or Latino - Speak only English Native:
24.4% (4,115)Foreign-born:
6.4% (1,269)
Hispanic or Latino - Speak another language Native:
75.6% (12,723)Foreign-born:
93.6% (18,524)
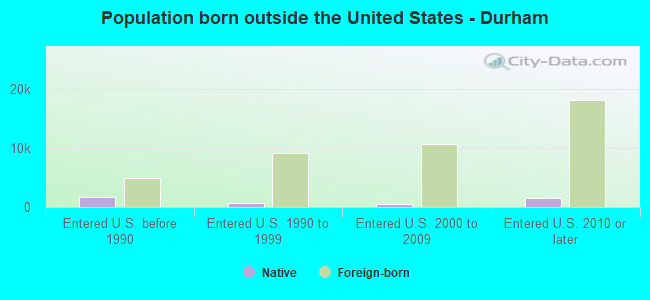
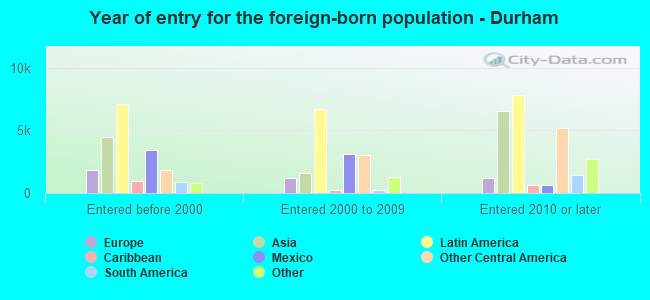
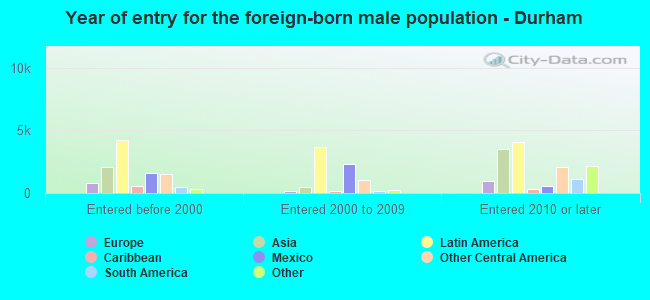
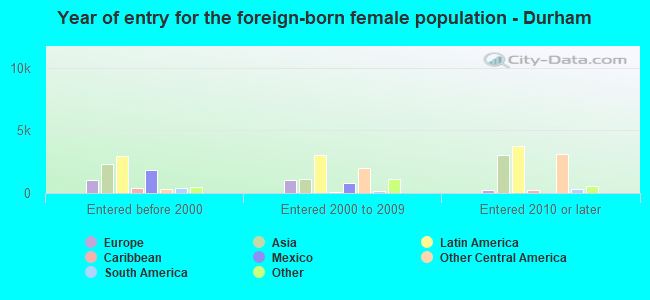
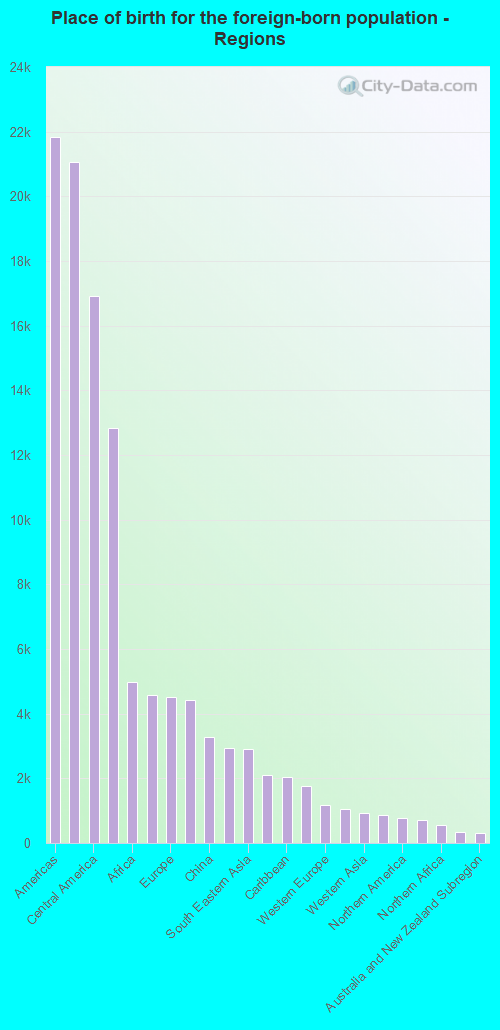
Foreign-born residents in Durham 44,507 residents are foreign born (7.0% Latin America , 4.3% Asia , 1.7% Africa ).
This city:
15.3%North Carolina:
8.3%
Marital status for residents in Durham Marital status - White (Caucasian) population 15 years and over
Males 34.6% Never married52.3% Now married1.9% Separated2.0% Widowed9.3% DivorcedFemales 35.2% Never married46.5% Now married0.9% Separated4.4% Widowed13.1% DivorcedWomen who gave birth in the past 12 months Now married:
90.5% (785)Unmarried:
9.5% (82)
Women who did not give birth in the past 12 months Now married:
43.5% (14,166)Unmarried:
56.5% (18,426)
Marital status - Black or African American population 15 years and over
Males 51.9% Never married31.7% Now married4.0% Separated3.5% Widowed8.8% DivorcedFemales 51.1% Never married25.1% Now married1.5% Separated5.9% Widowed16.5% DivorcedWomen who gave birth in the past 12 months Now married:
41.1% (155)Unmarried:
58.9% (222)
Women who did not give birth in the past 12 months Now married:
23.2% (6,509)Unmarried:
76.8% (21,488)
Marital status - American Indian / Alaska Native population 15 years and over
Males 35.0% Never married34.6% Now married5.9% Separated0.0% Widowed24.4% DivorcedFemales 31.6% Never married49.7% Now married0.0% Separated10.4% Widowed8.2% DivorcedWomen who did not give birth in the past 12 months Now married:
43.6% (97)Unmarried:
56.4% (126)
Marital status - Asian population 15 years and over
Males 47.8% Never married47.1% Now married0.1% Separated1.1% Widowed4.0% DivorcedFemales 44.1% Never married47.3% Now married0.0% Separated3.6% Widowed5.0% DivorcedWomen who gave birth in the past 12 months Now married:
92.8% (755)Unmarried:
7.2% (59)
Women who did not give birth in the past 12 months Now married:
37.2% (2,134)Unmarried:
62.8% (3,610)
Marital status - Native Hawaiian / Pacific Islander population 15 years and over
Males 0.0% Never married100.0% Now married0.0% Separated0.0% Widowed0.0% DivorcedFemales 100.0% Never married0.0% Now married0.0% Separated0.0% Widowed0.0% DivorcedWomen who did not give birth in the past 12 months Now married:
0.0% (0)Unmarried:
100.0% (9)
Marital status - Other race population 15 years and over
Males 51.0% Never married43.0% Now married1.6% Separated1.3% Widowed3.1% DivorcedFemales 49.5% Never married41.5% Now married4.2% Separated0.6% Widowed4.1% DivorcedWomen who gave birth in the past 12 months Now married:
93.9% (179)Unmarried:
6.1% (12)
Women who did not give birth in the past 12 months Now married:
42.6% (3,079)Unmarried:
57.4% (4,142)
Marital status - Two or more races population 15 years and over
Males 50.2% Never married43.7% Now married0.9% Separated0.0% Widowed5.3% DivorcedFemales 42.4% Never married43.5% Now married3.4% Separated3.6% Widowed7.1% DivorcedWomen who gave birth in the past 12 months Now married:
100.0% (156)Unmarried:
0.0% (0)
Women who did not give birth in the past 12 months Now married:
44.3% (2,328)Unmarried:
55.7% (2,926)
Marital status - White alone, not Hispanic / Latino population 15 years and over
Males 34.1% Never married52.8% Now married1.5% Separated2.0% Widowed9.5% DivorcedFemales 34.5% Never married47.0% Now married0.9% Separated4.5% Widowed13.0% DivorcedWomen who gave birth in the past 12 months Now married:
90.5% (785)Unmarried:
9.5% (82)
Women who did not give birth in the past 12 months Now married:
44.5% (13,936)Unmarried:
55.5% (17,393)
Marital status - Hispanic or Latino population 15 years and over
Males 54.5% Never married40.6% Now married4.0% Separated0.0% Widowed1.0% DivorcedFemales 54.8% Never married38.2% Now married2.8% Separated0.9% Widowed3.3% DivorcedWomen who gave birth in the past 12 months Now married:
56.6% (43)Unmarried:
43.4% (33)
Women who did not give birth in the past 12 months Now married:
37.1% (4,204)Unmarried:
62.9% (7,140)
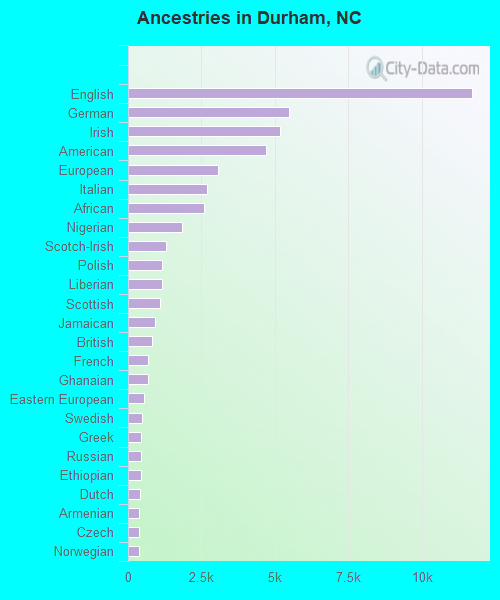
Ancestries in Durham
11,704 6.8% English5,477 3.2% German5,158 3.0% Irish4,684 2.7% American3,077 1.8% European2,702 1.6% Italian2,577 1.5% African1,827 1.1% Nigerian1,281 0.7% Scotch-Irish1,157 0.7% Polish1,153 0.7% Liberian1,088 0.6% Scottish908 0.5% Jamaican822 0.5% British672 0.4% French670 0.4% Ghanaian552 0.3% Eastern European467 0.3% Swedish441 0.3% Greek429 0.2% Russian426 0.2% Ethiopian397 0.2% Dutch383 0.2% Armenian372 0.2% Czech358 0.2% Norwegian310 0.2% Kenyan262 0.2% Arab234 0.1% Moroccan231 0.1% West Indian231 0.1% Welsh190 0.1% Lithuanian185 0.1% Belizean172 0.1% Northern European167 0.10% New Zealander156 0.09% Ukrainian155 0.09% Sierra Leonean139 0.08% Lebanese138 0.08% Iranian132 0.08% Canadian131 0.08% Afghan126 0.07% Egyptian125 0.07% Portuguese123 0.07% Hungarian105 0.06% French Canadian103 0.06% Finnish100 0.06% Romanian100 0.06% Bahamian98 0.06% Palestinian96 0.06% Brazilian86 0.05% Trinidadian and Tobagonian86 0.05% Haitian84 0.05% British West Indian80 0.05% Scandinavian80 0.05% Sudanese80 0.05% Israeli66 0.04% Swiss60 0.03% Danish57 0.03% South African56 0.03% German Russian54 0.03% Slovak49 0.03% Latvian49 0.03% Albanian48 0.03% Slovene44 0.03% Belgian43 0.03% Austrian43 0.03% Icelander41 0.02% Australian39 0.02% Turkish37 0.02% Croatian35 0.02% Slavic35 0.02% Cajun31 0.02% Syrian30 0.02% Barbadian28 0.02% U.S. Virgin Islander27 0.02% Guyanese24 0.01% Maltese24 0.01% Celtic22 0.01% Bulgarian17 0.01% Ugandan16 0.01% Serbian16 0.01% Assyrian13 0.01% Macedonian10 0.01% Cypriot
Geographical mobility in Durham Same house 1 year ago 100,745 84.4% White (Caucasian)86,919 86.0% Black or African American1,315 80.0% American Indian / Alaska Native14,743 77.2% Asian213 100.0% Native Hawaiian / Pacific Islander25,428 89.7% Other race17,030 85.4% Two or more races96,917 84.1% White alone, not Hispanic / Latino36,720 90.1% Hispanic or LatinoMoved within same county 3,933 3.3% White / Caucasian8,344 8.3% Black or African American14 0.9% American Indian / Alaska Native810 4.2% Asian818 2.9% Other race648 3.2% Two or more races3,927 3.4% White alone, not Hispanic / Latino743 1.8% Hispanic or LatinoMoved within same state 5,485 4.6% White / Caucasian2,954 2.9% Black or African American34 2.1% American Indian / Alaska Native649 3.4% Asian30 0.1% Other race749 3.8% Two or more races5,429 4.7% White alone, not Hispanic / Latino650 1.6% Hispanic or LatinoMoved from different state 8,310 7.0% White / Caucasian2,406 2.4% Black or African American98 6.0% American Indian / Alaska Native898 4.7% Asian11 5.1% Native Hawaiian / Pacific Islander1,693 6.0% Other race848 4.3% Two or more races8,066 7.0% White alone, not Hispanic / Latino2,054 5.0% Hispanic or LatinoMoved from abroad 867 0.7% White425 0.4% Black or African American183 11.1% American Indian / Alaska Native2,006 10.5% Asian378 1.3% Other race664 3.3% Two or more races867 0.8% White alone, not Hispanic / Latino577 1.4% Hispanic or Latino
Children Nativity (place of birth) in Durham
Children under 6 years - Living with two parents Both parents native 7,142 100.0% NativeBoth parents foreign-born 2,650 85.2% Native461 14.8% Foreign-bornOne native, one foreign-born parent 780 100.0% NativeChildren under 6 years - Living with one parent Native parent 5,128 100.0% NativeForeign-born parent 1,118 100.0% NativeChildren 6 to 17 years - Living with two parents Both parents native 12,455 97.5% Native323 2.5% Foreign-bornBoth parents foreign-born 5,903 84.6% Native1,072 15.4% Foreign-bornOne native, one foreign-born parent 1,771 100.0% NativeChildren 6 to 17 years - Living with one parent Native parent 11,502 100.0% NativeForeign-born parent 3,523 52.5% Native3,182 47.5% Foreign-born
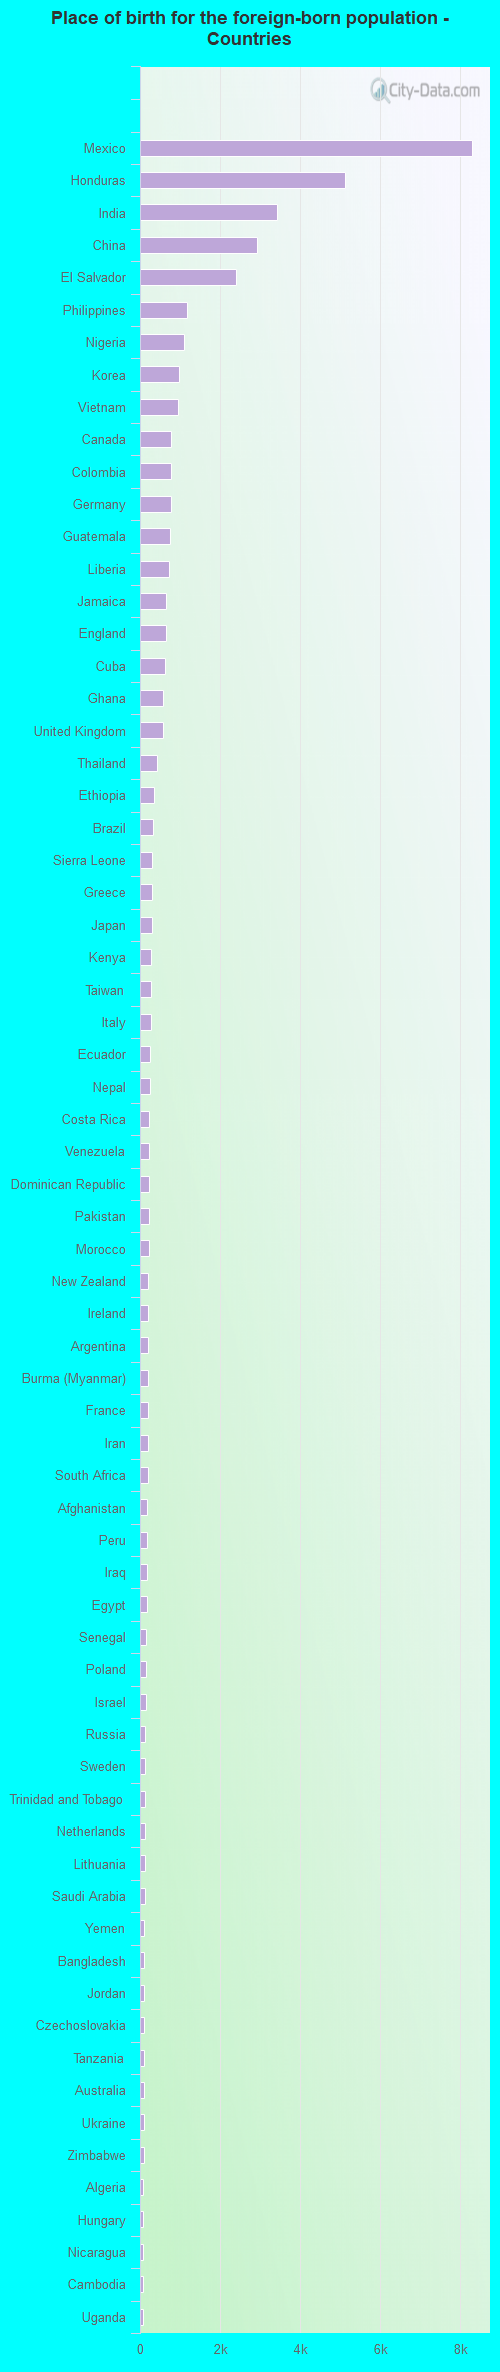
Place of birth for residents in Durham 21,833 Americas21,062 Latin America16,910 Central America12,826 Asia4,994 Africa4,565 Eastern Asia4,528 Europe4,418 South Central Asia3,271 China2,946 Western Africa2,921 South Eastern Asia2,108 South America2,042 Caribbean1,749 Northern Europe1,189 Western Europe1,039 Eastern Africa921 Western Asia856 Eastern Europe771 Northern America698 Southern Europe568 Northern Africa325 Oceania304 Australia and New Zealand Subregion198 Southern Africa104 Middle Africa8,300 Mexico5,125 Honduras3,412 India2,919 China2,395 El Salvador1,170 Philippines1,090 Nigeria982 Korea949 Vietnam771 Canada770 Colombia768 Germany738 Guatemala714 Liberia661 Jamaica654 England615 Cuba571 Ghana565 United Kingdom414 Thailand350 Ethiopia335 Brazil311 Sierra Leone306 Greece301 Japan282 Kenya282 Taiwan273 Italy249 Ecuador240 Nepal234 Costa Rica234 Venezuela216 Dominican Republic215 Pakistan213 Morocco212 New Zealand199 Ireland197 Argentina194 Burma (Myanmar)191 France190 Iran188 South Africa183 Afghanistan181 Peru179 Iraq176 Egypt151 Senegal143 Poland141 Israel136 Russia135 Sweden132 Trinidad and Tobago129 Netherlands122 Lithuania118 Saudi Arabia111 Yemen102 Bangladesh100 Jordan97 Czechoslovakia91 Tanzania91 Australia90 Ukraine89 Zimbabwe85 Algeria85 Hungary84 Nicaragua83 Cambodia81 Uganda74 Bahamas74 Kuwait69 Hong Kong67 Turkey67 St. Vincent and the Grenadines66 Spain65 Haiti64 Barbados61 Eritrea61 Sri Lanka55 Singapore54 Democratic Republic of Congo (Zaire)54 Romania51 Portugal50 Togo50 Sudan50 Switzerland49 Cameroon48 Belgium44 Syria43 Chile41 Serbia41 Uruguay29 Dominica27 Scotland27 Belize25 West Indies25 Indonesia25 Belarus22 Laos21 Micronesia20 Guyana17 Denmark17 Bolivia17 Bulgaria15 Lebanon12 Georgia11 Armenia7 St. Lucia6 Malaysia5 Panama4 Uzbekistan3 Latvia
Grandparents responsible for own grandchildren in Durham
Grandparents (30 to 59 years) White / Caucasian 112 42.9% Responsible for grandchildren149 57.1% Not responsible for grandchildrenBlack or African American 186 24.5% Responsible for grandchildren574 75.5% Not responsible for grandchildrenAmerican Indian / Alaska Native 27 100.0% Not responsible for grandchildrenAsian 215 100.0% Not responsible for grandchildrenOther race 36 100.0% Not responsible for grandchildrenTwo or more races 12 23.0% Responsible for grandchildren39 77.0% Not responsible for grandchildrenWhite alone, not Hispanic / Latino 46 32.5% Responsible for grandchildren95 67.5% Not responsible for grandchildrenHispanic or Latino 72 32.9% Responsible for grandchildren146 67.1% Not responsible for grandchildrenGrandparents (60 years and over) White / Caucasian 40 17.9% Responsible for grandchildren182 82.1% Not responsible for grandchildrenBlack or African American 580 29.7% Responsible for grandchildren1,370 70.3% Not responsible for grandchildrenAsian 333 100.0% Not responsible for grandchildrenOther race 55 100.0% Not responsible for grandchildrenTwo or more races 152 77.4% Responsible for grandchildren44 22.6% Not responsible for grandchildrenWhite alone, not Hispanic / Latino 41 20.0% Responsible for grandchildren163 80.0% Not responsible for grandchildrenHispanic or Latino 101 100.0% Not responsible for grandchildren