Races in Dyersburg, Tennessee (TN) Detailed Stats
Data:
Races - White alone (%)
Races - White alone (% change since 2000)
Races - Black alone (%)
Races - Black alone (% change since 2000)
Races - American Indian alone (%)
Races - American Indian alone (% change since 2000)
Races - Asian alone (%)
Races - Asian alone (% change since 2000)
Races - Hispanic (%)
Races - Hispanic (% change since 2000)
Races - Native Hawaiian and Other Pacific Islander alone (%)
Races - Native Hawaiian and Other Pacific Islander alone (% change since 2000)
Races - Two or more races(%)
Races - Two or more races(% change since 2000)
Races - Other race alone (%)
Races - Other race alone (% change since 2000)
Racial diversity
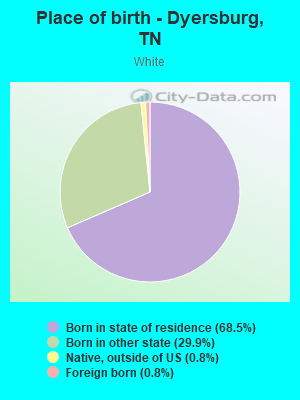
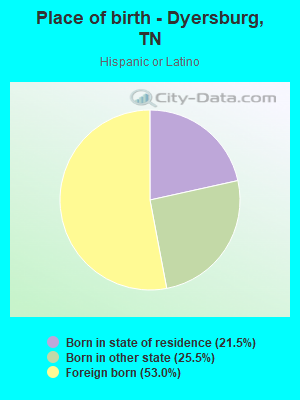
Place of birth - Born in state of residence (%)
Place of birth - Born in state of residence (%) - White
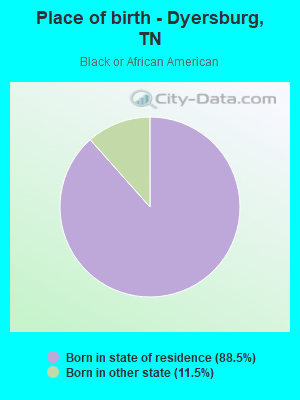
Place of birth - Born in state of residence (%) - Black or African American
Place of birth - Born in state of residence (%) - Asian
Place of birth - Born in state of residence (%) - Hispanic or Latino
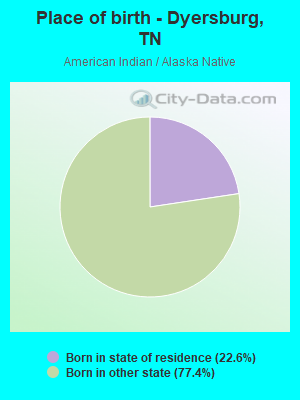
Place of birth - Born in state of residence (%) - American Indian and Alaska Native
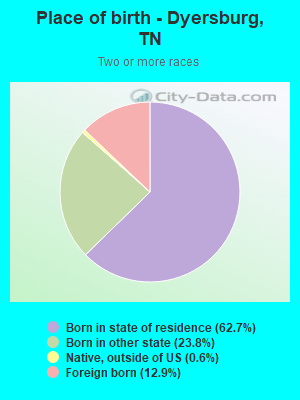
Place of birth - Born in state of residence (%) - Multirace
Place of birth - Born in state of residence (%) - Other Race
Place of birth - Born in other state (%)
Place of birth - Born in other state (%) - White
Place of birth - Born in other state (%) - Black or African American
Place of birth - Born in other state (%) - Asian
Place of birth - Born in other state (%) - Hispanic or Latino
Place of birth - Born in other state (%) - American Indian and Alaska Native
Place of birth - Born in other state (%) - Multirace
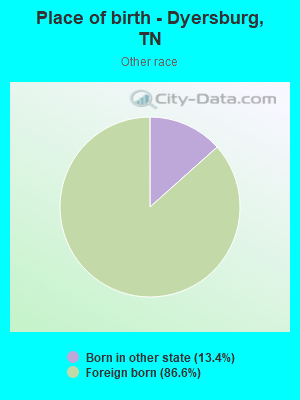
Place of birth - Born in other state (%) - Other Race
Place of birth - Native, outside of US (%)
Place of birth - Native, outside of US (%) - White
Place of birth - Native, outside of US (%) - Black or African American
Place of birth - Native, outside of US (%) - Asian
Place of birth - Native, outside of US (%) - Hispanic or Latino
Place of birth - Native, outside of US (%) - American Indian and Alaska Native
Place of birth - Native, outside of US (%) - Multirace
Place of birth - Native, outside of US (%) - Other Race
Place of birth - Foreign born (%)
Place of birth - Foreign born (%) - White
Place of birth - Foreign born (%) - Black or African American
Place of birth - Foreign born (%) - Asian
Place of birth - Foreign born (%) - Hispanic or Latino
Place of birth - Foreign born (%) - American Indian and Alaska Native
Place of birth - Foreign born (%) - Multirace
Place of birth - Foreign born (%) - Other Race
Residents speaking English at home (%)
Residents speaking English at home - Born in the United States (%)
Residents speaking English at home - Native, born elsewhere (%)
Residents speaking English at home - Foreign born (%)
Residents speaking Spanish at home (%)
Residents speaking Spanish at home - Born in the United States (%)
Residents speaking Spanish at home - Native, born elsewhere (%)
Residents speaking Spanish at home - Foreign born (%)
Residents speaking other language at home (%)
Residents speaking other language at home - Born in the United States (%)
Residents speaking other language at home - Native, born elsewhere (%)
Residents speaking other language at home - Foreign born (%)
Marital status - Never married (%)
Marital status - Now married (%)
Marital status - Separated (%)
Marital status - Widowed (%)
Marital status - Divorced (%)
Ancestries Reported - Arab (%)
Ancestries Reported - Czech (%)
Ancestries Reported - Danish (%)
Ancestries Reported - Dutch (%)
Ancestries Reported - English (%)
Ancestries Reported - French (%)
Ancestries Reported - French Canadian (%)
Ancestries Reported - German (%)
Ancestries Reported - Greek (%)
Ancestries Reported - Hungarian (%)
Ancestries Reported - Irish (%)
Ancestries Reported - Italian (%)
Ancestries Reported - Lithuanian (%)
Ancestries Reported - Norwegian (%)
Ancestries Reported - Polish (%)
Ancestries Reported - Portuguese (%)
Ancestries Reported - Russian (%)
Ancestries Reported - Scotch-Irish (%)
Ancestries Reported - Scottish (%)
Ancestries Reported - Slovak (%)
Ancestries Reported - Subsaharan African (%)
Ancestries Reported - Swedish (%)
Ancestries Reported - Swiss (%)
Ancestries Reported - Ukrainian (%)
Ancestries Reported - United States (%)
Ancestries Reported - Welsh (%)
Ancestries Reported - West Indian (%)
Ancestries Reported - Other (%)
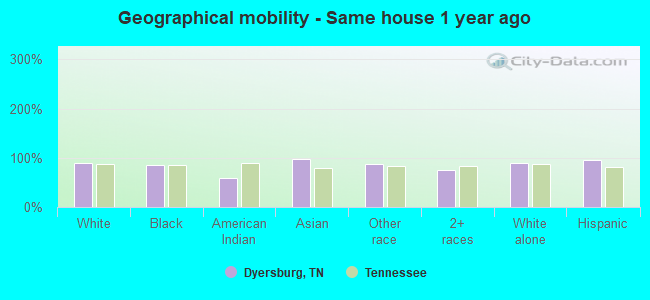
Geographical mobility - Same house 1 year ago (%)
Geographical mobility - Same house 1 year ago (%) - White
Geographical mobility - Same house 1 year ago (%) - Black or African American
Geographical mobility - Same house 1 year ago (%) - Asian
Geographical mobility - Same house 1 year ago (%) - Hispanic or Latino
Geographical mobility - Same house 1 year ago (%) - American Indian and Alaska Native
Geographical mobility - Same house 1 year ago (%) - Multirace
Geographical mobility - Same house 1 year ago (%) - Other Race
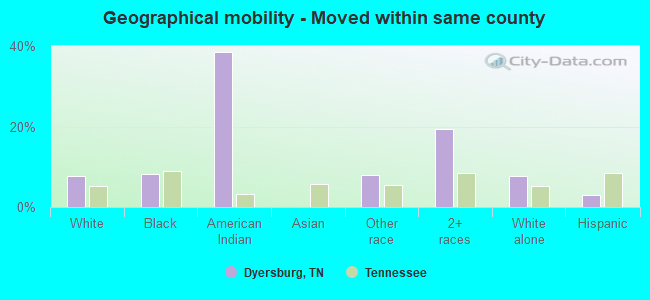
Geographical mobility - Moved within same county (%)
Geographical mobility - Moved within same county (%) - White
Geographical mobility - Moved within same county (%) - Black or African American
Geographical mobility - Moved within same county (%) - Asian
Geographical mobility - Moved within same county (%) - Hispanic or Latino
Geographical mobility - Moved within same county (%) - American Indian and Alaska Native
Geographical mobility - Moved within same county (%) - Multirace
Geographical mobility - Moved within same county (%) - Other Race
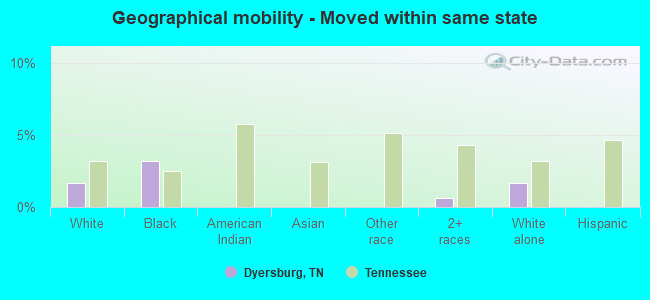
Geographical mobility - Moved from different county within same state (%)
Geographical mobility - Moved from different county within same state (%) - White
Geographical mobility - Moved from different county within same state (%) - Black or African American
Geographical mobility - Moved from different county within same state (%) - Asian
Geographical mobility - Moved from different county within same state (%) - Hispanic or Latino
Geographical mobility - Moved from different county within same state (%) - American Indian and Alaska Native
Geographical mobility - Moved from different county within same state (%) - Multirace
Geographical mobility - Moved from different county within same state (%) - Other Race
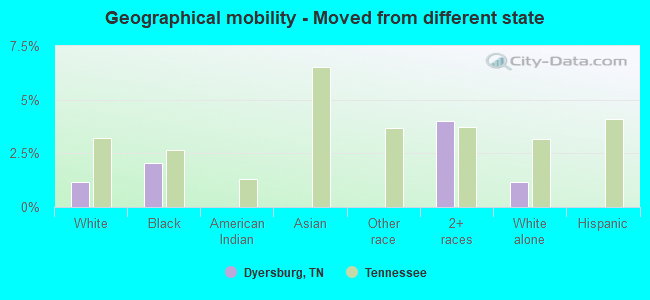
Geographical mobility - Moved from different state (%)
Geographical mobility - Moved from different state (%) - White
Geographical mobility - Moved from different state (%) - Black or African American
Geographical mobility - Moved from different state (%) - Asian
Geographical mobility - Moved from different state (%) - Hispanic or Latino
Geographical mobility - Moved from different state (%) - American Indian and Alaska Native
Geographical mobility - Moved from different state (%) - Multirace
Geographical mobility - Moved from different state (%) - Other Race
Geographical mobility - Moved from abroad (%)
Geographical mobility - Moved from abroad (%) - White
Geographical mobility - Moved from abroad (%) - Black or African American
Geographical mobility - Moved from abroad (%) - Asian
Geographical mobility - Moved from abroad (%) - Hispanic or Latino
Geographical mobility - Moved from abroad (%) - American Indian and Alaska Native
Geographical mobility - Moved from abroad (%) - Multirace
Geographical mobility - Moved from abroad (%) - Other Race
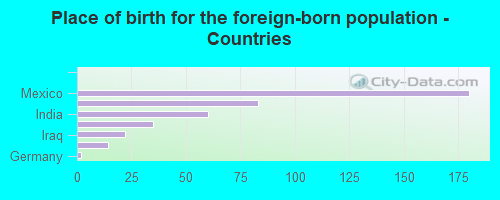
Place of birth for the foreign-born population - Ireland (%)
Place of birth for the foreign-born population - Denmark (%)
Place of birth for the foreign-born population - Norway (%)
Place of birth for the foreign-born population - Sweden (%)
Place of birth for the foreign-born population - United Kingdom (%)
Place of birth for the foreign-born population - England (%)
Place of birth for the foreign-born population - Scotland (%)
Place of birth for the foreign-born population - Other Northern Europe (%)
Place of birth for the foreign-born population - Austria (%)
Place of birth for the foreign-born population - Belgium (%)
Place of birth for the foreign-born population - France (%)
Place of birth for the foreign-born population - Germany (%)
Place of birth for the foreign-born population - Netherlands (%)
Place of birth for the foreign-born population - Switzerland (%)
Place of birth for the foreign-born population - Other Western Europe (%)
Place of birth for the foreign-born population - Greece (%)
Place of birth for the foreign-born population - Italy (%)
Place of birth for the foreign-born population - Portugal (%)
Place of birth for the foreign-born population - Spain (%)
Place of birth for the foreign-born population - Other Southern Europe (%)
Place of birth for the foreign-born population - Albania (%)
Place of birth for the foreign-born population - Belarus (%)
Place of birth for the foreign-born population - Bosnia and Herzegovina (%)
Place of birth for the foreign-born population - Bulgaria (%)
Place of birth for the foreign-born population - Croatia (%)
Place of birth for the foreign-born population - Czechoslovakia (%)
Place of birth for the foreign-born population - Hungary (%)
Place of birth for the foreign-born population - Latvia (%)
Place of birth for the foreign-born population - Lithuania (%)
Place of birth for the foreign-born population - North Macedonia (Macedonia) (%)
Place of birth for the foreign-born population - Moldova (%)
Place of birth for the foreign-born population - Poland (%)
Place of birth for the foreign-born population - Romania (%)
Place of birth for the foreign-born population - Russia (%)
Place of birth for the foreign-born population - Serbia (%)
Place of birth for the foreign-born population - Ukraine (%)
Place of birth for the foreign-born population - Other Eastern Europe (%)
Place of birth for the foreign-born population - China (%)
Place of birth for the foreign-born population - Hong Kong (%)
Place of birth for the foreign-born population - Taiwan (%)
Place of birth for the foreign-born population - Japan (%)
Place of birth for the foreign-born population - Korea (%)
Place of birth for the foreign-born population - Other Eastern Asia (%)
Place of birth for the foreign-born population - Afghanistan (%)
Place of birth for the foreign-born population - Bangladesh (%)
Place of birth for the foreign-born population - India (%)
Place of birth for the foreign-born population - Iran (%)
Place of birth for the foreign-born population - Kazakhstan (%)
Place of birth for the foreign-born population - Nepal (%)
Place of birth for the foreign-born population - Pakistan (%)
Place of birth for the foreign-born population - Sri Lanka (%)
Place of birth for the foreign-born population - Uzbekistan (%)
Place of birth for the foreign-born population - Other South Central Asia (%)
Place of birth for the foreign-born population - Burma (%)
Place of birth for the foreign-born population - Cambodia (%)
Place of birth for the foreign-born population - Indonesia (%)
Place of birth for the foreign-born population - Laos (%)
Place of birth for the foreign-born population - Malaysia (%)
Place of birth for the foreign-born population - Philippines (%)
Place of birth for the foreign-born population - Singapore (%)
Place of birth for the foreign-born population - Thailand (%)
Place of birth for the foreign-born population - Vietnam (%)
Place of birth for the foreign-born population - Other South Eastern Asia (%)
Place of birth for the foreign-born population - Armenia (%)
Place of birth for the foreign-born population - Iraq (%)
Place of birth for the foreign-born population - Israel (%)
Place of birth for the foreign-born population - Jordan (%)
Place of birth for the foreign-born population - Kuwait (%)
Place of birth for the foreign-born population - Lebanon (%)
Place of birth for the foreign-born population - Saudi Arabia (%)
Place of birth for the foreign-born population - Syria (%)
Place of birth for the foreign-born population - Turkey (%)
Place of birth for the foreign-born population - Yemen (%)
Place of birth for the foreign-born population - Other Western Asia (%)
Place of birth for the foreign-born population - Eritrea (%)
Place of birth for the foreign-born population - Ethiopia (%)
Place of birth for the foreign-born population - Kenya (%)
Place of birth for the foreign-born population - Somalia (%)
Place of birth for the foreign-born population - Uganda (%)
Place of birth for the foreign-born population - Zimbabwe (%)
Place of birth for the foreign-born population - Other Eastern Africa (%)
Place of birth for the foreign-born population - Cameroon (%)
Place of birth for the foreign-born population - Congo (%)
Place of birth for the foreign-born population - Democratic Republic of Congo (Zaire) (%)
Place of birth for the foreign-born population - Other Middle Africa (%)
Place of birth for the foreign-born population - Egypt (%)
Place of birth for the foreign-born population - Morocco (%)
Place of birth for the foreign-born population - Sudan (%)
Place of birth for the foreign-born population - Other Northern Africa (%)
Place of birth for the foreign-born population - South Africa (%)
Place of birth for the foreign-born population - Other Southern Africa (%)
Place of birth for the foreign-born population - Cabo Verde (%)
Place of birth for the foreign-born population - Ghana (%)
Place of birth for the foreign-born population - Liberia (%)
Place of birth for the foreign-born population - Nigeria (%)
Place of birth for the foreign-born population - Senegal (%)
Place of birth for the foreign-born population - Sierra Leone (%)
Place of birth for the foreign-born population - Other Western Africa (%)
Place of birth for the foreign-born population - Australia (%)
Place of birth for the foreign-born population - New Zealand (%)
Place of birth for the foreign-born population - Fiji (%)
Place of birth for the foreign-born population - Micronesia (%)
Place of birth for the foreign-born population - Bahamas (%)
Place of birth for the foreign-born population - Barbados (%)
Place of birth for the foreign-born population - Cuba (%)
Place of birth for the foreign-born population - Dominica (%)
Place of birth for the foreign-born population - Dominican Republic (%)
Place of birth for the foreign-born population - Grenada (%)
Place of birth for the foreign-born population - Haiti (%)
Place of birth for the foreign-born population - Jamaica (%)
Place of birth for the foreign-born population - St. Vincent and the Grenadines (%)
Place of birth for the foreign-born population - Trinidad and Tobago (%)
Place of birth for the foreign-born population - West Indies (%)
Place of birth for the foreign-born population - Other Caribbean (%)
Place of birth for the foreign-born population - Belize (%)
Place of birth for the foreign-born population - Costa Rica (%)
Place of birth for the foreign-born population - El Salvador (%)
Place of birth for the foreign-born population - Guatemala (%)
Place of birth for the foreign-born population - Honduras (%)
Place of birth for the foreign-born population - Mexico (%)
Place of birth for the foreign-born population - Nicaragua (%)
Place of birth for the foreign-born population - Panama (%)
Place of birth for the foreign-born population - Other Central America (%)
Place of birth for the foreign-born population - Argentina (%)
Place of birth for the foreign-born population - Bolivia (%)
Place of birth for the foreign-born population - Brazil (%)
Place of birth for the foreign-born population - Chile (%)
Place of birth for the foreign-born population - Colombia (%)
Place of birth for the foreign-born population - Ecuador (%)
Place of birth for the foreign-born population - Guyana (%)
Place of birth for the foreign-born population - Peru (%)
Place of birth for the foreign-born population - Uruguay (%)
Place of birth for the foreign-born population - Venezuela (%)
Place of birth for the foreign-born population - Other South America (%)
Place of birth for the foreign-born population - Canada (%)
Place of birth for the foreign-born population - Other Northern America (%)
Place of birth for the foreign-born population - Other (%)
Latest news about races in Dyersburg, TN collected exclusively by city-data.com from local newspapers, TV, and radio stations
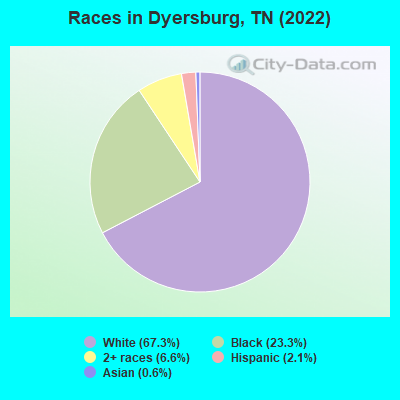
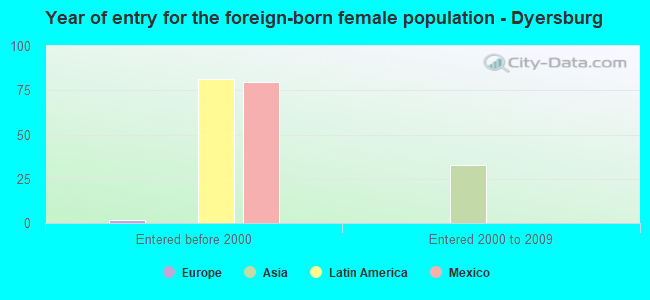
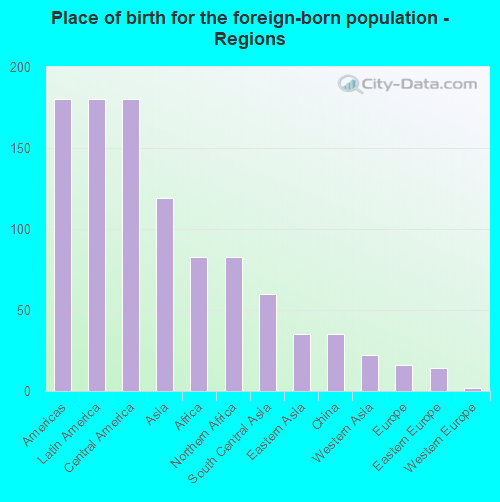
According to 2022 data, the most numerous races in Dyersburg, TN are White alone (11,082 residents), Black alone (3,841 residents), and Hispanic (349 residents). 96.2% of Dyersburg residents speak English at home. 2.4% of Dyersburg, TN residents are foreign-born (1.1% born in Latin America, 0.7% born in Asia, 0.5% born in Africa), which is 105.8% less than the foreign-born rate of 5.0% across the entire state of Tennessee.
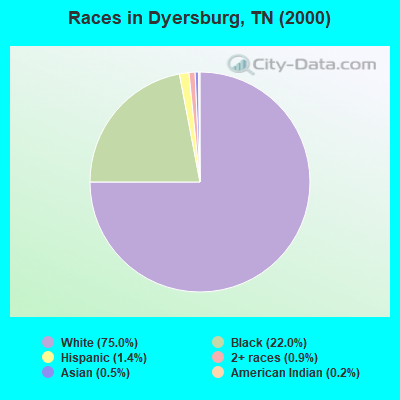
Race distribution in Dyersburg
2000 2022
4,505,930 79.2% White alone 928,204 16.3% Black alone 123,838 2.2% Hispanic 54,824 1.0% Two or more races 56,077 1.0% Asian alone 13,820 0.2% American Indian alone 4,780 0.08% Other race alone 1,810 0.03% Native Hawaiian and Other
5,070,026 71.9% White alone 1,089,738 15.5% Black alone 442,629 6.3% Hispanic 279,381 4.0% Two or more races 131,817 1.9% Asian alone 26,972 0.4% Other race alone 6,387 0.09% American Indian alone 4,389 0.06% Native Hawaiian and Other
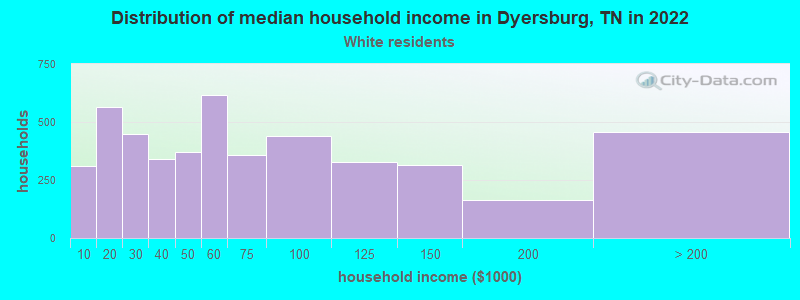
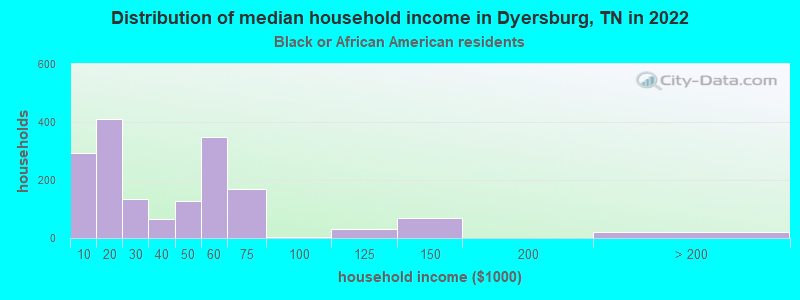
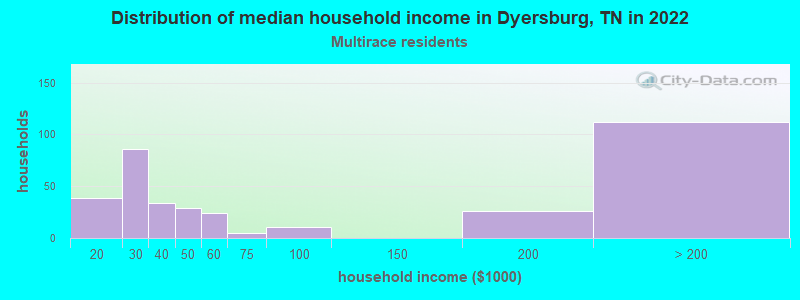
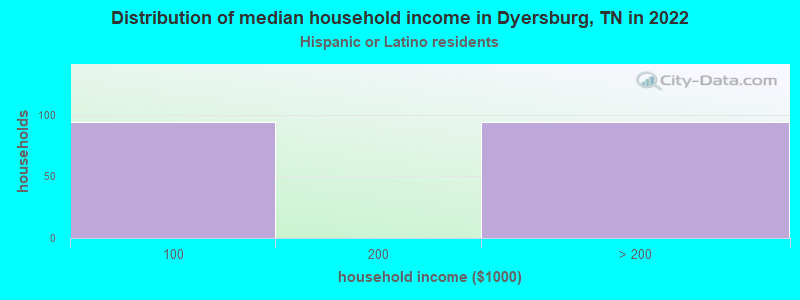
Income and house value in Dyersburg Median household income in 2022 $54,622 White non-Hispanic householders$26,180 Black householdersMedian 2022 house value $227,490 White Non-Hispanic householders$148,449 Black or African American householders $240,805 Asian householders$195,194 Two or more races householders$299,165 Hispanic or Latino householders
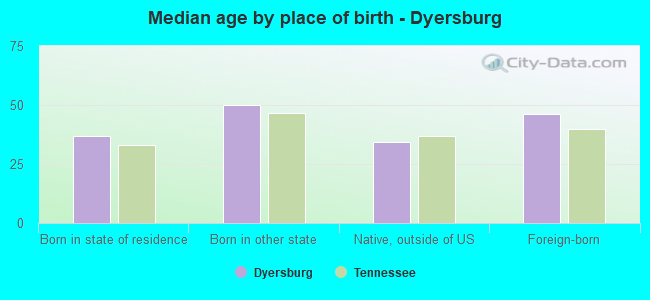
Median age by race in Dyersburg
46.2 Median age for White residents42.7 50.1 35.8 Median age for Black or African American residents30.4 40.3 34.0 Median age for American Indian / Alaska Native residents-633,911,367.4 -801,477,376.9 -685,288,639.9 Median age for Asian residents-662,846,226.7 -686,648,500.7 -885,813,147.9 Median age for Native Hawaiian / Pacific Islander residents-951,707,890.7 -735,930,735.2 48.0 Median age for Other race residents45.4 -745,428,972.5 19.8 Median age for Two or more races residents21.7 17.8 45.6 Median age for White alone residents42.4 49.9 49.5 Median age for Hispanic or Latino residents46.7 50.6
Owner/renter occupied households by race in Dyersburg
House owners and renters - White residents 2,744 58.3% Owner occupied1,966 41.7% Renter occupiedHouse owners and renters - Black or African American residents 544 31.2% Owner occupied1,202 68.8% Renter occupiedHouse owners and renters - American Indian / Alaska Native residents 6 100.0% Renter occupiedHouse owners and renters - Other race residents 84 100.0% Renter occupiedHouse owners and renters - Two or more races residents 263 70.6% Owner occupied109 29.4% Renter occupiedHouse owners and renters - White alone residents 2,757 57.8% Owner occupied2,013 42.2% Renter occupiedHouse owners and renters - Hispanic or Latino residents 102 54.7% Owner occupied84 45.3% Renter occupied
Language usage in Dyersburg
English speakers - Total 96.2% of residents of Dyersburg speak English at home.
1.8% of residents speak Spanish at home 192 69.3% Speak English very well85 30.7% Speak English less than very well1.9% of residents speak other language at home 281 97.6% Speak English very well7 2.4% Speak English less than very well
English speakers - Born in the United States 95.8% of residents of Dyersburg speak English at home.
2.4% of residents speak Spanish at home 96 100.0% Speak English very well1.8% of residents speak other language at home 74 100.0% Speak English very well
English speakers - Native, born elsewhere 99.0% of residents of Dyersburg speak English at home.
English speakers - Foreign-born 4.0% of residents of Dyersburg speak English at home.
44.4% of residents speak Spanish at home 93 52.5% Speak English very well84 47.5% Speak English less than very well52.1% of residents speak other language at home 208 100.0% Speak English very well
White (Caucasian) - Speak only English Native:
98.8% (10,450)Foreign-born:
14.9% (13)
White (Caucasian) - Speak another language Native:
1.3% (134)Foreign-born:
79.6% (68)
Two or more races - Speak only English Native:
97.5% (994)Foreign-born:
2.2% (4)
Two or more races - Speak another language Native:
0.9% (10)Foreign-born:
97.6% (165)
White alone - Speak only English Native:
99.0% (10,432)Foreign-born:
11.7% (14)
White alone - Speak another language Native:
0.9% (97)Foreign-born:
90.1% (106)
Hispanic or Latino - Speak another language Native:
52.7% (76)Foreign-born:
100.0% (185)
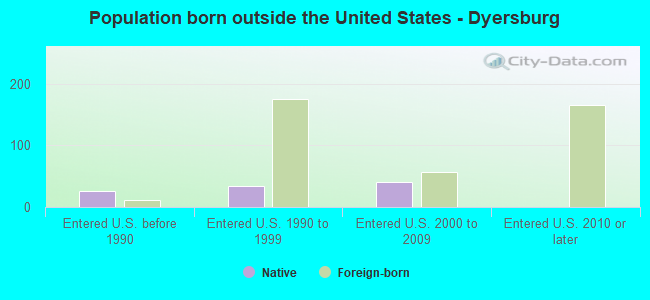
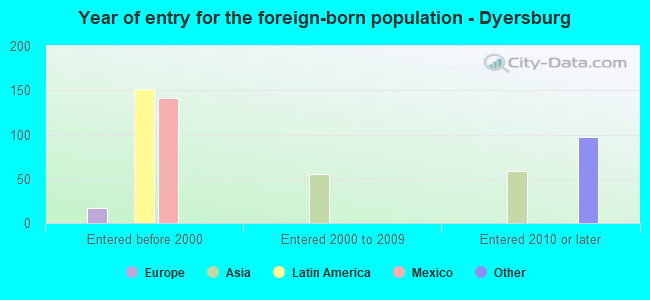
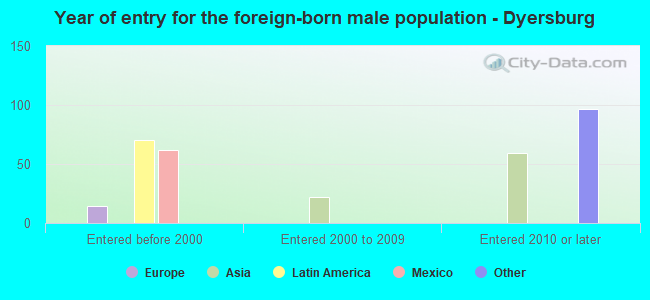
Foreign-born residents in Dyersburg 400 residents are foreign born (1.1% Latin America , 0.7% Asia , 0.5% Africa ).
This city:
2.4%Tennessee:
5.4%
Marital status for residents in Dyersburg Marital status - White (Caucasian) population 15 years and over
Males 27.6% Never married50.1% Now married5.1% Separated4.0% Widowed13.2% DivorcedFemales 17.4% Never married44.3% Now married3.6% Separated17.1% Widowed17.6% DivorcedWomen who gave birth in the past 12 months Now married:
72.3% (147)Unmarried:
27.7% (56)
Women who did not give birth in the past 12 months Now married:
40.1% (826)Unmarried:
59.9% (1,231)
Marital status - Black or African American population 15 years and over
Males 44.8% Never married18.8% Now married3.9% Separated10.0% Widowed22.5% DivorcedFemales 52.6% Never married14.1% Now married8.6% Separated4.4% Widowed20.3% DivorcedWomen who did not give birth in the past 12 months Now married:
20.6% (218)Unmarried:
79.4% (839)
Marital status - American Indian / Alaska Native population 15 years and over
Males 64.3% Never married35.7% Now married0.0% Separated0.0% Widowed0.0% DivorcedFemales 100.0% Never married0.0% Now married0.0% Separated0.0% Widowed0.0% DivorcedWomen who did not give birth in the past 12 months Now married:
0.0% (0)Unmarried:
100.0% (7)
Marital status - Asian population 15 years and over
Males 100.0% Never married0.0% Now married0.0% Separated0.0% Widowed0.0% DivorcedFemales 0.0% Never married100.0% Now married0.0% Separated0.0% Widowed0.0% DivorcedMarital status - Two or more races population 15 years and over
Males 77.4% Never married10.7% Now married0.0% Separated5.1% Widowed6.8% DivorcedFemales 38.9% Never married34.5% Now married0.0% Separated8.5% Widowed18.2% DivorcedWomen who did not give birth in the past 12 months Now married:
8.4% (21)Unmarried:
91.6% (228)
Marital status - White alone, not Hispanic / Latino population 15 years and over
Males 27.7% Never married49.9% Now married5.1% Separated4.0% Widowed13.3% DivorcedFemales 17.5% Never married45.1% Now married3.7% Separated17.4% Widowed16.4% DivorcedWomen who gave birth in the past 12 months Now married:
72.3% (150)Unmarried:
27.7% (57)
Women who did not give birth in the past 12 months Now married:
41.9% (839)Unmarried:
58.1% (1,164)
Marital status - Hispanic or Latino population 15 years and over
Males 80.3% Never married19.7% Now married0.0% Separated0.0% Widowed0.0% DivorcedFemales 7.9% Never married50.8% Now married0.0% Separated0.0% Widowed41.2% DivorcedWomen who did not give birth in the past 12 months Now married:
0.0% (0)Unmarried:
100.0% (97)
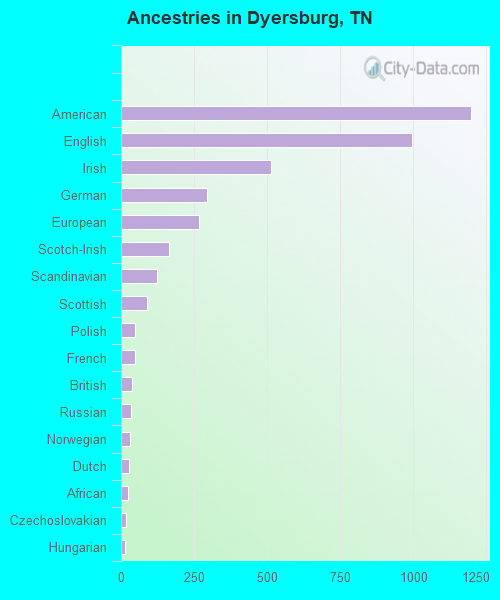
Ancestries in Dyersburg
1,200 14.2% American996 11.8% English514 6.1% Irish293 3.5% German267 3.2% European164 1.9% Scotch-Irish122 1.4% Scandinavian89 1.1% Scottish49 0.6% Polish48 0.6% French38 0.5% British35 0.4% Russian32 0.4% Norwegian28 0.3% Dutch25 0.3% African18 0.2% Czechoslovakian13 0.2% Hungarian
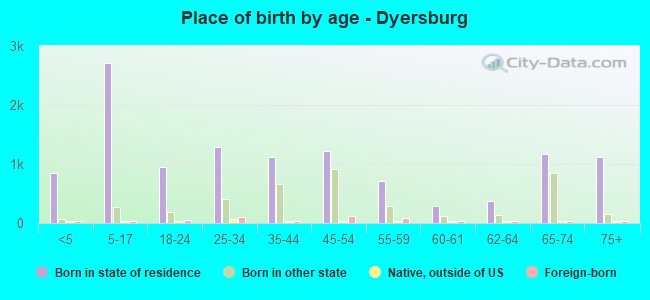
Children Nativity (place of birth) in Dyersburg
Children under 6 years - Living with two parents Both parents native 424 100.0% NativeChildren under 6 years - Living with one parent Native parent 530 100.0% NativeChildren 6 to 17 years - Living with two parents Both parents native 1,117 100.0% NativeChildren 6 to 17 years - Living with one parent Native parent 1,465 100.0% NativeForeign-born parent 2 51.1% Native2 48.9% Foreign-born
Grandparents responsible for own grandchildren in Dyersburg
Grandparents (30 to 59 years) White / Caucasian 302 100.0% Responsible for grandchildrenBlack or African American 15 14.8% Responsible for grandchildren86 85.2% Not responsible for grandchildrenWhite alone, not Hispanic / Latino 282 100.0% Responsible for grandchildrenHispanic or Latino 22 100.0% Responsible for grandchildrenGrandparents (60 years and over) White / Caucasian 81 47.7% Responsible for grandchildren89 52.3% Not responsible for grandchildrenBlack or African American 3 100.0% Responsible for grandchildrenWhite alone, not Hispanic / Latino 82 47.9% Responsible for grandchildren90 52.1% Not responsible for grandchildren