Races in Eagle, Idaho (ID) Detailed Stats
Data:
Races - White alone (%)
Races - White alone (% change since 2000)
Races - Black alone (%)
Races - Black alone (% change since 2000)
Races - American Indian alone (%)
Races - American Indian alone (% change since 2000)
Races - Asian alone (%)
Races - Asian alone (% change since 2000)
Races - Hispanic (%)
Races - Hispanic (% change since 2000)
Races - Native Hawaiian and Other Pacific Islander alone (%)
Races - Native Hawaiian and Other Pacific Islander alone (% change since 2000)
Races - Two or more races(%)
Races - Two or more races(% change since 2000)
Races - Other race alone (%)
Races - Other race alone (% change since 2000)
Racial diversity
Place of birth - Born in state of residence (%)
Place of birth - Born in state of residence (%) - White
Place of birth - Born in state of residence (%) - Black or African American
Place of birth - Born in state of residence (%) - Asian
Place of birth - Born in state of residence (%) - Hispanic or Latino
Place of birth - Born in state of residence (%) - American Indian and Alaska Native
Place of birth - Born in state of residence (%) - Multirace
Place of birth - Born in state of residence (%) - Other Race
Place of birth - Born in other state (%)
Place of birth - Born in other state (%) - White
Place of birth - Born in other state (%) - Black or African American
Place of birth - Born in other state (%) - Asian
Place of birth - Born in other state (%) - Hispanic or Latino
Place of birth - Born in other state (%) - American Indian and Alaska Native
Place of birth - Born in other state (%) - Multirace
Place of birth - Born in other state (%) - Other Race
Place of birth - Native, outside of US (%)
Place of birth - Native, outside of US (%) - White
Place of birth - Native, outside of US (%) - Black or African American
Place of birth - Native, outside of US (%) - Asian
Place of birth - Native, outside of US (%) - Hispanic or Latino
Place of birth - Native, outside of US (%) - American Indian and Alaska Native
Place of birth - Native, outside of US (%) - Multirace
Place of birth - Native, outside of US (%) - Other Race
Place of birth - Foreign born (%)
Place of birth - Foreign born (%) - White
Place of birth - Foreign born (%) - Black or African American
Place of birth - Foreign born (%) - Asian
Place of birth - Foreign born (%) - Hispanic or Latino
Place of birth - Foreign born (%) - American Indian and Alaska Native
Place of birth - Foreign born (%) - Multirace
Place of birth - Foreign born (%) - Other Race
Residents speaking English at home (%)
Residents speaking English at home - Born in the United States (%)
Residents speaking English at home - Native, born elsewhere (%)
Residents speaking English at home - Foreign born (%)
Residents speaking Spanish at home (%)
Residents speaking Spanish at home - Born in the United States (%)
Residents speaking Spanish at home - Native, born elsewhere (%)
Residents speaking Spanish at home - Foreign born (%)
Residents speaking other language at home (%)
Residents speaking other language at home - Born in the United States (%)
Residents speaking other language at home - Native, born elsewhere (%)
Residents speaking other language at home - Foreign born (%)
Marital status - Never married (%)
Marital status - Now married (%)
Marital status - Separated (%)
Marital status - Widowed (%)
Marital status - Divorced (%)
Ancestries Reported - Arab (%)
Ancestries Reported - Czech (%)
Ancestries Reported - Danish (%)
Ancestries Reported - Dutch (%)
Ancestries Reported - English (%)
Ancestries Reported - French (%)
Ancestries Reported - French Canadian (%)
Ancestries Reported - German (%)
Ancestries Reported - Greek (%)
Ancestries Reported - Hungarian (%)
Ancestries Reported - Irish (%)
Ancestries Reported - Italian (%)
Ancestries Reported - Lithuanian (%)
Ancestries Reported - Norwegian (%)
Ancestries Reported - Polish (%)
Ancestries Reported - Portuguese (%)
Ancestries Reported - Russian (%)
Ancestries Reported - Scotch-Irish (%)
Ancestries Reported - Scottish (%)
Ancestries Reported - Slovak (%)
Ancestries Reported - Subsaharan African (%)
Ancestries Reported - Swedish (%)
Ancestries Reported - Swiss (%)
Ancestries Reported - Ukrainian (%)
Ancestries Reported - United States (%)
Ancestries Reported - Welsh (%)
Ancestries Reported - West Indian (%)
Ancestries Reported - Other (%)
Geographical mobility - Same house 1 year ago (%)
Geographical mobility - Same house 1 year ago (%) - White
Geographical mobility - Same house 1 year ago (%) - Black or African American
Geographical mobility - Same house 1 year ago (%) - Asian
Geographical mobility - Same house 1 year ago (%) - Hispanic or Latino
Geographical mobility - Same house 1 year ago (%) - American Indian and Alaska Native
Geographical mobility - Same house 1 year ago (%) - Multirace
Geographical mobility - Same house 1 year ago (%) - Other Race
Geographical mobility - Moved within same county (%)
Geographical mobility - Moved within same county (%) - White
Geographical mobility - Moved within same county (%) - Black or African American
Geographical mobility - Moved within same county (%) - Asian
Geographical mobility - Moved within same county (%) - Hispanic or Latino
Geographical mobility - Moved within same county (%) - American Indian and Alaska Native
Geographical mobility - Moved within same county (%) - Multirace
Geographical mobility - Moved within same county (%) - Other Race
Geographical mobility - Moved from different county within same state (%)
Geographical mobility - Moved from different county within same state (%) - White
Geographical mobility - Moved from different county within same state (%) - Black or African American
Geographical mobility - Moved from different county within same state (%) - Asian
Geographical mobility - Moved from different county within same state (%) - Hispanic or Latino
Geographical mobility - Moved from different county within same state (%) - American Indian and Alaska Native
Geographical mobility - Moved from different county within same state (%) - Multirace
Geographical mobility - Moved from different county within same state (%) - Other Race
Geographical mobility - Moved from different state (%)
Geographical mobility - Moved from different state (%) - White
Geographical mobility - Moved from different state (%) - Black or African American
Geographical mobility - Moved from different state (%) - Asian
Geographical mobility - Moved from different state (%) - Hispanic or Latino
Geographical mobility - Moved from different state (%) - American Indian and Alaska Native
Geographical mobility - Moved from different state (%) - Multirace
Geographical mobility - Moved from different state (%) - Other Race
Geographical mobility - Moved from abroad (%)
Geographical mobility - Moved from abroad (%) - White
Geographical mobility - Moved from abroad (%) - Black or African American
Geographical mobility - Moved from abroad (%) - Asian
Geographical mobility - Moved from abroad (%) - Hispanic or Latino
Geographical mobility - Moved from abroad (%) - American Indian and Alaska Native
Geographical mobility - Moved from abroad (%) - Multirace
Geographical mobility - Moved from abroad (%) - Other Race
Place of birth for the foreign-born population - Ireland (%)
Place of birth for the foreign-born population - Denmark (%)
Place of birth for the foreign-born population - Norway (%)
Place of birth for the foreign-born population - Sweden (%)
Place of birth for the foreign-born population - United Kingdom (%)
Place of birth for the foreign-born population - England (%)
Place of birth for the foreign-born population - Scotland (%)
Place of birth for the foreign-born population - Other Northern Europe (%)
Place of birth for the foreign-born population - Austria (%)
Place of birth for the foreign-born population - Belgium (%)
Place of birth for the foreign-born population - France (%)
Place of birth for the foreign-born population - Germany (%)
Place of birth for the foreign-born population - Netherlands (%)
Place of birth for the foreign-born population - Switzerland (%)
Place of birth for the foreign-born population - Other Western Europe (%)
Place of birth for the foreign-born population - Greece (%)
Place of birth for the foreign-born population - Italy (%)
Place of birth for the foreign-born population - Portugal (%)
Place of birth for the foreign-born population - Spain (%)
Place of birth for the foreign-born population - Other Southern Europe (%)
Place of birth for the foreign-born population - Albania (%)
Place of birth for the foreign-born population - Belarus (%)
Place of birth for the foreign-born population - Bosnia and Herzegovina (%)
Place of birth for the foreign-born population - Bulgaria (%)
Place of birth for the foreign-born population - Croatia (%)
Place of birth for the foreign-born population - Czechoslovakia (%)
Place of birth for the foreign-born population - Hungary (%)
Place of birth for the foreign-born population - Latvia (%)
Place of birth for the foreign-born population - Lithuania (%)
Place of birth for the foreign-born population - North Macedonia (Macedonia) (%)
Place of birth for the foreign-born population - Moldova (%)
Place of birth for the foreign-born population - Poland (%)
Place of birth for the foreign-born population - Romania (%)
Place of birth for the foreign-born population - Russia (%)
Place of birth for the foreign-born population - Serbia (%)
Place of birth for the foreign-born population - Ukraine (%)
Place of birth for the foreign-born population - Other Eastern Europe (%)
Place of birth for the foreign-born population - China (%)
Place of birth for the foreign-born population - Hong Kong (%)
Place of birth for the foreign-born population - Taiwan (%)
Place of birth for the foreign-born population - Japan (%)
Place of birth for the foreign-born population - Korea (%)
Place of birth for the foreign-born population - Other Eastern Asia (%)
Place of birth for the foreign-born population - Afghanistan (%)
Place of birth for the foreign-born population - Bangladesh (%)
Place of birth for the foreign-born population - India (%)
Place of birth for the foreign-born population - Iran (%)
Place of birth for the foreign-born population - Kazakhstan (%)
Place of birth for the foreign-born population - Nepal (%)
Place of birth for the foreign-born population - Pakistan (%)
Place of birth for the foreign-born population - Sri Lanka (%)
Place of birth for the foreign-born population - Uzbekistan (%)
Place of birth for the foreign-born population - Other South Central Asia (%)
Place of birth for the foreign-born population - Burma (%)
Place of birth for the foreign-born population - Cambodia (%)
Place of birth for the foreign-born population - Indonesia (%)
Place of birth for the foreign-born population - Laos (%)
Place of birth for the foreign-born population - Malaysia (%)
Place of birth for the foreign-born population - Philippines (%)
Place of birth for the foreign-born population - Singapore (%)
Place of birth for the foreign-born population - Thailand (%)
Place of birth for the foreign-born population - Vietnam (%)
Place of birth for the foreign-born population - Other South Eastern Asia (%)
Place of birth for the foreign-born population - Armenia (%)
Place of birth for the foreign-born population - Iraq (%)
Place of birth for the foreign-born population - Israel (%)
Place of birth for the foreign-born population - Jordan (%)
Place of birth for the foreign-born population - Kuwait (%)
Place of birth for the foreign-born population - Lebanon (%)
Place of birth for the foreign-born population - Saudi Arabia (%)
Place of birth for the foreign-born population - Syria (%)
Place of birth for the foreign-born population - Turkey (%)
Place of birth for the foreign-born population - Yemen (%)
Place of birth for the foreign-born population - Other Western Asia (%)
Place of birth for the foreign-born population - Eritrea (%)
Place of birth for the foreign-born population - Ethiopia (%)
Place of birth for the foreign-born population - Kenya (%)
Place of birth for the foreign-born population - Somalia (%)
Place of birth for the foreign-born population - Uganda (%)
Place of birth for the foreign-born population - Zimbabwe (%)
Place of birth for the foreign-born population - Other Eastern Africa (%)
Place of birth for the foreign-born population - Cameroon (%)
Place of birth for the foreign-born population - Congo (%)
Place of birth for the foreign-born population - Democratic Republic of Congo (Zaire) (%)
Place of birth for the foreign-born population - Other Middle Africa (%)
Place of birth for the foreign-born population - Egypt (%)
Place of birth for the foreign-born population - Morocco (%)
Place of birth for the foreign-born population - Sudan (%)
Place of birth for the foreign-born population - Other Northern Africa (%)
Place of birth for the foreign-born population - South Africa (%)
Place of birth for the foreign-born population - Other Southern Africa (%)
Place of birth for the foreign-born population - Cabo Verde (%)
Place of birth for the foreign-born population - Ghana (%)
Place of birth for the foreign-born population - Liberia (%)
Place of birth for the foreign-born population - Nigeria (%)
Place of birth for the foreign-born population - Senegal (%)
Place of birth for the foreign-born population - Sierra Leone (%)
Place of birth for the foreign-born population - Other Western Africa (%)
Place of birth for the foreign-born population - Australia (%)
Place of birth for the foreign-born population - New Zealand (%)
Place of birth for the foreign-born population - Fiji (%)
Place of birth for the foreign-born population - Micronesia (%)
Place of birth for the foreign-born population - Bahamas (%)
Place of birth for the foreign-born population - Barbados (%)
Place of birth for the foreign-born population - Cuba (%)
Place of birth for the foreign-born population - Dominica (%)
Place of birth for the foreign-born population - Dominican Republic (%)
Place of birth for the foreign-born population - Grenada (%)
Place of birth for the foreign-born population - Haiti (%)
Place of birth for the foreign-born population - Jamaica (%)
Place of birth for the foreign-born population - St. Vincent and the Grenadines (%)
Place of birth for the foreign-born population - Trinidad and Tobago (%)
Place of birth for the foreign-born population - West Indies (%)
Place of birth for the foreign-born population - Other Caribbean (%)
Place of birth for the foreign-born population - Belize (%)
Place of birth for the foreign-born population - Costa Rica (%)
Place of birth for the foreign-born population - El Salvador (%)
Place of birth for the foreign-born population - Guatemala (%)
Place of birth for the foreign-born population - Honduras (%)
Place of birth for the foreign-born population - Mexico (%)
Place of birth for the foreign-born population - Nicaragua (%)
Place of birth for the foreign-born population - Panama (%)
Place of birth for the foreign-born population - Other Central America (%)
Place of birth for the foreign-born population - Argentina (%)
Place of birth for the foreign-born population - Bolivia (%)
Place of birth for the foreign-born population - Brazil (%)
Place of birth for the foreign-born population - Chile (%)
Place of birth for the foreign-born population - Colombia (%)
Place of birth for the foreign-born population - Ecuador (%)
Place of birth for the foreign-born population - Guyana (%)
Place of birth for the foreign-born population - Peru (%)
Place of birth for the foreign-born population - Uruguay (%)
Place of birth for the foreign-born population - Venezuela (%)
Place of birth for the foreign-born population - Other South America (%)
Place of birth for the foreign-born population - Canada (%)
Place of birth for the foreign-born population - Other Northern America (%)
Place of birth for the foreign-born population - Other (%)
Latest news about races in Eagle, ID collected exclusively by city-data.com from local newspapers, TV, and radio stations
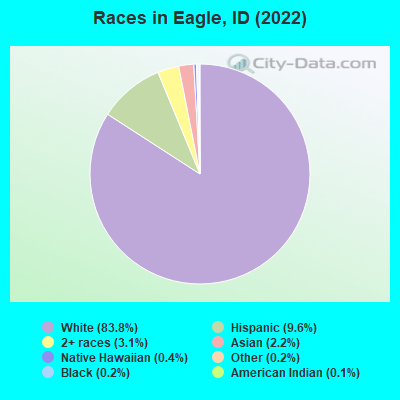
According to 2022 data, the most numerous races in Eagle, ID are White alone (26,772 residents), Hispanic (3,081 residents), and Two or more races (994 residents). 92.5% of Eagle residents speak English at home. 6.1% of Eagle, ID residents are foreign-born (2.8% born in Latin America, 1.6% born in Europe, 1.3% born in Asia), which is 17.8% greater than the foreign-born rate of 5.0% across the entire state of Idaho.
Race distribution in Eagle
2000 2022
1,139,291 88.0% White alone 101,690 7.9% Hispanic 18,261 1.4% Two or more races 15,789 1.2% American Indian alone 11,641 0.9% Asian alone 4,889 0.4% Black alone 1,192 0.09% Other race alone 1,200 0.09% Native Hawaiian and Other
1,531,219 79.0% White alone 261,921 13.5% Hispanic 81,112 4.2% Two or more races 25,174 1.3% Asian alone 15,825 0.8% American Indian alone 11,868 0.6% Black alone 8,752 0.5% Other race alone 3,162 0.2% Native Hawaiian and Other
Income and house value in Eagle Median household income in 2022 $117,953 White non-Hispanic householders$99,639 American Indian and Alaska Native householders$164,938 Asian householders$119,006 Two or more races householdersMedian 2022 house value $873,010 White Non-Hispanic householdersover $1,000,000 Black or African American householders$565,747 American Indian or Alaska Native householders $826,242 Asian householdersover $1,000,000 Some other race householders$718,624 Two or more races householders$807,635 Hispanic or Latino householders
Median age by race in Eagle
50.3 Median age for White residents49.5 50.7 24.0 Median age for Black or African American residents24.1 -848,484,847.6 37.2 Median age for American Indian / Alaska Native residents36.7 47.7 61.1 Median age for Asian residents59.1 57.7 31.4 Median age for Native Hawaiian / Pacific Islander residents-438,794,726.5 66.8 67.6 Median age for Other race residents69.5 70.8 18.8 Median age for Two or more races residents18.8 16.8 50.9 Median age for White alone residents51.1 51.5 30.4 Median age for Hispanic or Latino residents23.0 35.0
Owner/renter occupied households by race in Eagle
House owners and renters - White residents 9,790 87.5% Owner occupied1,403 12.5% Renter occupiedHouse owners and renters - American Indian / Alaska Native residents 84 70.4% Owner occupied35 29.6% Renter occupiedHouse owners and renters - Asian residents 306 97.6% Owner occupied7 2.4% Renter occupiedHouse owners and renters - Native Hawaiian / Pacific Islander residents 11 100.0% Owner occupiedHouse owners and renters - Other race residents 27 40.3% Owner occupied40 59.7% Renter occupiedHouse owners and renters - Two or more races residents 394 83.3% Owner occupied79 16.7% Renter occupiedHouse owners and renters - White alone residents 9,668 87.7% Owner occupied1,356 12.3% Renter occupiedHouse owners and renters - Hispanic or Latino residents 476 76.3% Owner occupied148 23.7% Renter occupied
Language usage in Eagle
English speakers - Total 92.5% of residents of Eagle speak English at home.
3.7% of residents speak Spanish at home 734 65.6% Speak English very well385 34.4% Speak English less than very well3.8% of residents speak other language at home 736 63.4% Speak English very well424 36.6% Speak English less than very well
English speakers - Born in the United States 97.7% of residents of Eagle speak English at home.
1.6% of residents speak Spanish at home 307 96.5% Speak English very well11 3.5% Speak English less than very well0.9% of residents speak other language at home 165 96.5% Speak English very well6 3.5% Speak English less than very well
English speakers - Native, born elsewhere 75.3% of residents of Eagle speak English at home.
6.2% of residents speak Spanish at home 21 100.0% Speak English very well10.7% of residents speak other language at home 36 100.0% Speak English very well
English speakers - Foreign-born 30.3% of residents of Eagle speak English at home.
28.7% of residents speak Spanish at home 222 37.1% Speak English very well377 62.9% Speak English less than very well38.3% of residents speak other language at home 379 47.5% Speak English very well419 52.5% Speak English less than very well
White (Caucasian) - Speak only English Native:
97.3% (24,821)Foreign-born:
44.6% (402)
White (Caucasian) - Speak another language Native:
2.6% (655)Foreign-born:
51.2% (461)
American Indian / Alaska Native - Speak another language Native:
84.9% (87)Foreign-born:
98.9% (416)
Asian - Speak only English Native:
100.0% (236)Foreign-born:
28.5% (126)
Other race - Speak only English Native:
73.8% (103)Foreign-born:
23.8% (57)
Other race - Speak another language Native:
26.1% (36)Foreign-born:
80.5% (192)
Two or more races - Speak only English Native:
98.5% (2,355)Foreign-born:
9.7% (10)
Two or more races - Speak another language Native:
1.1% (26)Foreign-born:
90.3% (91)
White alone - Speak only English Native:
97.5% (24,498)Foreign-born:
37.4% (335)
White alone - Speak another language Native:
2.5% (626)Foreign-born:
60.9% (546)
Hispanic or Latino - Speak only English Native:
89.7% (1,672)Foreign-born:
15.6% (121)
Hispanic or Latino - Speak another language Native:
12.5% (232)Foreign-born:
79.2% (617)
Foreign-born residents in Eagle 1,944 residents are foreign born (2.8% Latin America , 1.6% Europe , 1.3% Asia ).
Marital status for residents in Eagle Marital status - White (Caucasian) population 15 years and over
Males 20.8% Never married71.5% Now married0.0% Separated1.5% Widowed6.2% DivorcedFemales 17.5% Never married64.7% Now married0.0% Separated7.0% Widowed10.7% DivorcedWomen who gave birth in the past 12 months Now married:
71.8% (84)Unmarried:
28.2% (33)
Women who did not give birth in the past 12 months Now married:
52.0% (2,482)Unmarried:
48.0% (2,290)
Marital status - Black or African American population 15 years and over
Males 90.0% Never married0.0% Now married0.0% Separated0.0% Widowed10.0% DivorcedFemales 0.0% Never married100.0% Now married0.0% Separated0.0% Widowed0.0% DivorcedWomen who gave birth in the past 12 months Now married:
100.0% (7)Unmarried:
0.0% (0)
Marital status - American Indian / Alaska Native population 15 years and over
Males 94.9% Never married0.0% Now married0.0% Separated0.0% Widowed5.1% DivorcedFemales 66.3% Never married20.8% Now married0.0% Separated0.0% Widowed12.9% DivorcedWomen who did not give birth in the past 12 months Now married:
11.8% (10)Unmarried:
88.2% (76)
Marital status - Asian population 15 years and over
Males 32.1% Never married56.0% Now married0.0% Separated0.0% Widowed11.9% DivorcedFemales 30.9% Never married43.2% Now married0.0% Separated23.9% Widowed2.1% DivorcedWomen who did not give birth in the past 12 months Now married:
27.8% (58)Unmarried:
72.2% (151)
Marital status - Native Hawaiian / Pacific Islander population 15 years and over
Males 0.0% Never married100.0% Now married0.0% Separated0.0% Widowed0.0% DivorcedFemales 68.0% Never married32.0% Now married0.0% Separated0.0% Widowed0.0% DivorcedWomen who did not give birth in the past 12 months Now married:
0.0% (0)Unmarried:
100.0% (26)
Marital status - Other race population 15 years and over
Males 6.1% Never married93.9% Now married0.0% Separated0.0% Widowed0.0% DivorcedFemales 11.3% Never married30.4% Now married0.0% Separated27.4% Widowed31.0% DivorcedWomen who did not give birth in the past 12 months Now married:
0.0% (0)Unmarried:
100.0% (76)
Marital status - Two or more races population 15 years and over
Males 38.4% Never married38.9% Now married0.0% Separated5.5% Widowed17.3% DivorcedFemales 11.8% Never married87.3% Now married0.0% Separated0.4% Widowed0.5% DivorcedWomen who did not give birth in the past 12 months Now married:
86.2% (489)Unmarried:
13.8% (78)
Marital status - White alone, not Hispanic / Latino population 15 years and over
Males 20.5% Never married72.1% Now married0.0% Separated1.6% Widowed5.8% DivorcedFemales 17.8% Never married64.6% Now married0.0% Separated7.2% Widowed10.4% DivorcedWomen who gave birth in the past 12 months Now married:
71.8% (85)Unmarried:
28.2% (34)
Women who did not give birth in the past 12 months Now married:
51.2% (2,369)Unmarried:
48.8% (2,255)
Marital status - Hispanic or Latino population 15 years and over
Males 51.0% Never married31.5% Now married0.0% Separated3.8% Widowed13.7% DivorcedFemales 11.6% Never married69.4% Now married0.0% Separated5.4% Widowed13.6% DivorcedWomen who did not give birth in the past 12 months Now married:
71.2% (561)Unmarried:
28.8% (226)
Ancestries in Eagle
3,406 25.4% English1,399 10.4% German1,033 7.7% European853 6.4% Irish718 5.4% American435 3.2% Italian386 2.9% Polish345 2.6% Scandinavian324 2.4% Basque250 1.9% Scottish232 1.7% French226 1.7% Swedish216 1.6% Danish207 1.5% Dutch190 1.4% Norwegian128 1.0% Yugoslavian110 0.8% French Canadian76 0.6% Greek67 0.5% Welsh61 0.5% Czech56 0.4% Eastern European52 0.4% Ukrainian47 0.4% Portuguese42 0.3% Scotch-Irish33 0.2% British29 0.2% Russian27 0.2% Swiss25 0.2% Hungarian24 0.2% Northern European24 0.2% Slovak21 0.2% Serbian19 0.1% Canadian19 0.1% Iranian15 0.1% Lithuanian14 0.1% Finnish13 0.10% Belgian13 0.10% Israeli9 0.07% Romanian8 0.06% Croatian7 0.05% Pennsylvania German
Geographical mobility in Eagle Same house 1 year ago 23,063 84.6% White (Caucasian)38 70.9% Black or African American395 80.4% American Indian / Alaska Native599 88.9% Asian69 54.4% Native Hawaiian / Pacific Islander335 82.3% Other race2,456 88.3% Two or more races22,864 85.7% White alone, not Hispanic / Latino2,392 77.8% Hispanic or LatinoMoved within same county 1,267 4.7% White / Caucasian40 5.9% Asian25 19.9% Native Hawaiian / Pacific Islander46 11.3% Other race57 2.1% Two or more races1,153 4.3% White alone, not Hispanic / Latino253 8.2% Hispanic or LatinoMoved within same state 330 1.2% White / Caucasian313 1.2% White alone, not Hispanic / LatinoMoved from different state 2,479 9.1% White / Caucasian24 45.8% Black or African American45 6.7% Asian32 25.0% Native Hawaiian / Pacific Islander227 8.1% Two or more races2,240 8.4% White alone, not Hispanic / Latino305 9.9% Hispanic or LatinoMoved from abroad 171 0.6% White113 22.9% American Indian / Alaska Native173 0.6% White alone, not Hispanic / Latino124 4.0% Hispanic or Latino
Children Nativity (place of birth) in Eagle
Children under 6 years - Living with two parents Both parents native 1,204 100.0% NativeBoth parents foreign-born 9 39.4% Native14 60.6% Foreign-bornChildren under 6 years - Living with one parent Native parent 215 100.0% NativeChildren 6 to 17 years - Living with two parents Both parents native 4,323 99.0% Native44 1.0% Foreign-bornBoth parents foreign-born 214 75.9% Native68 24.1% Foreign-bornOne native, one foreign-born parent 174 100.0% NativeChildren 6 to 17 years - Living with one parent Native parent 631 100.0% NativeForeign-born parent 271 52.4% Native246 47.6% Foreign-born
Grandparents responsible for own grandchildren in Eagle
Grandparents (30 to 59 years) White / Caucasian 12 100.0% Not responsible for grandchildrenAmerican Indian / Alaska Native 20 100.0% Responsible for grandchildrenWhite alone, not Hispanic / Latino 12 100.0% Not responsible for grandchildrenGrandparents (60 years and over) White / Caucasian 24 20.5% Responsible for grandchildren92 79.5% Not responsible for grandchildrenWhite alone, not Hispanic / Latino 22 17.8% Responsible for grandchildren101 82.2% Not responsible for grandchildren