Races in East Brunswick, New Jersey (NJ) Detailed Stats
Ancestries, Foreign-born residents, place of birth

Recent posts about races in East Brunswick, New Jersey on our local forum with over 2,400,000 registered users:
 | Trying to buy a house in Matawan/East Brunswick...anyone selling? (20 replies) |
| Hillsborough, Edison, East Brunswick and South Brunswick - to move? (16 replies) |
| Commute from east brunswick to port authority (7 replies) |
| Best location to buy a house in NJ (20 replies) |
| East Brunswick - most desirable parts? (3 replies) |
| Best town within 25 min East Brunswick (2 replies) |
23.5% of East Brunswick, NJ residents are foreign-born (12.7% born in Asia, 5.9% born in Europe), which is 2.1% greater than the foreign-born rate of 23.0% across the entire state of New Jersey.
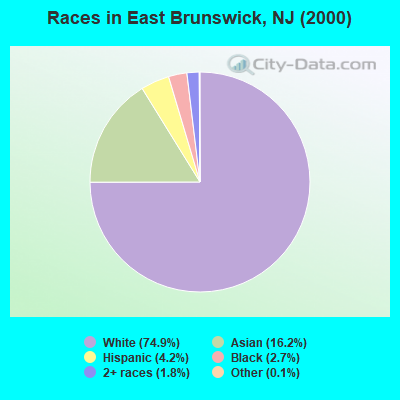
Race distribution in East Brunswick

- 35,00474.9%White alone
- 7,58416.2%Asian alone
- 1,9574.2%Hispanic
- 1,2822.7%Black alone
- 8321.8%Two or more races
- 570.1%Other race alone
- 370.08%American Indian alone
- 30.01%Native Hawaiian and Other
Pacific Islander alone
2000
2022
-
- 5,557,20966.0%White alone
- 1,117,19113.3%Hispanic
- 1,096,17113.0%Black alone
- 477,0125.7%Asian alone
- 133,6891.6%Two or more races
- 19,5650.2%Other race alone
- 11,3380.1%American Indian alone
- 2,1750.03%Native Hawaiian and Other
Pacific Islander alone

-
- 4,766,47651.5%White alone
- 2,028,47021.9%Hispanic
- 1,111,63212.0%Black alone
- 923,54610.0%Asian alone
- 332,2373.6%Two or more races
- 89,8471.0%Other race alone
- 8,5570.09%American Indian alone
- 9340.01%Native Hawaiian and Other
Pacific Islander alone

Income and house value in East Brunswick
- Median household income in 2022
- $121,804White non-Hispanic householders
- $126,346Black householders
- $109,193American Indian and Alaska Native householders
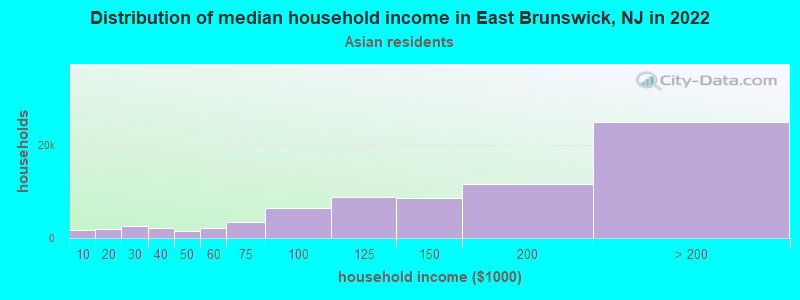
- $161,104Asian householders
- $95,962Some other race householders
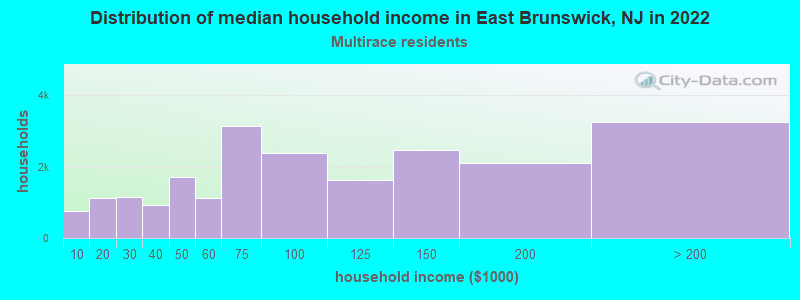
- $87,908Two or more races householders
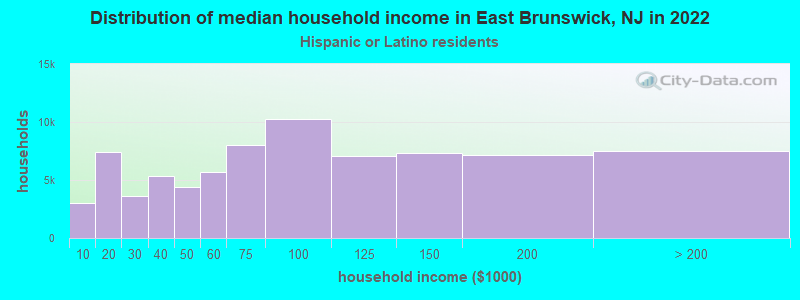
- $107,158Hispanic or Latino race householders
- Median 2022 house value
- $567,128White Non-Hispanic householders
- $573,819Black or African American householders
- $345,790American Indian or Alaska Native householders
- $621,459Asian householders
- $440,000Some other race householders
- $436,253Two or more races householders
- $461,143Hispanic or Latino householders
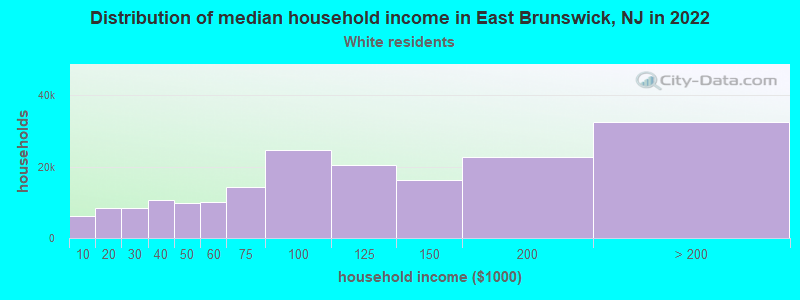
Household income for White non-Hispanic householders
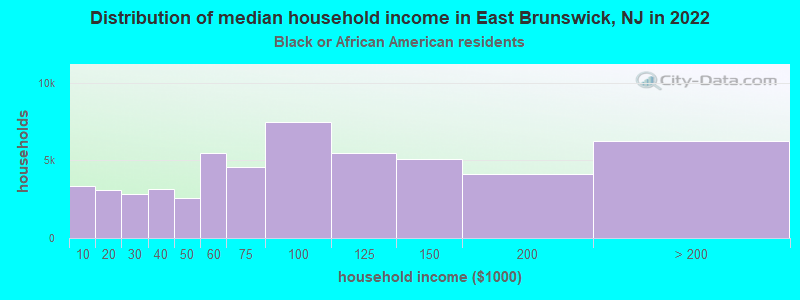
Household income for Black householders
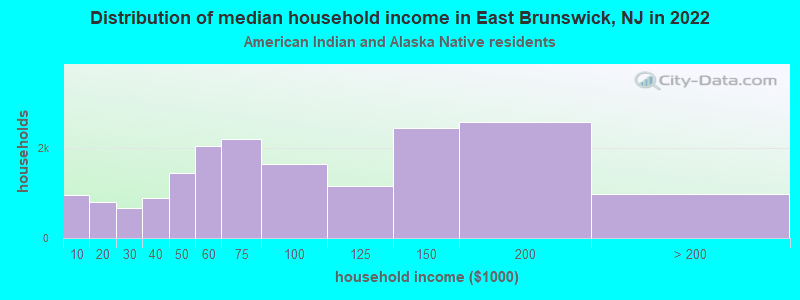
Household income for American Indian and Alaska Native householders
Household income for Asian householders
Household income for Two or more races householders
Household income for Hispanic or Latino race householders
Foreign-born residents in East Brunswick
10,982 residents are foreign born (12.7% Asia, 5.9% Europe).
| This city: | 23.5% |
| New Jersey: | 17.5% |
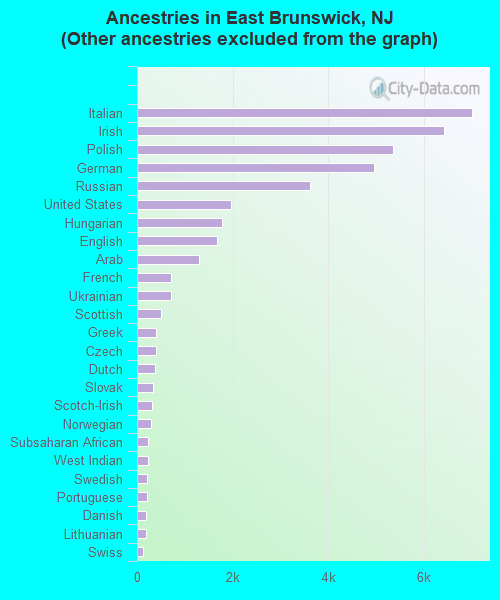
Ancestries in East Brunswick

- 15,50728.0%Other
- 7,02012.7%Italian
- 6,43411.6%Irish
- 5,3699.7%Polish
- 4,9739.0%German
- 3,6276.6%Russian
- 1,9603.5%United States
- 1,7793.2%Hungarian
- 1,6763.0%English
- 1,3072.4%Arab
- 7131.3%French
- 7061.3%Ukrainian
- 5120.9%Scottish
- 4070.7%Greek
- 4010.7%Czech
- 3800.7%Dutch
- 3330.6%Slovak
- 3110.6%Scotch-Irish
- 2860.5%Norwegian
- 2200.4%Subsaharan African
- 2200.4%West Indian
- 2190.4%Swedish
- 2120.4%Portuguese
- 1970.4%Danish
- 1940.4%Lithuanian
- 1280.2%Swiss
- 1220.2%French Canadian
- 830.2%Welsh
Zip codes: 08816.