Races in East Chicago, Indiana (IN) Detailed Stats
Data:
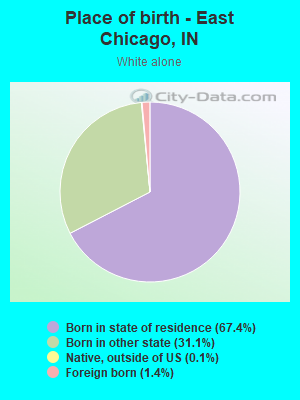
Races - White alone (%)
Races - White alone (% change since 2000)
Races - Black alone (%)
Races - Black alone (% change since 2000)
Races - American Indian alone (%)
Races - American Indian alone (% change since 2000)
Races - Asian alone (%)
Races - Asian alone (% change since 2000)
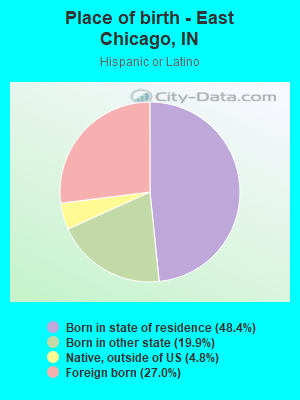
Races - Hispanic (%)
Races - Hispanic (% change since 2000)
Races - Native Hawaiian and Other Pacific Islander alone (%)
Races - Native Hawaiian and Other Pacific Islander alone (% change since 2000)
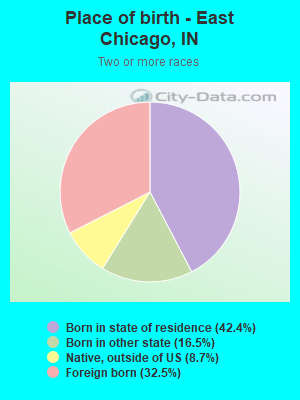
Races - Two or more races(%)
Races - Two or more races(% change since 2000)
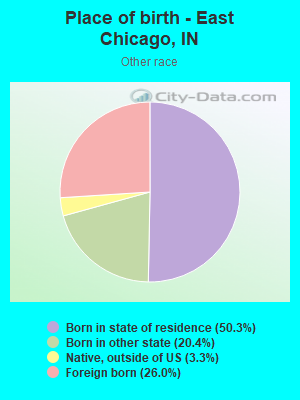
Races - Other race alone (%)
Races - Other race alone (% change since 2000)
Racial diversity
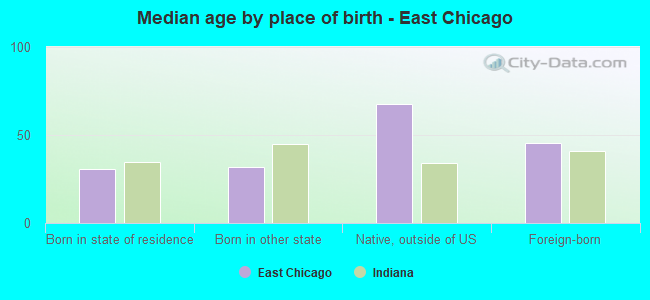
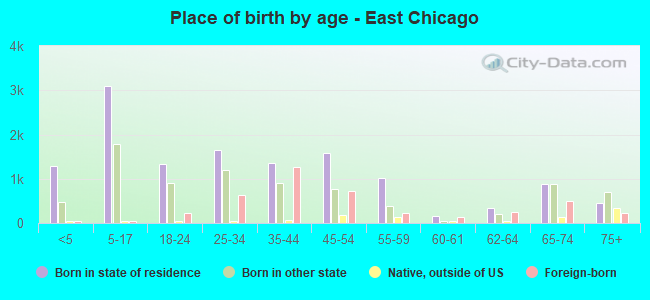
Place of birth - Born in state of residence (%)
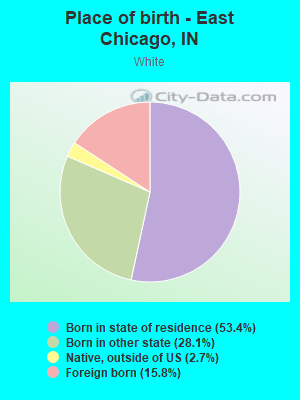
Place of birth - Born in state of residence (%) - White
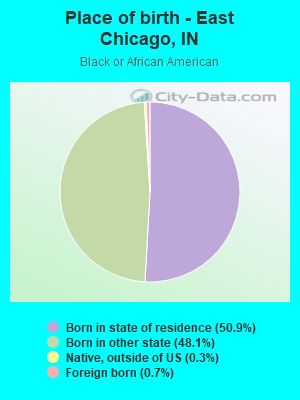
Place of birth - Born in state of residence (%) - Black or African American
Place of birth - Born in state of residence (%) - Asian
Place of birth - Born in state of residence (%) - Hispanic or Latino
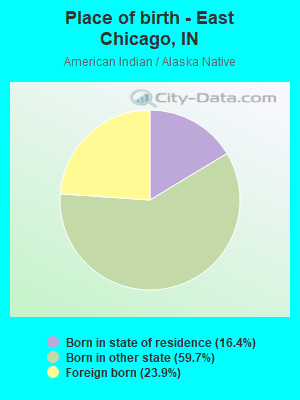
Place of birth - Born in state of residence (%) - American Indian and Alaska Native
Place of birth - Born in state of residence (%) - Multirace
Place of birth - Born in state of residence (%) - Other Race
Place of birth - Born in other state (%)
Place of birth - Born in other state (%) - White
Place of birth - Born in other state (%) - Black or African American
Place of birth - Born in other state (%) - Asian
Place of birth - Born in other state (%) - Hispanic or Latino
Place of birth - Born in other state (%) - American Indian and Alaska Native
Place of birth - Born in other state (%) - Multirace
Place of birth - Born in other state (%) - Other Race
Place of birth - Native, outside of US (%)
Place of birth - Native, outside of US (%) - White
Place of birth - Native, outside of US (%) - Black or African American
Place of birth - Native, outside of US (%) - Asian
Place of birth - Native, outside of US (%) - Hispanic or Latino
Place of birth - Native, outside of US (%) - American Indian and Alaska Native
Place of birth - Native, outside of US (%) - Multirace
Place of birth - Native, outside of US (%) - Other Race
Place of birth - Foreign born (%)
Place of birth - Foreign born (%) - White
Place of birth - Foreign born (%) - Black or African American
Place of birth - Foreign born (%) - Asian
Place of birth - Foreign born (%) - Hispanic or Latino
Place of birth - Foreign born (%) - American Indian and Alaska Native
Place of birth - Foreign born (%) - Multirace
Place of birth - Foreign born (%) - Other Race
Residents speaking English at home (%)
Residents speaking English at home - Born in the United States (%)
Residents speaking English at home - Native, born elsewhere (%)
Residents speaking English at home - Foreign born (%)
Residents speaking Spanish at home (%)
Residents speaking Spanish at home - Born in the United States (%)
Residents speaking Spanish at home - Native, born elsewhere (%)
Residents speaking Spanish at home - Foreign born (%)
Residents speaking other language at home (%)
Residents speaking other language at home - Born in the United States (%)
Residents speaking other language at home - Native, born elsewhere (%)
Residents speaking other language at home - Foreign born (%)
Marital status - Never married (%)
Marital status - Now married (%)
Marital status - Separated (%)
Marital status - Widowed (%)
Marital status - Divorced (%)
Ancestries Reported - Arab (%)
Ancestries Reported - Czech (%)
Ancestries Reported - Danish (%)
Ancestries Reported - Dutch (%)
Ancestries Reported - English (%)
Ancestries Reported - French (%)
Ancestries Reported - French Canadian (%)
Ancestries Reported - German (%)
Ancestries Reported - Greek (%)
Ancestries Reported - Hungarian (%)
Ancestries Reported - Irish (%)
Ancestries Reported - Italian (%)
Ancestries Reported - Lithuanian (%)
Ancestries Reported - Norwegian (%)
Ancestries Reported - Polish (%)
Ancestries Reported - Portuguese (%)
Ancestries Reported - Russian (%)
Ancestries Reported - Scotch-Irish (%)
Ancestries Reported - Scottish (%)
Ancestries Reported - Slovak (%)
Ancestries Reported - Subsaharan African (%)
Ancestries Reported - Swedish (%)
Ancestries Reported - Swiss (%)
Ancestries Reported - Ukrainian (%)
Ancestries Reported - United States (%)
Ancestries Reported - Welsh (%)
Ancestries Reported - West Indian (%)
Ancestries Reported - Other (%)
Geographical mobility - Same house 1 year ago (%)
Geographical mobility - Same house 1 year ago (%) - White
Geographical mobility - Same house 1 year ago (%) - Black or African American
Geographical mobility - Same house 1 year ago (%) - Asian
Geographical mobility - Same house 1 year ago (%) - Hispanic or Latino
Geographical mobility - Same house 1 year ago (%) - American Indian and Alaska Native
Geographical mobility - Same house 1 year ago (%) - Multirace
Geographical mobility - Same house 1 year ago (%) - Other Race
Geographical mobility - Moved within same county (%)
Geographical mobility - Moved within same county (%) - White
Geographical mobility - Moved within same county (%) - Black or African American
Geographical mobility - Moved within same county (%) - Asian
Geographical mobility - Moved within same county (%) - Hispanic or Latino
Geographical mobility - Moved within same county (%) - American Indian and Alaska Native
Geographical mobility - Moved within same county (%) - Multirace
Geographical mobility - Moved within same county (%) - Other Race
Geographical mobility - Moved from different county within same state (%)
Geographical mobility - Moved from different county within same state (%) - White
Geographical mobility - Moved from different county within same state (%) - Black or African American
Geographical mobility - Moved from different county within same state (%) - Asian
Geographical mobility - Moved from different county within same state (%) - Hispanic or Latino
Geographical mobility - Moved from different county within same state (%) - American Indian and Alaska Native
Geographical mobility - Moved from different county within same state (%) - Multirace
Geographical mobility - Moved from different county within same state (%) - Other Race
Geographical mobility - Moved from different state (%)
Geographical mobility - Moved from different state (%) - White
Geographical mobility - Moved from different state (%) - Black or African American
Geographical mobility - Moved from different state (%) - Asian
Geographical mobility - Moved from different state (%) - Hispanic or Latino
Geographical mobility - Moved from different state (%) - American Indian and Alaska Native
Geographical mobility - Moved from different state (%) - Multirace
Geographical mobility - Moved from different state (%) - Other Race
Geographical mobility - Moved from abroad (%)
Geographical mobility - Moved from abroad (%) - White
Geographical mobility - Moved from abroad (%) - Black or African American
Geographical mobility - Moved from abroad (%) - Asian
Geographical mobility - Moved from abroad (%) - Hispanic or Latino
Geographical mobility - Moved from abroad (%) - American Indian and Alaska Native
Geographical mobility - Moved from abroad (%) - Multirace
Geographical mobility - Moved from abroad (%) - Other Race
Place of birth for the foreign-born population - Ireland (%)
Place of birth for the foreign-born population - Denmark (%)
Place of birth for the foreign-born population - Norway (%)
Place of birth for the foreign-born population - Sweden (%)
Place of birth for the foreign-born population - United Kingdom (%)
Place of birth for the foreign-born population - England (%)
Place of birth for the foreign-born population - Scotland (%)
Place of birth for the foreign-born population - Other Northern Europe (%)
Place of birth for the foreign-born population - Austria (%)
Place of birth for the foreign-born population - Belgium (%)
Place of birth for the foreign-born population - France (%)
Place of birth for the foreign-born population - Germany (%)
Place of birth for the foreign-born population - Netherlands (%)
Place of birth for the foreign-born population - Switzerland (%)
Place of birth for the foreign-born population - Other Western Europe (%)
Place of birth for the foreign-born population - Greece (%)
Place of birth for the foreign-born population - Italy (%)
Place of birth for the foreign-born population - Portugal (%)
Place of birth for the foreign-born population - Spain (%)
Place of birth for the foreign-born population - Other Southern Europe (%)
Place of birth for the foreign-born population - Albania (%)
Place of birth for the foreign-born population - Belarus (%)
Place of birth for the foreign-born population - Bosnia and Herzegovina (%)
Place of birth for the foreign-born population - Bulgaria (%)
Place of birth for the foreign-born population - Croatia (%)
Place of birth for the foreign-born population - Czechoslovakia (%)
Place of birth for the foreign-born population - Hungary (%)
Place of birth for the foreign-born population - Latvia (%)
Place of birth for the foreign-born population - Lithuania (%)
Place of birth for the foreign-born population - North Macedonia (Macedonia) (%)
Place of birth for the foreign-born population - Moldova (%)
Place of birth for the foreign-born population - Poland (%)
Place of birth for the foreign-born population - Romania (%)
Place of birth for the foreign-born population - Russia (%)
Place of birth for the foreign-born population - Serbia (%)
Place of birth for the foreign-born population - Ukraine (%)
Place of birth for the foreign-born population - Other Eastern Europe (%)
Place of birth for the foreign-born population - China (%)
Place of birth for the foreign-born population - Hong Kong (%)
Place of birth for the foreign-born population - Taiwan (%)
Place of birth for the foreign-born population - Japan (%)
Place of birth for the foreign-born population - Korea (%)
Place of birth for the foreign-born population - Other Eastern Asia (%)
Place of birth for the foreign-born population - Afghanistan (%)
Place of birth for the foreign-born population - Bangladesh (%)
Place of birth for the foreign-born population - India (%)
Place of birth for the foreign-born population - Iran (%)
Place of birth for the foreign-born population - Kazakhstan (%)
Place of birth for the foreign-born population - Nepal (%)
Place of birth for the foreign-born population - Pakistan (%)
Place of birth for the foreign-born population - Sri Lanka (%)
Place of birth for the foreign-born population - Uzbekistan (%)
Place of birth for the foreign-born population - Other South Central Asia (%)
Place of birth for the foreign-born population - Burma (%)
Place of birth for the foreign-born population - Cambodia (%)
Place of birth for the foreign-born population - Indonesia (%)
Place of birth for the foreign-born population - Laos (%)
Place of birth for the foreign-born population - Malaysia (%)
Place of birth for the foreign-born population - Philippines (%)
Place of birth for the foreign-born population - Singapore (%)
Place of birth for the foreign-born population - Thailand (%)
Place of birth for the foreign-born population - Vietnam (%)
Place of birth for the foreign-born population - Other South Eastern Asia (%)
Place of birth for the foreign-born population - Armenia (%)
Place of birth for the foreign-born population - Iraq (%)
Place of birth for the foreign-born population - Israel (%)
Place of birth for the foreign-born population - Jordan (%)
Place of birth for the foreign-born population - Kuwait (%)
Place of birth for the foreign-born population - Lebanon (%)
Place of birth for the foreign-born population - Saudi Arabia (%)
Place of birth for the foreign-born population - Syria (%)
Place of birth for the foreign-born population - Turkey (%)
Place of birth for the foreign-born population - Yemen (%)
Place of birth for the foreign-born population - Other Western Asia (%)
Place of birth for the foreign-born population - Eritrea (%)
Place of birth for the foreign-born population - Ethiopia (%)
Place of birth for the foreign-born population - Kenya (%)
Place of birth for the foreign-born population - Somalia (%)
Place of birth for the foreign-born population - Uganda (%)
Place of birth for the foreign-born population - Zimbabwe (%)
Place of birth for the foreign-born population - Other Eastern Africa (%)
Place of birth for the foreign-born population - Cameroon (%)
Place of birth for the foreign-born population - Congo (%)
Place of birth for the foreign-born population - Democratic Republic of Congo (Zaire) (%)
Place of birth for the foreign-born population - Other Middle Africa (%)
Place of birth for the foreign-born population - Egypt (%)
Place of birth for the foreign-born population - Morocco (%)
Place of birth for the foreign-born population - Sudan (%)
Place of birth for the foreign-born population - Other Northern Africa (%)
Place of birth for the foreign-born population - South Africa (%)
Place of birth for the foreign-born population - Other Southern Africa (%)
Place of birth for the foreign-born population - Cabo Verde (%)
Place of birth for the foreign-born population - Ghana (%)
Place of birth for the foreign-born population - Liberia (%)
Place of birth for the foreign-born population - Nigeria (%)
Place of birth for the foreign-born population - Senegal (%)
Place of birth for the foreign-born population - Sierra Leone (%)
Place of birth for the foreign-born population - Other Western Africa (%)
Place of birth for the foreign-born population - Australia (%)
Place of birth for the foreign-born population - New Zealand (%)
Place of birth for the foreign-born population - Fiji (%)
Place of birth for the foreign-born population - Micronesia (%)
Place of birth for the foreign-born population - Bahamas (%)
Place of birth for the foreign-born population - Barbados (%)
Place of birth for the foreign-born population - Cuba (%)
Place of birth for the foreign-born population - Dominica (%)
Place of birth for the foreign-born population - Dominican Republic (%)
Place of birth for the foreign-born population - Grenada (%)
Place of birth for the foreign-born population - Haiti (%)
Place of birth for the foreign-born population - Jamaica (%)
Place of birth for the foreign-born population - St. Vincent and the Grenadines (%)
Place of birth for the foreign-born population - Trinidad and Tobago (%)
Place of birth for the foreign-born population - West Indies (%)
Place of birth for the foreign-born population - Other Caribbean (%)
Place of birth for the foreign-born population - Belize (%)
Place of birth for the foreign-born population - Costa Rica (%)
Place of birth for the foreign-born population - El Salvador (%)
Place of birth for the foreign-born population - Guatemala (%)
Place of birth for the foreign-born population - Honduras (%)
Place of birth for the foreign-born population - Mexico (%)
Place of birth for the foreign-born population - Nicaragua (%)
Place of birth for the foreign-born population - Panama (%)
Place of birth for the foreign-born population - Other Central America (%)
Place of birth for the foreign-born population - Argentina (%)
Place of birth for the foreign-born population - Bolivia (%)
Place of birth for the foreign-born population - Brazil (%)
Place of birth for the foreign-born population - Chile (%)
Place of birth for the foreign-born population - Colombia (%)
Place of birth for the foreign-born population - Ecuador (%)
Place of birth for the foreign-born population - Guyana (%)
Place of birth for the foreign-born population - Peru (%)
Place of birth for the foreign-born population - Uruguay (%)
Place of birth for the foreign-born population - Venezuela (%)
Place of birth for the foreign-born population - Other South America (%)
Place of birth for the foreign-born population - Canada (%)
Place of birth for the foreign-born population - Other Northern America (%)
Place of birth for the foreign-born population - Other (%)
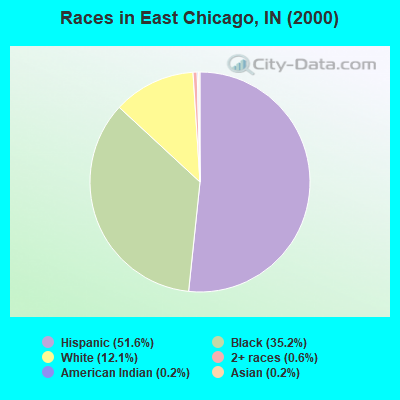
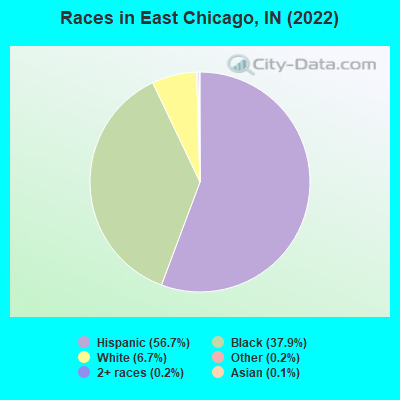
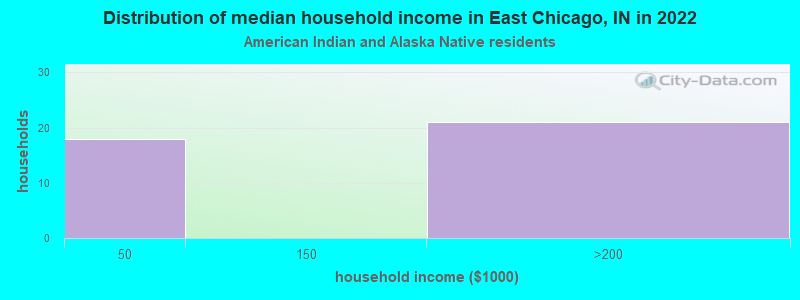
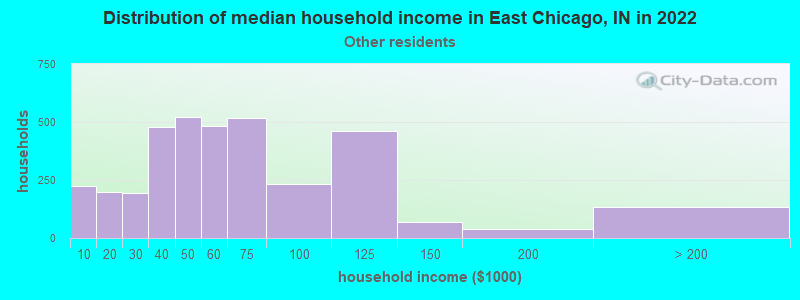
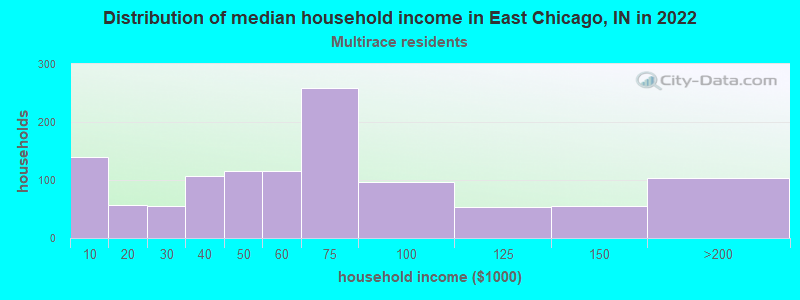
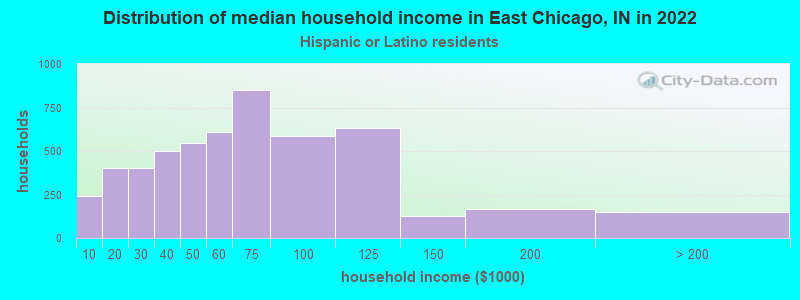
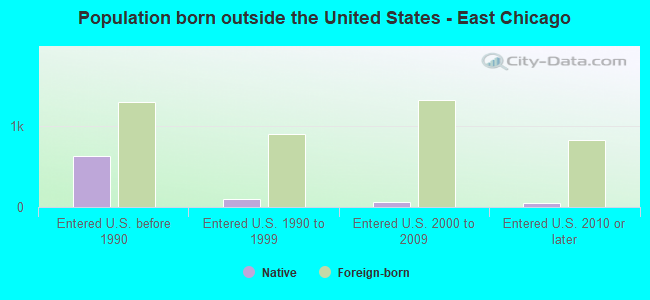
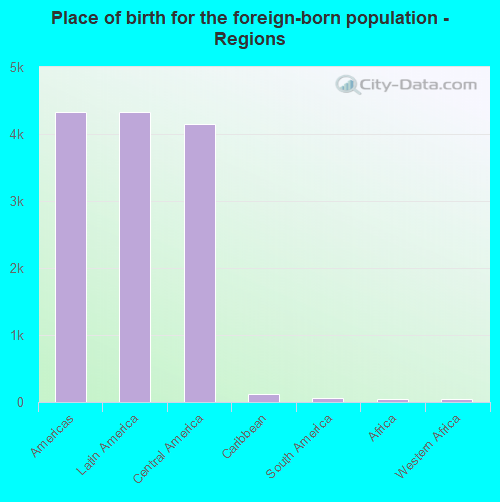
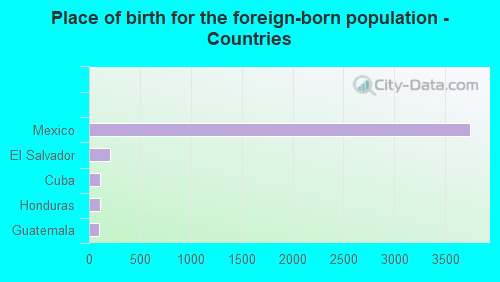
According to 2022 data, the most numerous races in East Chicago, IN are White alone (1,785 residents), Black alone (10,030 residents), and Hispanic (15,007 residents). 61.0% of East Chicago residents speak English at home. 16.8% of East Chicago, IN residents are foreign-born (15.0% born in Latin America), which is 64.2% greater than the foreign-born rate of 6.0% across the entire state of Indiana.
Race distribution in East Chicago
2000 2022
5,219,373 85.8% White alone 505,462 8.3% Black alone 214,536 3.5% Hispanic 61,115 1.0% Two or more races 58,424 1.0% Asian alone 13,654 0.2% American Indian alone 6,348 0.1% Other race alone 1,573 0.03% Native Hawaiian and Other
5,192,455 76.0% White alone 628,054 9.2% Black alone 534,528 7.8% Hispanic 263,242 3.9% Two or more races 172,880 2.5% Asian alone 33,467 0.5% Other race alone 5,866 0.09% American Indian alone 2,545 0.04% Native Hawaiian and Other
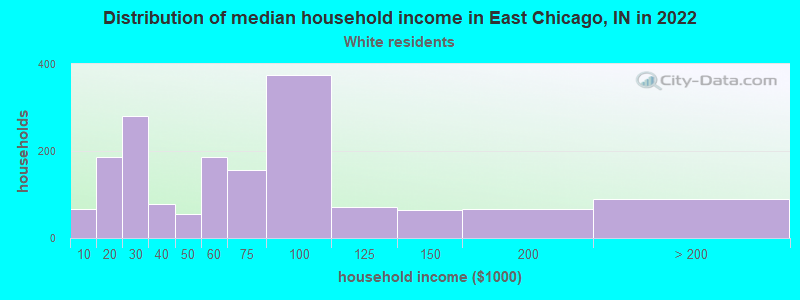
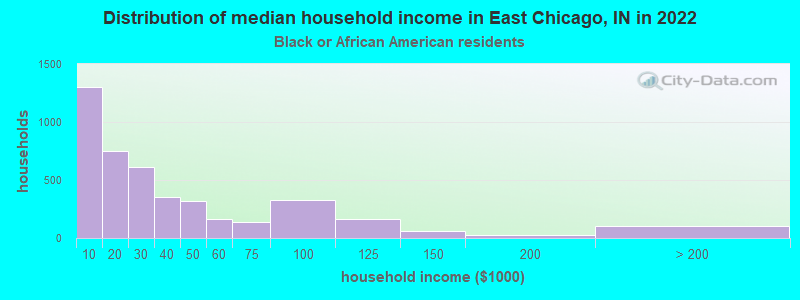
Income and house value in East Chicago Median household income in 2022 $30,218 White non-Hispanic householders$27,011 Black householders$51,869 Some other race householders$52,527 Two or more races householders$55,495 Hispanic or Latino race householdersMedian 2022 house value $98,555 White Non-Hispanic householders$97,719 Black or African American householders$132,242 American Indian or Alaska Native householders $226,203 Asian householders$156,602 Native Hawaiian and other Pacific Islander householders$90,759 Some other race householders$102,035 Two or more races householders$96,327 Hispanic or Latino householders
Median age by race in East Chicago
38.3 Median age for White residents38.0 38.7 31.2 Median age for Black or African American residents27.3 32.7 19.8 Median age for American Indian / Alaska Native residents21.7 -482,477,587.1 -758,738,277.2 Median age for Asian residents-689,473,683.5 -769,607,842.4 -664,335,663.7 Median age for Native Hawaiian / Pacific Islander residents-644,025,156.6 -664,437,011.6 41.9 Median age for Other race residents40.0 43.7 40.8 Median age for Two or more races residents24.1 48.2 50.1 Median age for White alone residents52.1 46.3 37.4 Median age for Hispanic or Latino residents36.8 38.7
Owner/renter occupied households by race in East Chicago
House owners and renters - White residents 1,204 73.4% Owner occupied435 26.6% Renter occupiedHouse owners and renters - Black or African American residents 1,001 22.9% Owner occupied3,362 77.1% Renter occupiedHouse owners and renters - American Indian / Alaska Native residents 16 68.1% Owner occupied7 31.9% Renter occupiedHouse owners and renters - Asian residents 32 100.0% Renter occupiedHouse owners and renters - Native Hawaiian / Pacific Islander residents 2 100.0% Renter occupiedHouse owners and renters - Other race residents 1,501 44.4% Owner occupied1,877 55.6% Renter occupiedHouse owners and renters - Two or more races residents 922 77.8% Owner occupied263 22.2% Renter occupiedHouse owners and renters - White alone residents 405 56.7% Owner occupied310 43.3% Renter occupiedHouse owners and renters - Hispanic or Latino residents 3,028 59.4% Owner occupied2,065 40.6% Renter occupied
Language usage in East Chicago
English speakers - Total 61.0% of residents of East Chicago speak English at home.
39.3% of residents speak Spanish at home 6,122 62.9% Speak English very well3,604 37.1% Speak English less than very well0.6% of residents speak other language at home 101 73.2% Speak English very well37 26.8% Speak English less than very well
English speakers - Born in the United States 76.5% of residents of East Chicago speak English at home.
23.4% of residents speak Spanish at home 1,514 83.7% Speak English very well294 16.3% Speak English less than very well0.3% of residents speak other language at home 23 100.0% Speak English very well
English speakers - Native, born elsewhere 16.2% of residents of East Chicago speak English at home.
85.2% of residents speak Spanish at home 491 73.3% Speak English very well179 26.7% Speak English less than very well
English speakers - Foreign-born 2.9% of residents of East Chicago speak English at home.
89.7% of residents speak Spanish at home 1,228 31.8% Speak English very well2,635 68.2% Speak English less than very well1.4% of residents speak other language at home 26 44.1% Speak English very well33 55.9% Speak English less than very well
White (Caucasian) - Speak only English Native:
64.4% (2,487)Foreign-born:
4.2% (32)
White (Caucasian) - Speak another language Native:
33.9% (1,308)Foreign-born:
99.2% (747)
Black or African American - Speak only English Native:
98.9% (9,072)Foreign-born:
82.4% (59)
Black or African American - Speak another language Native:
1.0% (88)Foreign-born:
28.8% (21)
American Indian / Alaska Native - Speak another language Native:
97.5% (50)Foreign-born:
100.0% (24)
Other race - Speak only English Native:
52.1% (3,153)Foreign-born:
2.0% (44)
Other race - Speak another language Native:
47.0% (2,846)Foreign-born:
96.0% (2,116)
Two or more races - Speak another language Native:
79.3% (1,665)Foreign-born:
100.0% (1,155)
White alone - Speak only English Native:
95.6% (1,609)Foreign-born:
30.9% (8)
White alone - Speak another language Native:
4.5% (75)Foreign-born:
60.0% (15)
Hispanic or Latino - Speak only English Native:
44.3% (4,507)Foreign-born:
1.5% (62)
Hispanic or Latino - Speak another language Native:
56.9% (5,787)Foreign-born:
98.4% (3,967)
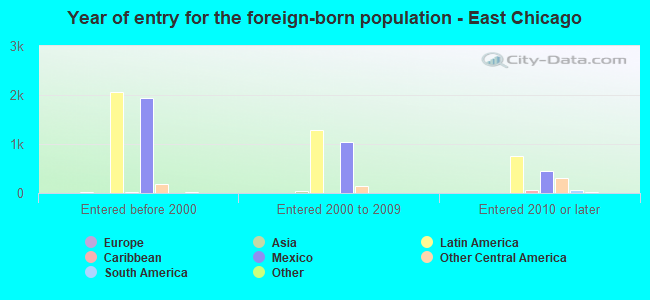
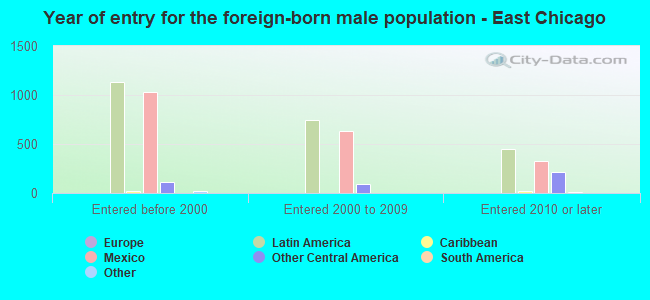
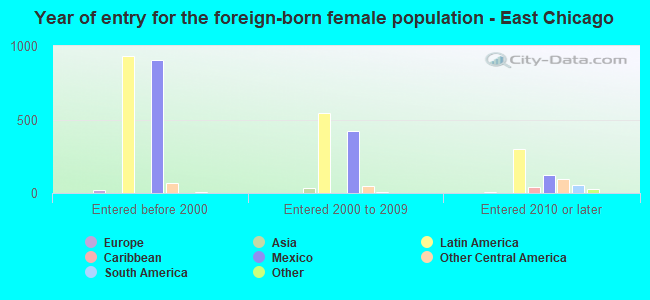
Foreign-born residents in East Chicago 4,441 residents are foreign born (15.0% Latin America ).
This city:
16.8%Indiana:
5.6%
Marital status for residents in East Chicago Marital status - White (Caucasian) population 15 years and over
Males 39.7% Never married43.9% Now married1.2% Separated3.2% Widowed12.0% DivorcedFemales 36.1% Never married36.8% Now married1.0% Separated13.1% Widowed13.0% DivorcedWomen who gave birth in the past 12 months Now married:
16.7% (19)Unmarried:
83.3% (94)
Women who did not give birth in the past 12 months Now married:
40.5% (428)Unmarried:
59.5% (628)
Marital status - Black or African American population 15 years and over
Males 64.9% Never married15.9% Now married2.9% Separated3.8% Widowed12.5% DivorcedFemales 63.8% Never married12.9% Now married1.3% Separated9.6% Widowed12.4% DivorcedWomen who gave birth in the past 12 months Now married:
5.3% (11)Unmarried:
94.7% (197)
Women who did not give birth in the past 12 months Now married:
12.1% (285)Unmarried:
87.9% (2,069)
Marital status - American Indian / Alaska Native population 15 years and over
Males 100.0% Never married0.0% Now married0.0% Separated0.0% Widowed0.0% DivorcedFemales 100.0% Never married0.0% Now married0.0% Separated0.0% Widowed0.0% DivorcedWomen who did not give birth in the past 12 months Now married:
0.0% (0)Unmarried:
100.0% (17)
Marital status - Other race population 15 years and over
Males 49.5% Never married29.7% Now married3.7% Separated3.7% Widowed13.4% DivorcedFemales 37.9% Never married33.0% Now married2.0% Separated8.0% Widowed19.1% DivorcedWomen who gave birth in the past 12 months Now married:
72.4% (40)Unmarried:
27.6% (15)
Women who did not give birth in the past 12 months Now married:
23.4% (437)Unmarried:
76.6% (1,431)
Marital status - Two or more races population 15 years and over
Males 49.7% Never married37.3% Now married0.0% Separated4.9% Widowed8.1% DivorcedFemales 27.1% Never married46.8% Now married9.8% Separated9.2% Widowed7.0% DivorcedWomen who gave birth in the past 12 months Now married:
0.0% (0)Unmarried:
100.0% (46)
Women who did not give birth in the past 12 months Now married:
63.5% (433)Unmarried:
36.5% (249)
Marital status - White alone, not Hispanic / Latino population 15 years and over
Males 45.2% Never married32.1% Now married1.2% Separated7.5% Widowed14.0% DivorcedFemales 43.3% Never married24.2% Now married1.3% Separated12.8% Widowed18.4% DivorcedWomen who gave birth in the past 12 months Now married:
15.6% (10)Unmarried:
84.4% (52)
Women who did not give birth in the past 12 months Now married:
23.6% (91)Unmarried:
76.4% (296)
Marital status - Hispanic or Latino population 15 years and over
Males 46.7% Never married35.6% Now married2.5% Separated3.2% Widowed12.0% DivorcedFemales 34.8% Never married37.9% Now married2.9% Separated9.4% Widowed15.0% DivorcedWomen who gave birth in the past 12 months Now married:
45.6% (55)Unmarried:
54.4% (65)
Women who did not give birth in the past 12 months Now married:
34.5% (1,147)Unmarried:
65.5% (2,179)
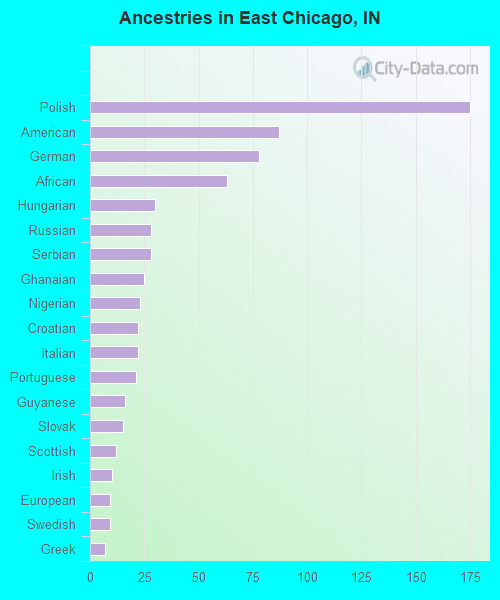
Ancestries in East Chicago
175 1.2% Polish87 0.6% American78 0.5% German63 0.4% African30 0.2% Hungarian28 0.2% Russian28 0.2% Serbian25 0.2% Ghanaian23 0.2% Nigerian22 0.2% Croatian22 0.2% Italian21 0.1% Portuguese16 0.1% Guyanese15 0.1% Slovak12 0.08% Scottish10 0.07% Irish9 0.06% European9 0.06% Swedish7 0.05% Greek
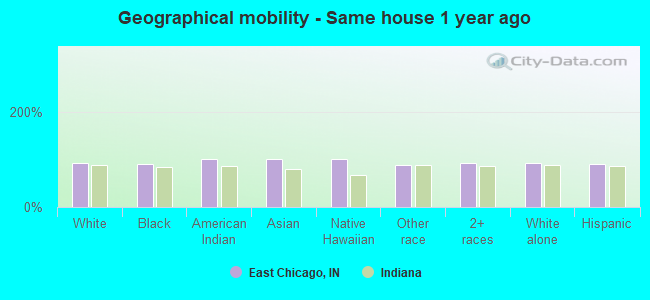
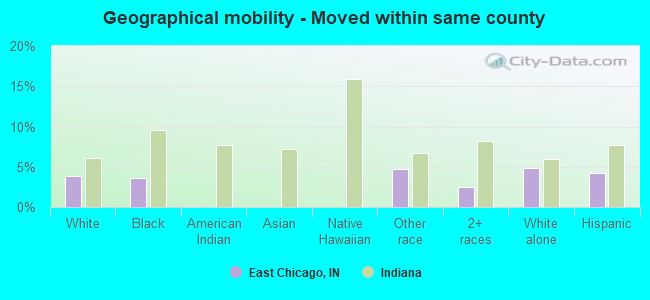
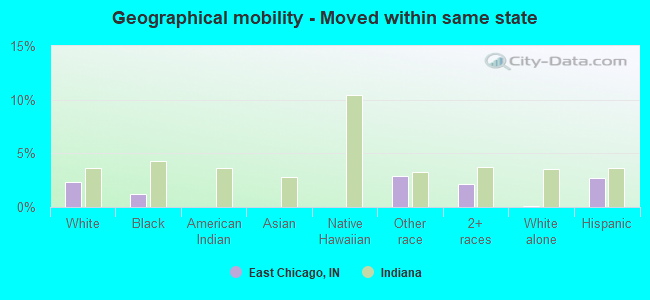
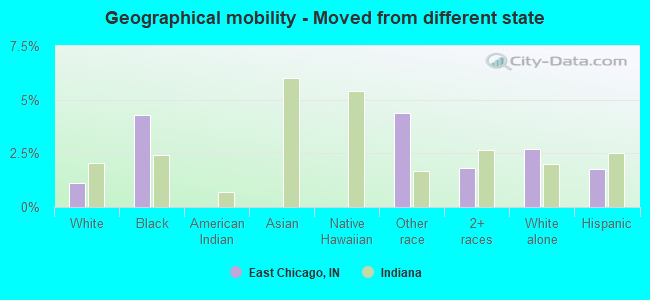
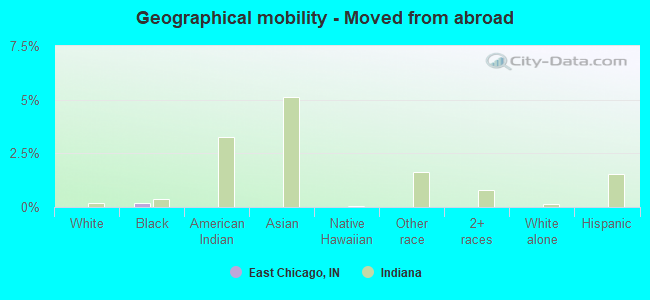
Geographical mobility in East Chicago Same house 1 year ago 4,511 92.9% White (Caucasian)9,064 90.9% Black or African American106 100.0% American Indian / Alaska Native30 99.5% Asian2 100.0% Native Hawaiian / Pacific Islander7,668 89.0% Other race3,063 91.7% Two or more races1,650 92.3% White alone, not Hispanic / Latino13,336 89.7% Hispanic or LatinoMoved within same county 189 3.9% White / Caucasian360 3.6% Black or African American411 4.8% Other race81 2.4% Two or more races86 4.8% White alone, not Hispanic / Latino626 4.2% Hispanic or LatinoMoved within same state 114 2.3% White / Caucasian118 1.2% Black or African American246 2.9% Other race72 2.2% Two or more races2 0.1% White alone, not Hispanic / Latino407 2.7% Hispanic or LatinoMoved from different state 55 1.1% White / Caucasian426 4.3% Black or African American378 4.4% Other race60 1.8% Two or more races49 2.7% White alone, not Hispanic / Latino263 1.8% Hispanic or LatinoMoved from abroad 17 0.2% Black or African American
Children Nativity (place of birth) in East Chicago
Children under 6 years - Living with two parents Both parents native 255 100.0% NativeBoth parents foreign-born 199 100.0% NativeOne native, one foreign-born parent 160 100.0% NativeChildren under 6 years - Living with one parent Native parent 1,100 100.0% NativeForeign-born parent 118 100.0% NativeChildren 6 to 17 years - Living with two parents Both parents native 724 99.8% Native1 0.2% Foreign-bornBoth parents foreign-born 454 98.5% Native7 1.5% Foreign-bornOne native, one foreign-born parent 217 100.0% NativeChildren 6 to 17 years - Living with one parent Native parent 2,400 100.0% NativeForeign-born parent 388 50.0% Native389 50.0% Foreign-born
Grandparents responsible for own grandchildren in East Chicago
Grandparents (30 to 59 years) White / Caucasian 24 25.5% Responsible for grandchildren71 74.5% Not responsible for grandchildrenBlack or African American 58 29.0% Responsible for grandchildren142 71.0% Not responsible for grandchildrenOther race 28 24.4% Responsible for grandchildren87 75.6% Not responsible for grandchildrenTwo or more races 11 100.0% Responsible for grandchildrenWhite alone, not Hispanic / Latino 13 100.0% Responsible for grandchildrenHispanic or Latino 58 25.3% Responsible for grandchildren172 74.7% Not responsible for grandchildrenGrandparents (60 years and over) White / Caucasian 8 4.4% Responsible for grandchildren166 95.6% Not responsible for grandchildrenBlack or African American 22 67.2% Responsible for grandchildren11 32.8% Not responsible for grandchildrenOther race 115 100.0% Not responsible for grandchildrenTwo or more races 16 100.0% Responsible for grandchildrenWhite alone, not Hispanic / Latino 29 100.0% Not responsible for grandchildrenHispanic or Latino 12 3.7% Responsible for grandchildren315 96.3% Not responsible for grandchildren