Races in East Dunbar, Florida (FL) Detailed Stats
Ancestries, Foreign-born residents, place of birth

Discuss East Dunbar, Florida races on our local forum with over 2,400,000 registered users
1.2% of East Dunbar, FL residents are foreign-born , which is 1666.7% less than the foreign-born rate of 21.0% across the entire state of Florida.
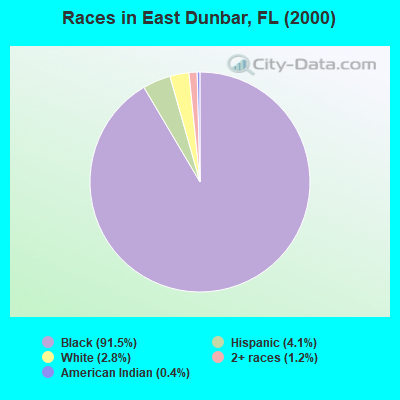
Race distribution in East Dunbar

- 1,77191.5%Black alone
- 794.1%Hispanic
- 542.8%White alone
- 231.2%Two or more races
- 70.4%American Indian alone
- 10.05%Asian alone
2000
2022
-
- 10,458,50965.4%White alone
- 2,682,71516.8%Hispanic
- 2,264,26814.2%Black alone
- 261,6931.6%Asian alone
- 236,9541.5%Two or more races
- 42,3580.3%American Indian alone
- 28,9940.2%Other race alone
- 6,8870.04%Native Hawaiian and Other
Pacific Islander alone

-
- 11,309,40350.8%White alone
- 6,025,03927.1%Hispanic
- 3,241,01514.6%Black alone
- 861,6303.9%Two or more races
- 623,6922.8%Asian alone
- 152,0540.7%Other race alone
- 22,5040.1%American Indian alone
- 9,4860.04%Native Hawaiian and Other
Pacific Islander alone

Income and house value in East Dunbar
- Median household income in 2022
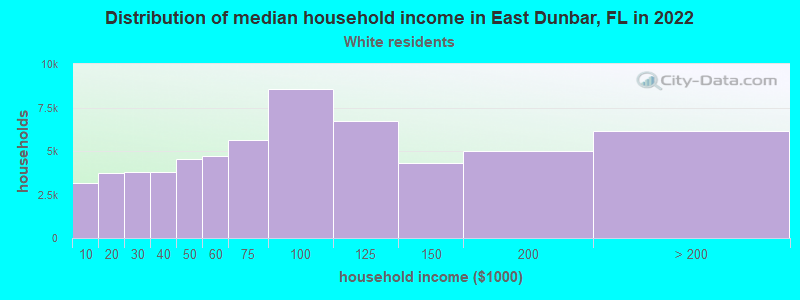
- $16,304White non-Hispanic householders
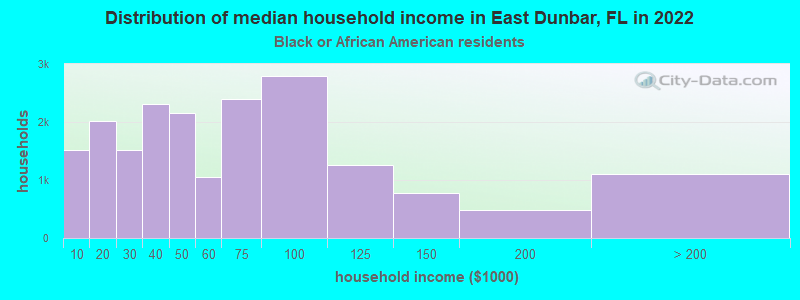
- $48,759Black householders
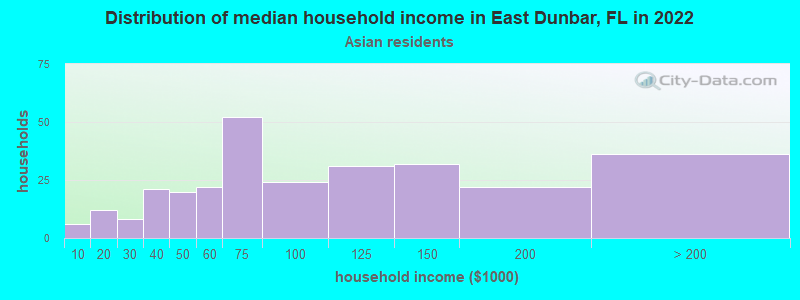
- $5,315Asian householders
- $62,804Two or more races householders
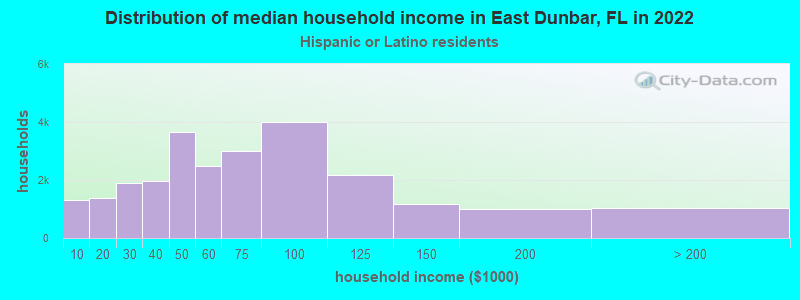
- $24,352Hispanic or Latino race householders
- Median 2022 house value
- $156,594Black or African American householders
- $513,883Asian householders
Household income for White non-Hispanic householders
Household income for Black householders
Household income for Asian householders
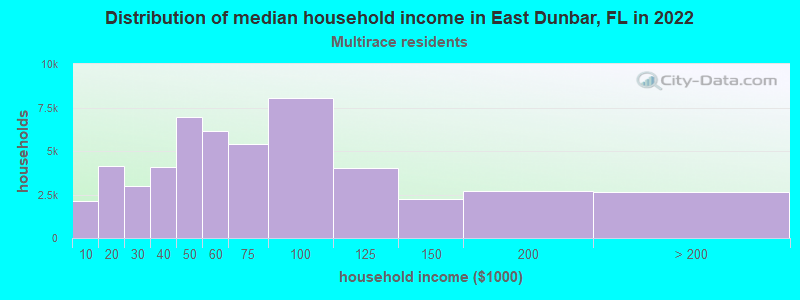
Household income for Two or more races householders
Household income for Hispanic or Latino race householders
Foreign-born residents in East Dunbar
23 residents are foreign born
| This city: | 1.2% |
| Florida: | 16.7% |
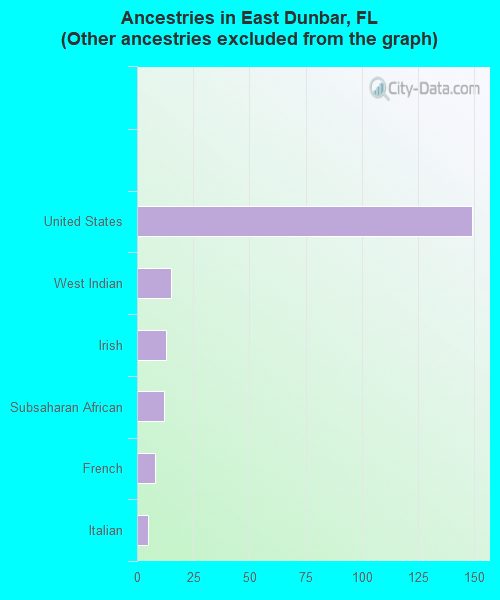
Ancestries in East Dunbar

- 1,59288.7%Other
- 1498.3%United States
- 150.8%West Indian
- 130.7%Irish
- 120.7%Subsaharan African
- 80.4%French
- 50.3%Italian
Zip codes: 33916.