Races in East Franklin, New Jersey (NJ) Detailed Stats
Data:
Races - White alone (%)
Races - White alone (% change since 2000)
Races - Black alone (%)
Races - Black alone (% change since 2000)
Races - American Indian alone (%)
Races - American Indian alone (% change since 2000)
Races - Asian alone (%)
Races - Asian alone (% change since 2000)
Races - Hispanic (%)
Races - Hispanic (% change since 2000)
Races - Native Hawaiian and Other Pacific Islander alone (%)
Races - Native Hawaiian and Other Pacific Islander alone (% change since 2000)
Races - Two or more races(%)
Races - Two or more races(% change since 2000)
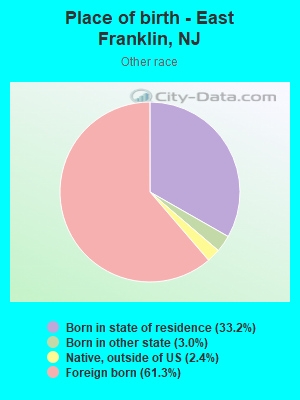
Races - Other race alone (%)
Races - Other race alone (% change since 2000)
Racial diversity
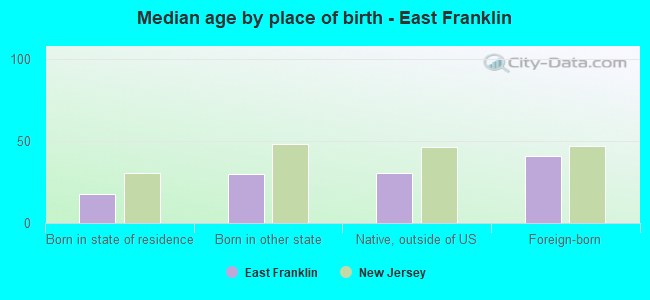
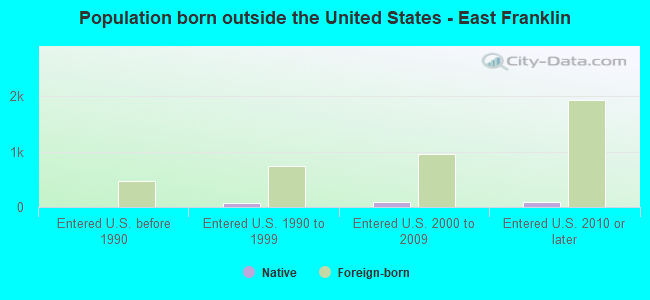
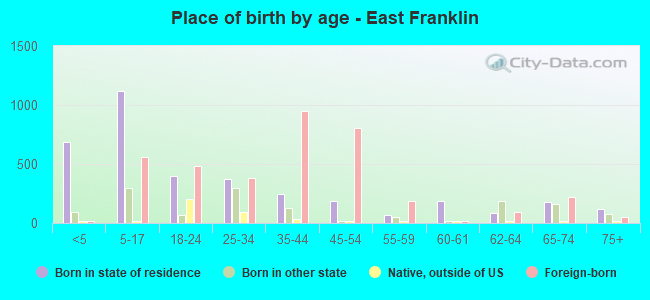
Place of birth - Born in state of residence (%)
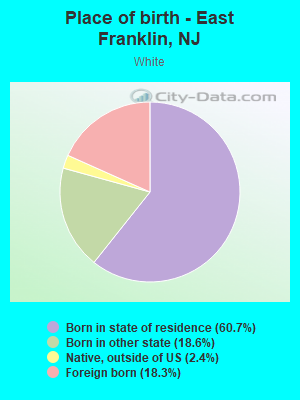
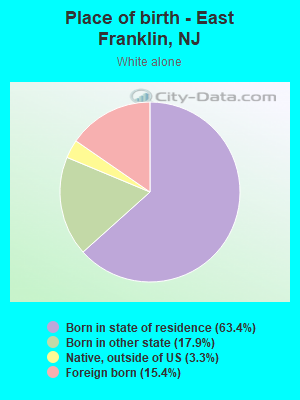
Place of birth - Born in state of residence (%) - White
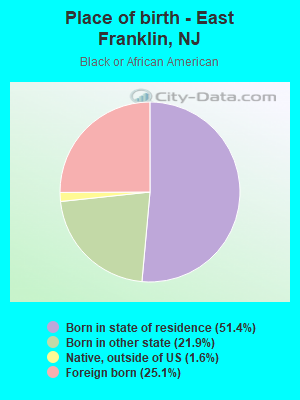
Place of birth - Born in state of residence (%) - Black or African American
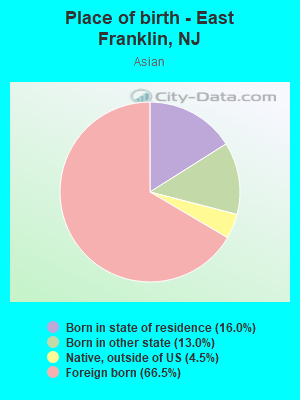
Place of birth - Born in state of residence (%) - Asian
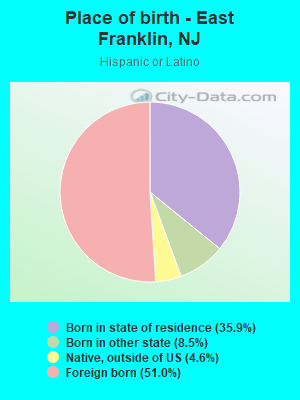
Place of birth - Born in state of residence (%) - Hispanic or Latino
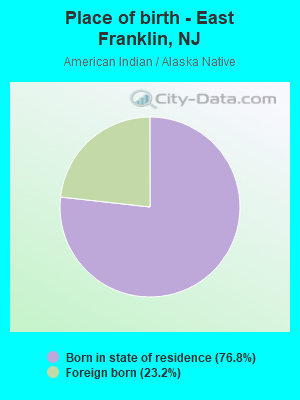
Place of birth - Born in state of residence (%) - American Indian and Alaska Native
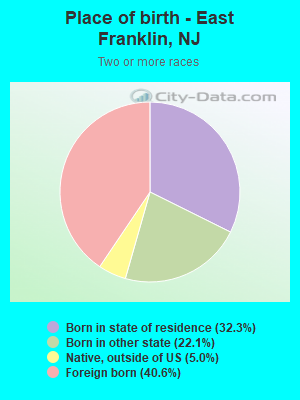
Place of birth - Born in state of residence (%) - Multirace
Place of birth - Born in state of residence (%) - Other Race
Place of birth - Born in other state (%)
Place of birth - Born in other state (%) - White
Place of birth - Born in other state (%) - Black or African American
Place of birth - Born in other state (%) - Asian
Place of birth - Born in other state (%) - Hispanic or Latino
Place of birth - Born in other state (%) - American Indian and Alaska Native
Place of birth - Born in other state (%) - Multirace
Place of birth - Born in other state (%) - Other Race
Place of birth - Native, outside of US (%)
Place of birth - Native, outside of US (%) - White
Place of birth - Native, outside of US (%) - Black or African American
Place of birth - Native, outside of US (%) - Asian
Place of birth - Native, outside of US (%) - Hispanic or Latino
Place of birth - Native, outside of US (%) - American Indian and Alaska Native
Place of birth - Native, outside of US (%) - Multirace
Place of birth - Native, outside of US (%) - Other Race
Place of birth - Foreign born (%)
Place of birth - Foreign born (%) - White
Place of birth - Foreign born (%) - Black or African American
Place of birth - Foreign born (%) - Asian
Place of birth - Foreign born (%) - Hispanic or Latino
Place of birth - Foreign born (%) - American Indian and Alaska Native
Place of birth - Foreign born (%) - Multirace
Place of birth - Foreign born (%) - Other Race
Residents speaking English at home (%)
Residents speaking English at home - Born in the United States (%)
Residents speaking English at home - Native, born elsewhere (%)
Residents speaking English at home - Foreign born (%)
Residents speaking Spanish at home (%)
Residents speaking Spanish at home - Born in the United States (%)
Residents speaking Spanish at home - Native, born elsewhere (%)
Residents speaking Spanish at home - Foreign born (%)
Residents speaking other language at home (%)
Residents speaking other language at home - Born in the United States (%)
Residents speaking other language at home - Native, born elsewhere (%)
Residents speaking other language at home - Foreign born (%)
Marital status - Never married (%)
Marital status - Now married (%)
Marital status - Separated (%)
Marital status - Widowed (%)
Marital status - Divorced (%)
Ancestries Reported - Arab (%)
Ancestries Reported - Czech (%)
Ancestries Reported - Danish (%)
Ancestries Reported - Dutch (%)
Ancestries Reported - English (%)
Ancestries Reported - French (%)
Ancestries Reported - French Canadian (%)
Ancestries Reported - German (%)
Ancestries Reported - Greek (%)
Ancestries Reported - Hungarian (%)
Ancestries Reported - Irish (%)
Ancestries Reported - Italian (%)
Ancestries Reported - Lithuanian (%)
Ancestries Reported - Norwegian (%)
Ancestries Reported - Polish (%)
Ancestries Reported - Portuguese (%)
Ancestries Reported - Russian (%)
Ancestries Reported - Scotch-Irish (%)
Ancestries Reported - Scottish (%)
Ancestries Reported - Slovak (%)
Ancestries Reported - Subsaharan African (%)
Ancestries Reported - Swedish (%)
Ancestries Reported - Swiss (%)
Ancestries Reported - Ukrainian (%)
Ancestries Reported - United States (%)
Ancestries Reported - Welsh (%)
Ancestries Reported - West Indian (%)
Ancestries Reported - Other (%)
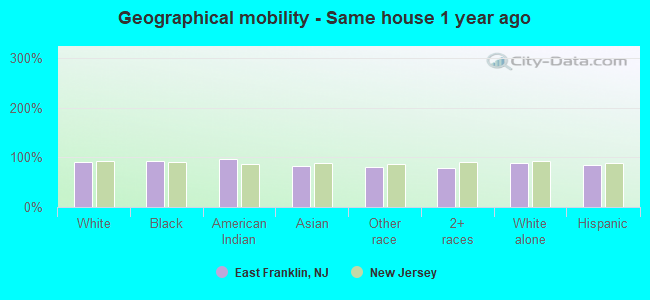
Geographical mobility - Same house 1 year ago (%)
Geographical mobility - Same house 1 year ago (%) - White
Geographical mobility - Same house 1 year ago (%) - Black or African American
Geographical mobility - Same house 1 year ago (%) - Asian
Geographical mobility - Same house 1 year ago (%) - Hispanic or Latino
Geographical mobility - Same house 1 year ago (%) - American Indian and Alaska Native
Geographical mobility - Same house 1 year ago (%) - Multirace
Geographical mobility - Same house 1 year ago (%) - Other Race
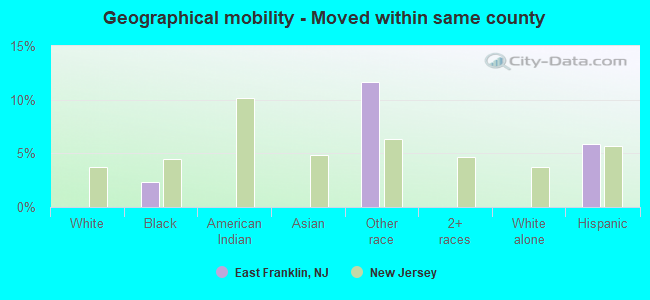
Geographical mobility - Moved within same county (%)
Geographical mobility - Moved within same county (%) - White
Geographical mobility - Moved within same county (%) - Black or African American
Geographical mobility - Moved within same county (%) - Asian
Geographical mobility - Moved within same county (%) - Hispanic or Latino
Geographical mobility - Moved within same county (%) - American Indian and Alaska Native
Geographical mobility - Moved within same county (%) - Multirace
Geographical mobility - Moved within same county (%) - Other Race
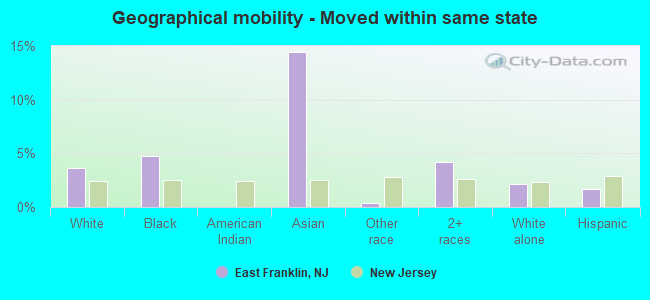
Geographical mobility - Moved from different county within same state (%)
Geographical mobility - Moved from different county within same state (%) - White
Geographical mobility - Moved from different county within same state (%) - Black or African American
Geographical mobility - Moved from different county within same state (%) - Asian
Geographical mobility - Moved from different county within same state (%) - Hispanic or Latino
Geographical mobility - Moved from different county within same state (%) - American Indian and Alaska Native
Geographical mobility - Moved from different county within same state (%) - Multirace
Geographical mobility - Moved from different county within same state (%) - Other Race
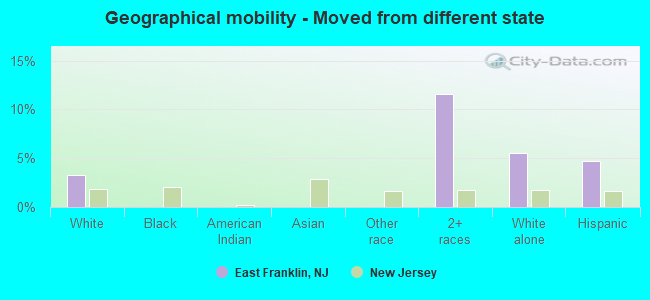
Geographical mobility - Moved from different state (%)
Geographical mobility - Moved from different state (%) - White
Geographical mobility - Moved from different state (%) - Black or African American
Geographical mobility - Moved from different state (%) - Asian
Geographical mobility - Moved from different state (%) - Hispanic or Latino
Geographical mobility - Moved from different state (%) - American Indian and Alaska Native
Geographical mobility - Moved from different state (%) - Multirace
Geographical mobility - Moved from different state (%) - Other Race
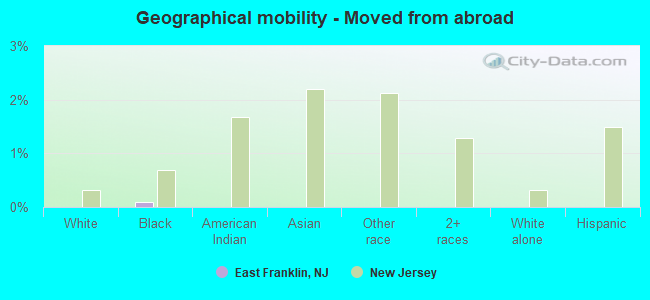
Geographical mobility - Moved from abroad (%)
Geographical mobility - Moved from abroad (%) - White
Geographical mobility - Moved from abroad (%) - Black or African American
Geographical mobility - Moved from abroad (%) - Asian
Geographical mobility - Moved from abroad (%) - Hispanic or Latino
Geographical mobility - Moved from abroad (%) - American Indian and Alaska Native
Geographical mobility - Moved from abroad (%) - Multirace
Geographical mobility - Moved from abroad (%) - Other Race
Place of birth for the foreign-born population - Ireland (%)
Place of birth for the foreign-born population - Denmark (%)
Place of birth for the foreign-born population - Norway (%)
Place of birth for the foreign-born population - Sweden (%)
Place of birth for the foreign-born population - United Kingdom (%)
Place of birth for the foreign-born population - England (%)
Place of birth for the foreign-born population - Scotland (%)
Place of birth for the foreign-born population - Other Northern Europe (%)
Place of birth for the foreign-born population - Austria (%)
Place of birth for the foreign-born population - Belgium (%)
Place of birth for the foreign-born population - France (%)
Place of birth for the foreign-born population - Germany (%)
Place of birth for the foreign-born population - Netherlands (%)
Place of birth for the foreign-born population - Switzerland (%)
Place of birth for the foreign-born population - Other Western Europe (%)
Place of birth for the foreign-born population - Greece (%)
Place of birth for the foreign-born population - Italy (%)
Place of birth for the foreign-born population - Portugal (%)
Place of birth for the foreign-born population - Spain (%)
Place of birth for the foreign-born population - Other Southern Europe (%)
Place of birth for the foreign-born population - Albania (%)
Place of birth for the foreign-born population - Belarus (%)
Place of birth for the foreign-born population - Bosnia and Herzegovina (%)
Place of birth for the foreign-born population - Bulgaria (%)
Place of birth for the foreign-born population - Croatia (%)
Place of birth for the foreign-born population - Czechoslovakia (%)
Place of birth for the foreign-born population - Hungary (%)
Place of birth for the foreign-born population - Latvia (%)
Place of birth for the foreign-born population - Lithuania (%)
Place of birth for the foreign-born population - North Macedonia (Macedonia) (%)
Place of birth for the foreign-born population - Moldova (%)
Place of birth for the foreign-born population - Poland (%)
Place of birth for the foreign-born population - Romania (%)
Place of birth for the foreign-born population - Russia (%)
Place of birth for the foreign-born population - Serbia (%)
Place of birth for the foreign-born population - Ukraine (%)
Place of birth for the foreign-born population - Other Eastern Europe (%)
Place of birth for the foreign-born population - China (%)
Place of birth for the foreign-born population - Hong Kong (%)
Place of birth for the foreign-born population - Taiwan (%)
Place of birth for the foreign-born population - Japan (%)
Place of birth for the foreign-born population - Korea (%)
Place of birth for the foreign-born population - Other Eastern Asia (%)
Place of birth for the foreign-born population - Afghanistan (%)
Place of birth for the foreign-born population - Bangladesh (%)
Place of birth for the foreign-born population - India (%)
Place of birth for the foreign-born population - Iran (%)
Place of birth for the foreign-born population - Kazakhstan (%)
Place of birth for the foreign-born population - Nepal (%)
Place of birth for the foreign-born population - Pakistan (%)
Place of birth for the foreign-born population - Sri Lanka (%)
Place of birth for the foreign-born population - Uzbekistan (%)
Place of birth for the foreign-born population - Other South Central Asia (%)
Place of birth for the foreign-born population - Burma (%)
Place of birth for the foreign-born population - Cambodia (%)
Place of birth for the foreign-born population - Indonesia (%)
Place of birth for the foreign-born population - Laos (%)
Place of birth for the foreign-born population - Malaysia (%)
Place of birth for the foreign-born population - Philippines (%)
Place of birth for the foreign-born population - Singapore (%)
Place of birth for the foreign-born population - Thailand (%)
Place of birth for the foreign-born population - Vietnam (%)
Place of birth for the foreign-born population - Other South Eastern Asia (%)
Place of birth for the foreign-born population - Armenia (%)
Place of birth for the foreign-born population - Iraq (%)
Place of birth for the foreign-born population - Israel (%)
Place of birth for the foreign-born population - Jordan (%)
Place of birth for the foreign-born population - Kuwait (%)
Place of birth for the foreign-born population - Lebanon (%)
Place of birth for the foreign-born population - Saudi Arabia (%)
Place of birth for the foreign-born population - Syria (%)
Place of birth for the foreign-born population - Turkey (%)
Place of birth for the foreign-born population - Yemen (%)
Place of birth for the foreign-born population - Other Western Asia (%)
Place of birth for the foreign-born population - Eritrea (%)
Place of birth for the foreign-born population - Ethiopia (%)
Place of birth for the foreign-born population - Kenya (%)
Place of birth for the foreign-born population - Somalia (%)
Place of birth for the foreign-born population - Uganda (%)
Place of birth for the foreign-born population - Zimbabwe (%)
Place of birth for the foreign-born population - Other Eastern Africa (%)
Place of birth for the foreign-born population - Cameroon (%)
Place of birth for the foreign-born population - Congo (%)
Place of birth for the foreign-born population - Democratic Republic of Congo (Zaire) (%)
Place of birth for the foreign-born population - Other Middle Africa (%)
Place of birth for the foreign-born population - Egypt (%)
Place of birth for the foreign-born population - Morocco (%)
Place of birth for the foreign-born population - Sudan (%)
Place of birth for the foreign-born population - Other Northern Africa (%)
Place of birth for the foreign-born population - South Africa (%)
Place of birth for the foreign-born population - Other Southern Africa (%)
Place of birth for the foreign-born population - Cabo Verde (%)
Place of birth for the foreign-born population - Ghana (%)
Place of birth for the foreign-born population - Liberia (%)
Place of birth for the foreign-born population - Nigeria (%)
Place of birth for the foreign-born population - Senegal (%)
Place of birth for the foreign-born population - Sierra Leone (%)
Place of birth for the foreign-born population - Other Western Africa (%)
Place of birth for the foreign-born population - Australia (%)
Place of birth for the foreign-born population - New Zealand (%)
Place of birth for the foreign-born population - Fiji (%)
Place of birth for the foreign-born population - Micronesia (%)
Place of birth for the foreign-born population - Bahamas (%)
Place of birth for the foreign-born population - Barbados (%)
Place of birth for the foreign-born population - Cuba (%)
Place of birth for the foreign-born population - Dominica (%)
Place of birth for the foreign-born population - Dominican Republic (%)
Place of birth for the foreign-born population - Grenada (%)
Place of birth for the foreign-born population - Haiti (%)
Place of birth for the foreign-born population - Jamaica (%)
Place of birth for the foreign-born population - St. Vincent and the Grenadines (%)
Place of birth for the foreign-born population - Trinidad and Tobago (%)
Place of birth for the foreign-born population - West Indies (%)
Place of birth for the foreign-born population - Other Caribbean (%)
Place of birth for the foreign-born population - Belize (%)
Place of birth for the foreign-born population - Costa Rica (%)
Place of birth for the foreign-born population - El Salvador (%)
Place of birth for the foreign-born population - Guatemala (%)
Place of birth for the foreign-born population - Honduras (%)
Place of birth for the foreign-born population - Mexico (%)
Place of birth for the foreign-born population - Nicaragua (%)
Place of birth for the foreign-born population - Panama (%)
Place of birth for the foreign-born population - Other Central America (%)
Place of birth for the foreign-born population - Argentina (%)
Place of birth for the foreign-born population - Bolivia (%)
Place of birth for the foreign-born population - Brazil (%)
Place of birth for the foreign-born population - Chile (%)
Place of birth for the foreign-born population - Colombia (%)
Place of birth for the foreign-born population - Ecuador (%)
Place of birth for the foreign-born population - Guyana (%)
Place of birth for the foreign-born population - Peru (%)
Place of birth for the foreign-born population - Uruguay (%)
Place of birth for the foreign-born population - Venezuela (%)
Place of birth for the foreign-born population - Other South America (%)
Place of birth for the foreign-born population - Canada (%)
Place of birth for the foreign-born population - Other Northern America (%)
Place of birth for the foreign-born population - Other (%)
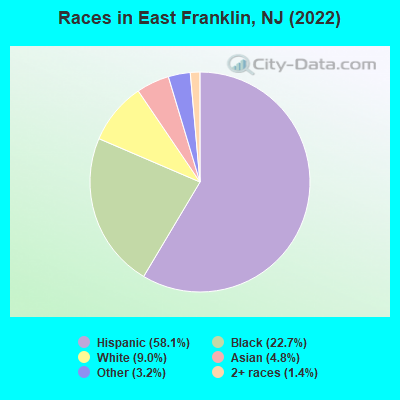
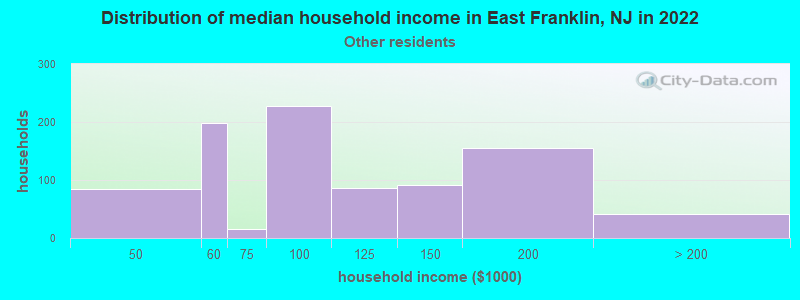
According to 2022 data, the most numerous races in East Franklin, NJ are White alone (843 residents), Hispanic (5,435 residents), and Black alone (2,123 residents). 40.7% of East Franklin residents speak English at home.
Race distribution in East Franklin 5,435 58.1% Hispanic 2,123 22.7% Black alone 843 9.0% White alone 449 4.8% Asian alone 300 3.2% Other race alone 134 1.4% Two or more races
2000 2022
5,557,209 66.0% White alone 1,117,191 13.3% Hispanic 1,096,171 13.0% Black alone 477,012 5.7% Asian alone 133,689 1.6% Two or more races 19,565 0.2% Other race alone 11,338 0.1% American Indian alone 2,175 0.03% Native Hawaiian and Other
4,766,476 51.5% White alone 2,028,470 21.9% Hispanic 1,111,632 12.0% Black alone 923,546 10.0% Asian alone 332,237 3.6% Two or more races 89,847 1.0% Other race alone 8,557 0.09% American Indian alone 934 0.01% Native Hawaiian and Other
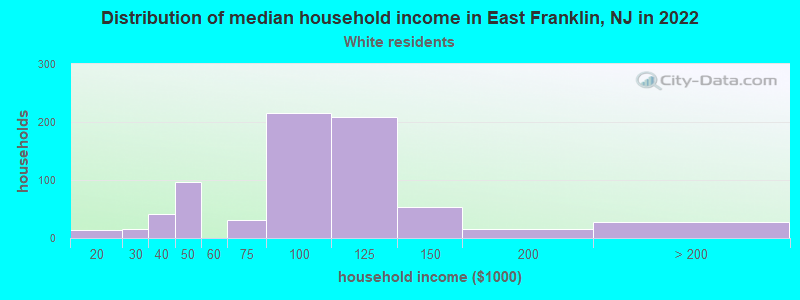
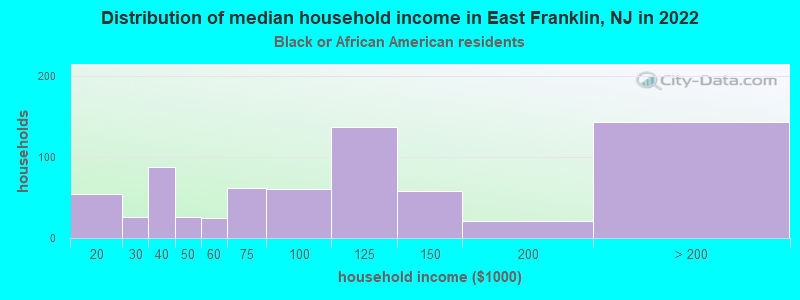
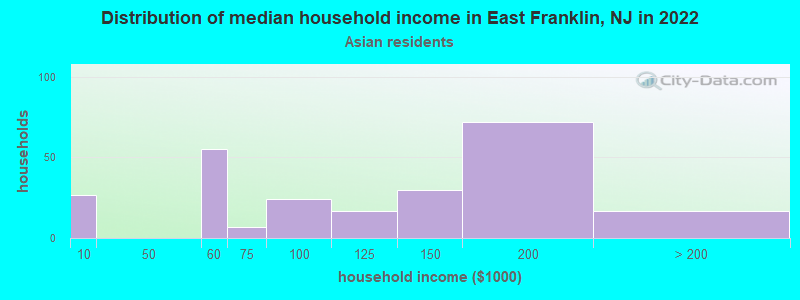
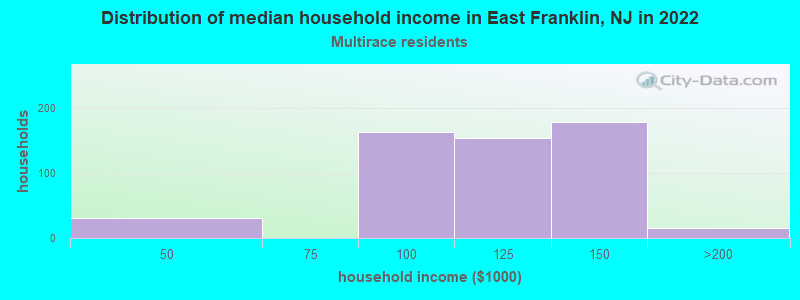
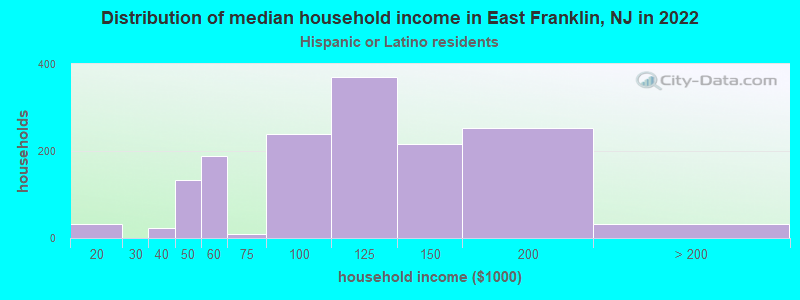
Income and house value in East Franklin Median household income in 2022 $91,946 White non-Hispanic householders$111,808 Black householders$110,153 Some other race householders$127,709 Two or more races householders$118,886 Hispanic or Latino race householders
Median age by race in East Franklin
41.0 Median age for White residents33.8 54.8 43.3 Median age for Black or African American residents42.7 46.7 4.9 Median age for American Indian / Alaska Native residents-643,500,642.9 -1,220,338,981.8 48.0 Median age for Asian residents51.2 40.9 -804,177,544.9 Median age for Native Hawaiian / Pacific Islander residents-666,666,666.0 -713,070,378.3 20.9 Median age for Other race residents24.0 20.0 28.3 Median age for Two or more races residents11.9 33.2 55.2 Median age for White alone residents37.2 65.8 23.5 Median age for Hispanic or Latino residents21.9 24.1
Owner/renter occupied households by race in East Franklin
House owners and renters - White residents 412 65.7% Owner occupied216 34.3% Renter occupiedHouse owners and renters - Black or African American residents 397 59.6% Owner occupied269 40.4% Renter occupiedHouse owners and renters - American Indian / Alaska Native residents 16 100.0% Owner occupiedHouse owners and renters - Asian residents 160 73.4% Owner occupied58 26.6% Renter occupiedHouse owners and renters - Other race residents 256 32.0% Owner occupied542 68.0% Renter occupiedHouse owners and renters - Two or more races residents 274 45.2% Owner occupied332 54.8% Renter occupiedHouse owners and renters - White alone residents 322 67.7% Owner occupied154 32.3% Renter occupiedHouse owners and renters - Hispanic or Latino residents 559 40.6% Owner occupied819 59.4% Renter occupied
Language usage in East Franklin
English speakers - Total 40.7% of residents of East Franklin speak English at home.
49.0% of residents speak Spanish at home 1,744 41.5% Speak English very well2,460 58.5% Speak English less than very well10.3% of residents speak other language at home 800 90.3% Speak English very well86 9.7% Speak English less than very well
English speakers - Born in the United States 77.7% of residents of East Franklin speak English at home.
14.8% of residents speak Spanish at home 92 48.7% Speak English very well97 51.3% Speak English less than very well10.5% of residents speak other language at home 134 100.0% Speak English very well
English speakers - Native, born elsewhere 63.7% of residents of East Franklin speak English at home.
17.5% of residents speak Spanish at home 55 100.0% Speak English very well6.1% of residents speak other language at home 19 100.0% Speak English very well
English speakers - Foreign-born 18.5% of residents of East Franklin speak English at home.
65.3% of residents speak Spanish at home 520 19.9% Speak English very well2,091 80.1% Speak English less than very well12.7% of residents speak other language at home 420 82.8% Speak English very well87 17.2% Speak English less than very well
White (Caucasian) - Speak only English Native:
71.3% (685)Foreign-born:
4.2% (9)
White (Caucasian) - Speak another language Native:
28.4% (273)Foreign-born:
97.7% (217)
Black or African American - Speak only English Native:
95.7% (1,549)Foreign-born:
100.0% (543)
Black or African American - Speak another language Native:
3.9% (63)Foreign-born:
14.5% (79)
American Indian / Alaska Native - Speak another language Native:
100.0% (16)Foreign-born:
97.6% (17)
Asian - Speak only English Native:
15.0% (23)Foreign-born:
38.8% (114)
Asian - Speak another language Native:
94.1% (146)Foreign-born:
60.8% (178)
Other race - Speak only English Native:
8.5% (103)Foreign-born:
7.4% (170)
Other race - Speak another language Native:
99.2% (1,198)Foreign-born:
92.4% (2,114)
Two or more races - Speak only English Native:
57.5% (562)Foreign-born:
9.5% (101)
Two or more races - Speak another language Native:
40.4% (395)Foreign-born:
90.4% (963)
White alone - Speak only English Native:
82.8% (587)Foreign-born:
7.7% (10)
White alone - Speak another language Native:
19.9% (141)Foreign-born:
98.4% (127)
Hispanic or Latino - Speak only English Native:
33.7% (636)Foreign-born:
11.0% (299)
Hispanic or Latino - Speak another language Native:
66.7% (1,261)Foreign-born:
89.6% (2,429)
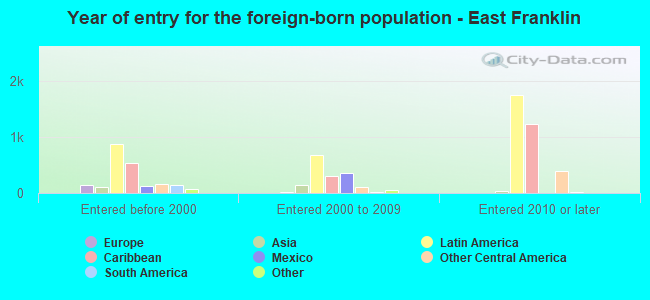
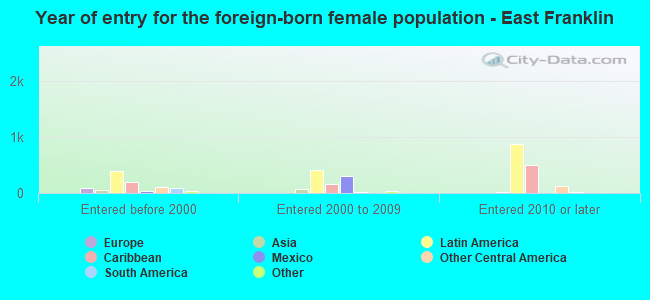
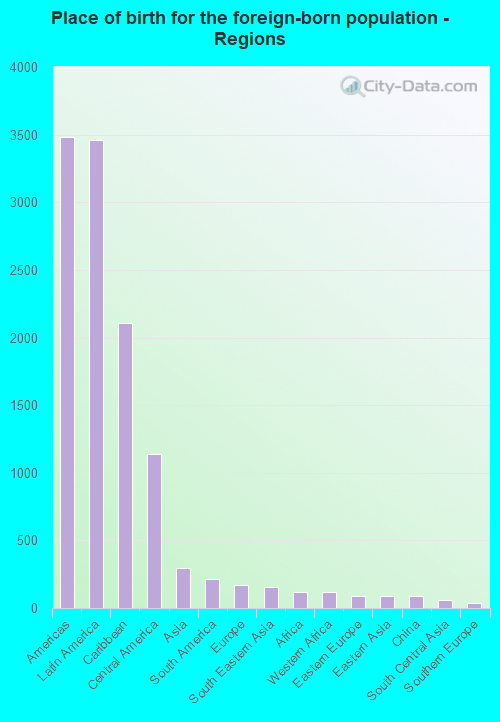
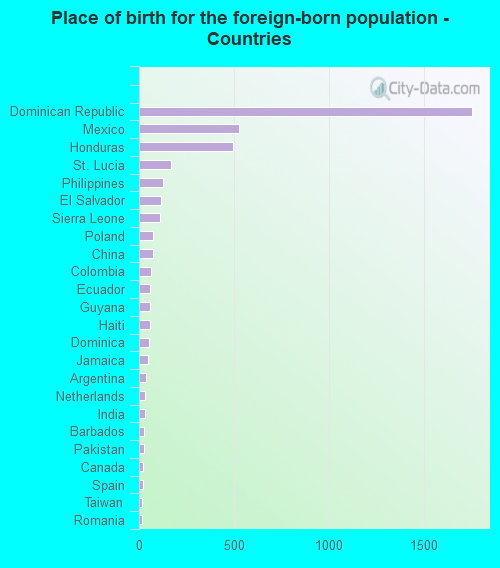
Foreign-born residents in East Franklin
Marital status for residents in East Franklin Marital status - White (Caucasian) population 15 years and over
Males 47.0% Never married44.7% Now married1.7% Separated6.7% Widowed0.0% DivorcedFemales 36.3% Never married41.6% Now married0.0% Separated7.9% Widowed14.2% DivorcedWomen who gave birth in the past 12 months Now married:
0.0% (0)Unmarried:
100.0% (28)
Women who did not give birth in the past 12 months Now married:
12.2% (20)Unmarried:
87.8% (144)
Marital status - Black or African American population 15 years and over
Males 65.8% Never married24.8% Now married2.1% Separated4.7% Widowed2.6% DivorcedFemales 35.8% Never married29.0% Now married15.2% Separated6.7% Widowed13.3% DivorcedWomen who gave birth in the past 12 months Now married:
100.0% (22)Unmarried:
0.0% (0)
Women who did not give birth in the past 12 months Now married:
22.3% (87)Unmarried:
77.7% (303)
Marital status - Asian population 15 years and over
Males 40.6% Never married45.9% Now married7.7% Separated0.0% Widowed5.8% DivorcedFemales 47.3% Never married38.4% Now married14.3% Separated0.0% Widowed0.0% DivorcedWomen who did not give birth in the past 12 months Now married:
10.9% (13)Unmarried:
89.1% (106)
Marital status - Other race population 15 years and over
Males 60.4% Never married37.6% Now married0.0% Separated0.0% Widowed2.0% DivorcedFemales 35.3% Never married52.7% Now married6.1% Separated0.0% Widowed5.9% DivorcedWomen who gave birth in the past 12 months Now married:
12.9% (18)Unmarried:
87.1% (125)
Women who did not give birth in the past 12 months Now married:
63.3% (518)Unmarried:
36.7% (300)
Marital status - Two or more races population 15 years and over
Males 22.2% Never married72.8% Now married0.0% Separated0.0% Widowed5.0% DivorcedFemales 23.2% Never married74.9% Now married0.0% Separated0.0% Widowed2.0% DivorcedWomen who gave birth in the past 12 months Now married:
60.4% (49)Unmarried:
39.6% (32)
Women who did not give birth in the past 12 months Now married:
75.4% (498)Unmarried:
24.6% (163)
Marital status - White alone, not Hispanic / Latino population 15 years and over
Males 48.8% Never married41.8% Now married0.0% Separated9.3% Widowed0.0% DivorcedFemales 34.0% Never married53.7% Now married0.0% Separated12.3% Widowed0.0% DivorcedWomen who did not give birth in the past 12 months Now married:
0.0% (0)Unmarried:
100.0% (78)
Marital status - Hispanic or Latino population 15 years and over
Males 48.6% Never married47.7% Now married0.6% Separated0.0% Widowed3.1% DivorcedFemales 31.7% Never married53.0% Now married3.6% Separated1.4% Widowed10.3% DivorcedWomen who gave birth in the past 12 months Now married:
13.9% (29)Unmarried:
86.1% (181)
Women who did not give birth in the past 12 months Now married:
62.4% (834)Unmarried:
37.6% (501)
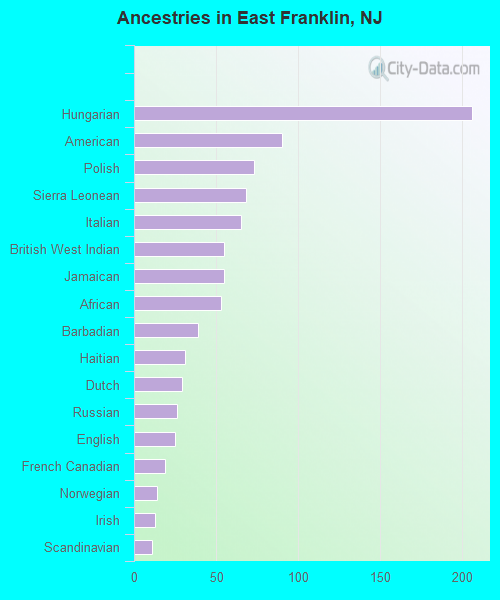
Ancestries in East Franklin
206 2.9% Hungarian90 1.3% American73 1.0% Polish68 1.0% Sierra Leonean65 0.9% Italian55 0.8% British West Indian55 0.8% Jamaican53 0.8% African39 0.6% Barbadian31 0.4% Haitian29 0.4% Dutch26 0.4% Russian25 0.4% English19 0.3% French Canadian14 0.2% Norwegian13 0.2% Irish11 0.2% Scandinavian
Children Nativity (place of birth) in East Franklin
Children under 6 years - Living with two parents Both parents native 145 100.0% NativeBoth parents foreign-born 309 100.0% NativeOne native, one foreign-born parent 57 100.0% NativeChildren under 6 years - Living with one parent Foreign-born parent 524 100.0% NativeChildren 6 to 17 years - Living with two parents Both parents native 158 100.0% NativeBoth parents foreign-born 470 74.7% Native159 25.3% Foreign-bornOne native, one foreign-born parent 80 100.0% NativeChildren 6 to 17 years - Living with one parent Foreign-born parent 830 65.9% Native429 34.1% Foreign-born
Grandparents responsible for own grandchildren in East Franklin
Grandparents (30 to 59 years) Black or African American 22 100.0% Not responsible for grandchildrenOther race 187 100.0% Not responsible for grandchildrenTwo or more races 26 100.0% Not responsible for grandchildrenHispanic or Latino 167 100.0% Not responsible for grandchildren
Grandparents (60 years and over) Black or African American 71 100.0% Not responsible for grandchildren