Races in East Garden City, New York (NY) Detailed Stats
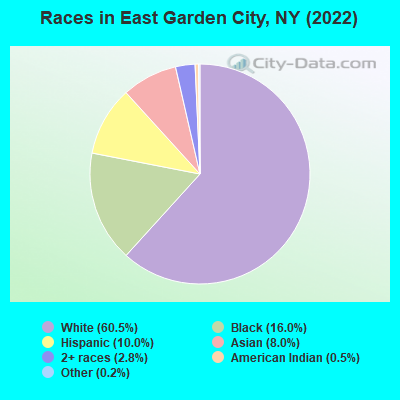
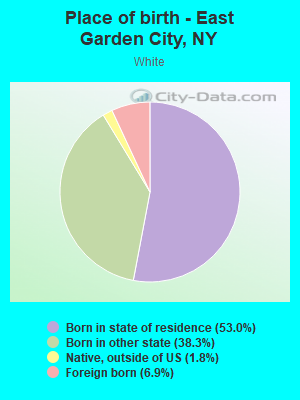
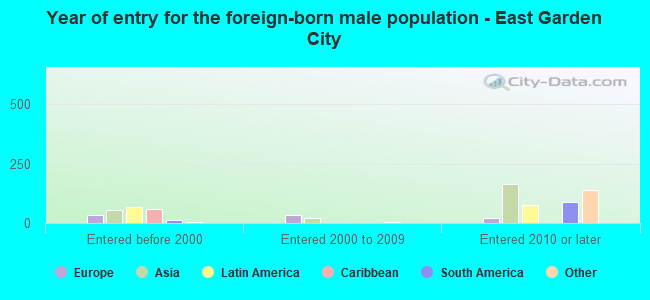
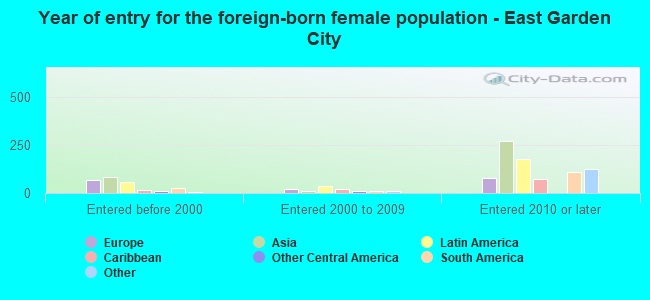
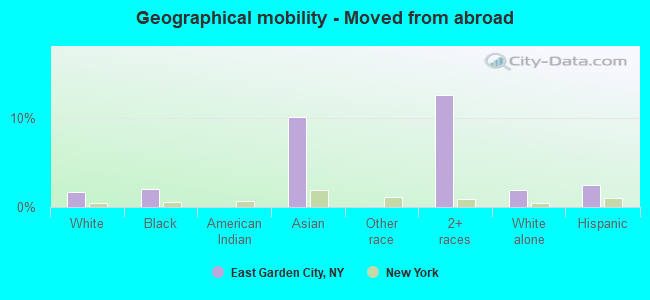
According to 2022 data, the most numerous races in East Garden City, NY are White alone (4,000 residents), Hispanic (660 residents), and Black alone (1,056 residents). 79.2% of East Garden City residents speak English at home. 14.1% of East Garden City, NY residents are foreign-born (4.8% born in Asia, 3.8% born in Latin America, 3.5% born in Europe), which is 55.8% less than the foreign-born rate of 22.0% across the entire state of New York.
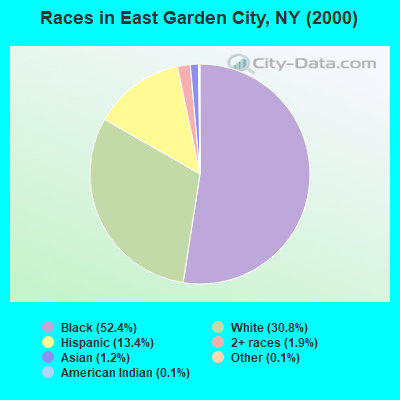
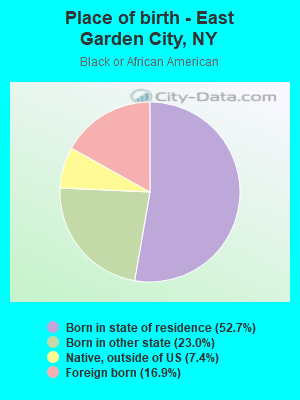
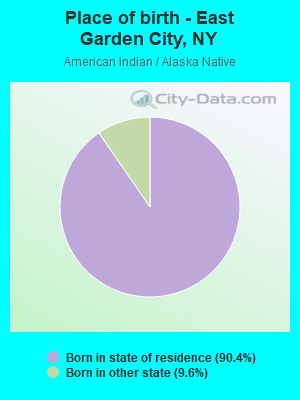
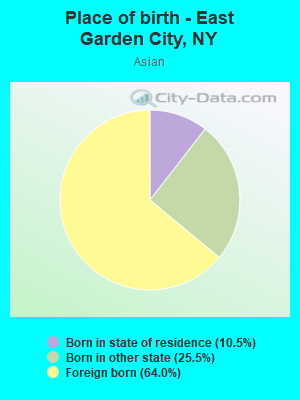
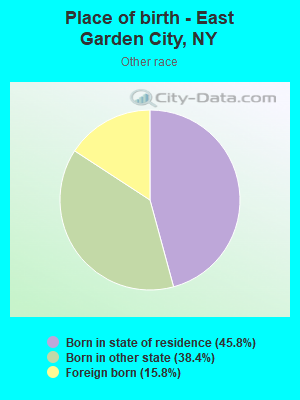
Race distribution in East Garden City
2000 2022
11,760,981 62.0% White alone 2,867,583 15.1% Hispanic 2,812,623 14.8% Black alone 1,035,926 5.5% Asian alone 366,116 1.9% Two or more races 75,499 0.4% Other race alone 52,499 0.3% American Indian alone 5,230 0.03% Native Hawaiian and Other
10,408,933 52.9% White alone 3,867,299 19.7% Hispanic 2,633,840 13.4% Black alone 1,776,286 9.0% Asian alone 732,670 3.7% Two or more races 216,110 1.1% Other race alone 35,082 0.2% American Indian alone 6,931 0.04% Native Hawaiian and Other
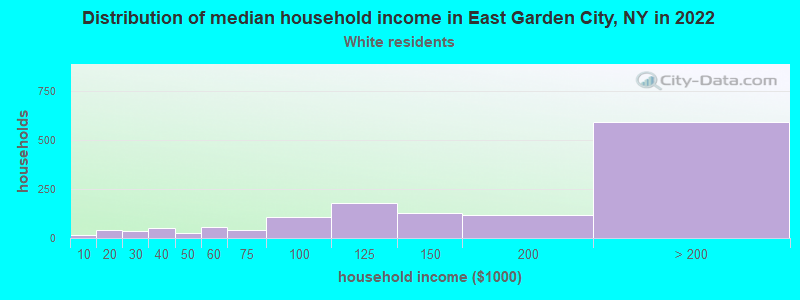
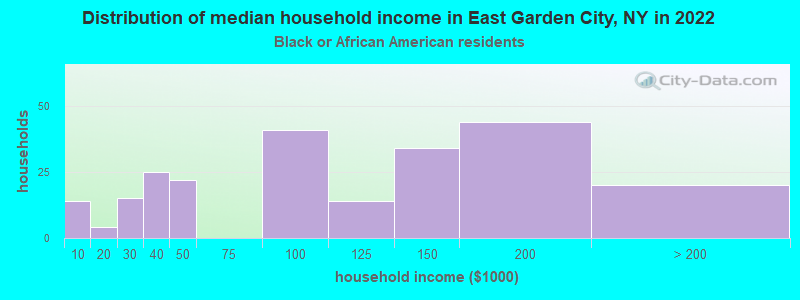
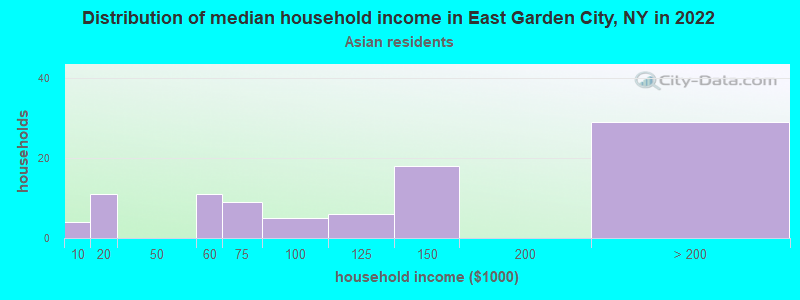
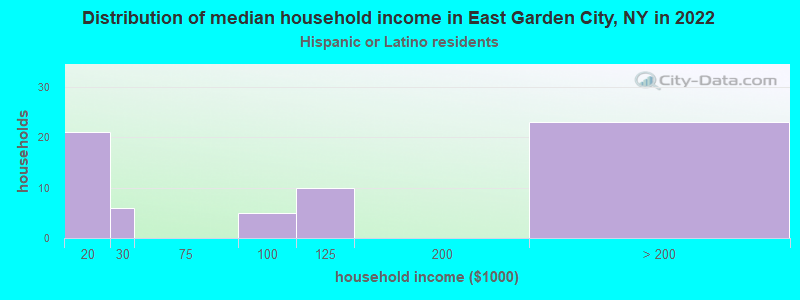
Income and house value in East Garden City Median household income in 2022 $153,088 White non-Hispanic householders$52,628 Black householders$107,155 Asian householdersover $200,000 Some other race householders$108,609 Two or more races householders$42,089 Hispanic or Latino race householdersMedian 2022 house value $486,725 White Non-Hispanic householders$453,478 Black or African American householders$481,820 Hispanic or Latino householders
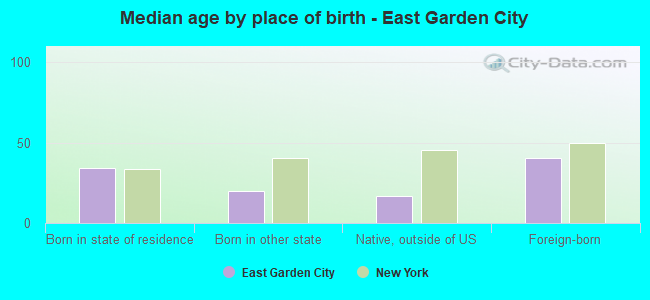
Median age by race in East Garden City
23.4 Median age for White residents24.3 22.7 24.2 Median age for Black or African American residents26.9 23.5 29.1 Median age for American Indian / Alaska Native residents24.8 Median age for Asian residents27.2 24.1 23.5 Median age for Other race residents22.8 24.5 26.6 Median age for Two or more races residents28.8 24.4 23.6 Median age for White alone residents24.7 22.6 23.0 Median age for Hispanic or Latino residents21.6 23.2
Owner/renter occupied households by race in East Garden City
House owners and renters - White residents 748 66.7% Owner occupied373 33.3% Renter occupiedHouse owners and renters - Black or African American residents 92 42.7% Owner occupied124 57.3% Renter occupiedHouse owners and renters - Asian residents 42 46.9% Owner occupied48 53.1% Renter occupiedHouse owners and renters - Other race residents 14 100.0% Renter occupiedHouse owners and renters - Two or more races residents 26 100.0% Renter occupiedHouse owners and renters - White alone residents 743 65.7% Owner occupied387 34.3% Renter occupiedHouse owners and renters - Hispanic or Latino residents 20 38.9% Owner occupied32 61.1% Renter occupied
Language usage in East Garden City
English speakers - Total 79.2% of residents of East Garden City speak English at home.
6.2% of residents speak Spanish at home 304 74.5% Speak English very well104 25.5% Speak English less than very well14.7% of residents speak other language at home 724 75.2% Speak English very well239 24.8% Speak English less than very well
English speakers - Born in the United States 86.4% of residents of East Garden City speak English at home.
7.8% of residents speak Spanish at home 130 73.9% Speak English very well46 26.1% Speak English less than very well5.9% of residents speak other language at home 119 89.5% Speak English very well14 10.5% Speak English less than very well
English speakers - Native, born elsewhere 62.7% of residents of East Garden City speak English at home.
19.6% of residents speak Spanish at home 31 100.0% Speak English very well35.4% of residents speak other language at home 56 100.0% Speak English very well
English speakers - Foreign-born 40.2% of residents of East Garden City speak English at home.
5.8% of residents speak Spanish at home 20 37.0% Speak English very well34 63.0% Speak English less than very well55.6% of residents speak other language at home 316 61.5% Speak English very well198 38.5% Speak English less than very well
White (Caucasian) - Speak only English Native:
91.4% (3,555)Foreign-born:
41.7% (125)
White (Caucasian) - Speak another language Native:
8.8% (341)Foreign-born:
61.4% (184)
Black or African American - Speak only English Native:
89.5% (803)Foreign-born:
80.2% (146)
Black or African American - Speak another language Native:
9.7% (87)Foreign-born:
16.0% (29)
Asian - Speak only English Native:
67.8% (127)Foreign-born:
30.2% (104)
Asian - Speak another language Native:
36.5% (69)Foreign-born:
73.6% (252)
Other race - Speak another language Native:
77.3% (124)Foreign-born:
98.1% (29)
Two or more races - Speak another language Native:
41.8% (202)Foreign-born:
100.0% (24)
White alone - Speak only English Native:
93.0% (3,437)Foreign-born:
36.4% (114)
White alone - Speak another language Native:
7.0% (259)Foreign-born:
63.9% (200)
Hispanic or Latino - Speak only English Native:
46.5% (268)Foreign-born:
32.4% (25)
Hispanic or Latino - Speak another language Native:
55.2% (318)Foreign-born:
73.8% (56)
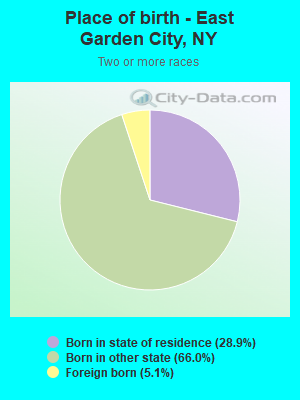
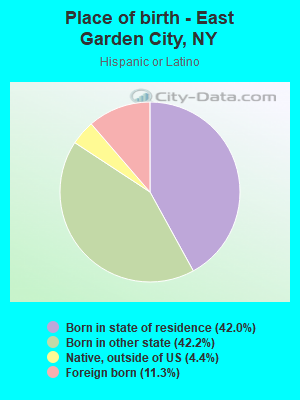
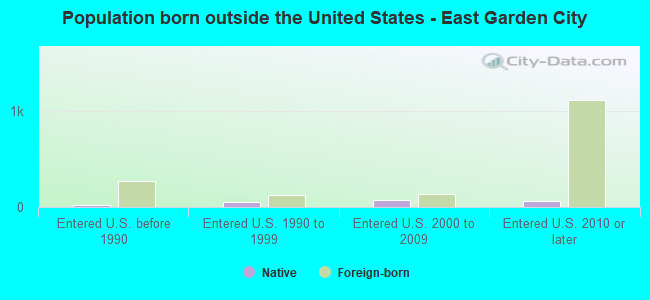
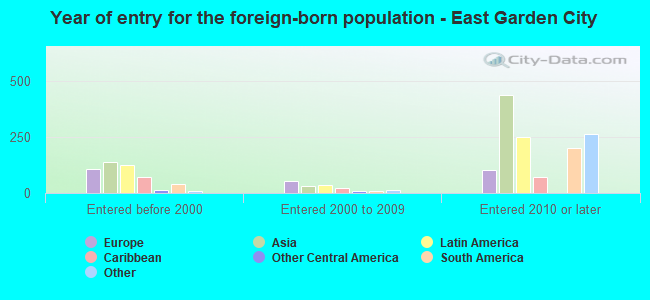
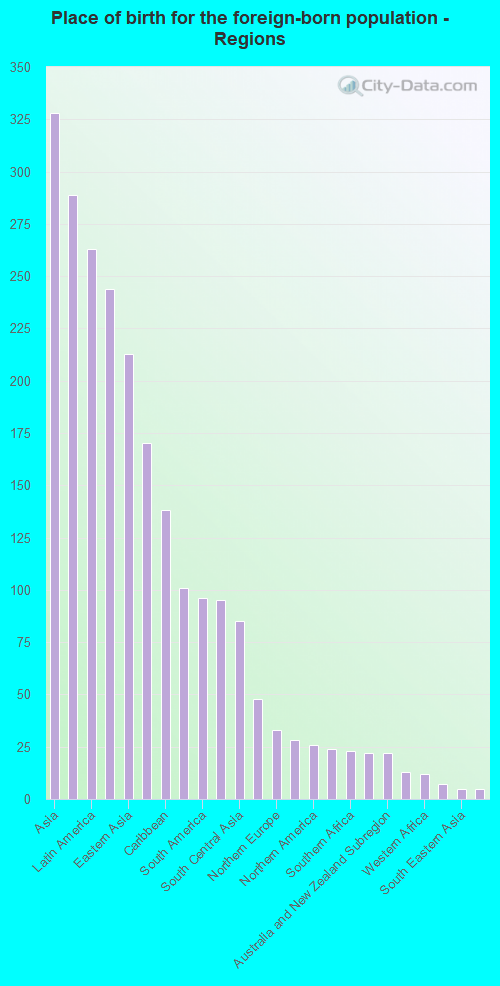
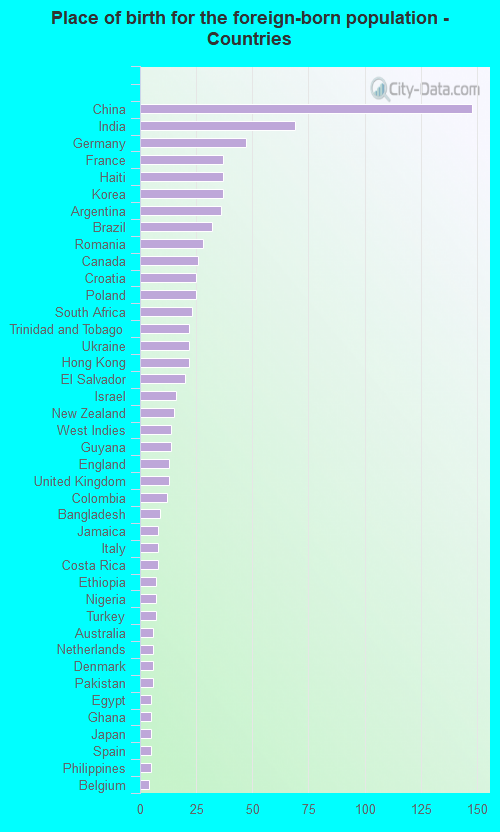
Foreign-born residents in East Garden City 933 residents are foreign born (4.8% Asia , 3.8% Latin America , 3.5% Europe ).
This city:
14.1%New York:
100.0%
Marital status for residents in East Garden City Marital status - White (Caucasian) population 15 years and over
Males 61.5% Never married30.2% Now married1.6% Separated2.6% Widowed4.1% DivorcedFemales 59.3% Never married22.8% Now married0.5% Separated11.4% Widowed6.0% DivorcedWomen who gave birth in the past 12 months Now married:
100.0% (9)Unmarried:
0.0% (0)
Women who did not give birth in the past 12 months Now married:
7.2% (100)Unmarried:
92.8% (1,291)
Marital status - Black or African American population 15 years and over
Males 65.5% Never married28.8% Now married2.7% Separated1.9% Widowed1.1% DivorcedFemales 72.3% Never married16.2% Now married3.2% Separated7.1% Widowed1.2% DivorcedWomen who gave birth in the past 12 months Now married:
100.0% (12)Unmarried:
0.0% (0)
Women who did not give birth in the past 12 months Now married:
13.9% (51)Unmarried:
86.1% (316)
Marital status - Asian population 15 years and over
Males 62.8% Never married34.6% Now married0.0% Separated0.0% Widowed2.7% DivorcedFemales 70.4% Never married29.6% Now married0.0% Separated0.0% Widowed0.0% DivorcedWomen who did not give birth in the past 12 months Now married:
15.0% (31)Unmarried:
85.0% (178)
Marital status - Other race population 15 years and over
Males 80.3% Never married19.7% Now married0.0% Separated0.0% Widowed0.0% DivorcedFemales 75.0% Never married15.0% Now married0.0% Separated10.0% Widowed0.0% DivorcedWomen who did not give birth in the past 12 months Now married:
0.0% (0)Unmarried:
100.0% (65)
Marital status - Two or more races population 15 years and over
Males 100.0% Never married0.0% Now married0.0% Separated0.0% Widowed0.0% DivorcedFemales 91.7% Never married8.3% Now married0.0% Separated0.0% Widowed0.0% DivorcedWomen who did not give birth in the past 12 months Now married:
8.3% (22)Unmarried:
91.7% (246)
Marital status - White alone, not Hispanic / Latino population 15 years and over
Males 59.7% Never married31.5% Now married1.7% Separated2.8% Widowed4.4% DivorcedFemales 58.4% Never married23.2% Now married0.5% Separated11.9% Widowed6.1% DivorcedWomen who gave birth in the past 12 months Now married:
100.0% (10)Unmarried:
0.0% (0)
Women who did not give birth in the past 12 months Now married:
5.8% (75)Unmarried:
94.2% (1,221)
Marital status - Hispanic or Latino population 15 years and over
Males 90.1% Never married9.9% Now married0.0% Separated0.0% Widowed0.0% DivorcedFemales 72.1% Never married18.1% Now married0.0% Separated6.2% Widowed3.6% DivorcedWomen who did not give birth in the past 12 months Now married:
15.2% (44)Unmarried:
84.8% (244)
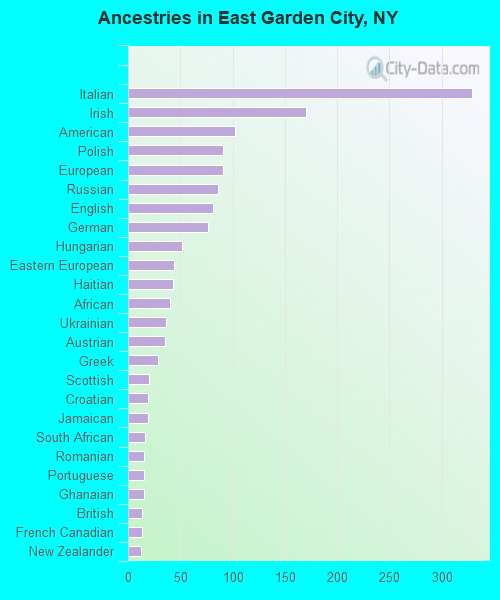
Ancestries in East Garden City
329 11.0% Italian170 5.7% Irish102 3.4% American91 3.1% Polish91 3.1% European86 2.9% Russian81 2.7% English77 2.6% German52 1.7% Hungarian44 1.5% Eastern European43 1.4% Haitian40 1.3% African36 1.2% Ukrainian35 1.2% Austrian29 1.0% Greek20 0.7% Scottish19 0.6% Croatian19 0.6% Jamaican16 0.5% South African15 0.5% Romanian15 0.5% Portuguese15 0.5% Ghanaian13 0.4% British13 0.4% French Canadian12 0.4% New Zealander12 0.4% Danish12 0.4% Guyanese12 0.4% Lithuanian11 0.4% Maltese10 0.3% Swedish10 0.3% Nigerian9 0.3% Ethiopian8 0.3% Israeli7 0.2% Turkish6 0.2% Egyptian5 0.2% Australian5 0.2% Trinidadian and Tobagonian4 0.1% Brazilian4 0.1% Dutch4 0.1% Canadian3 0.1% Norwegian2 0.07% Belgian
Children Nativity (place of birth) in East Garden City
Children under 6 years - Living with two parents Both parents native 61 100.0% NativeBoth parents foreign-born 5 100.0% NativeChildren 6 to 17 years - Living with two parents Both parents native 73 100.0% NativeBoth parents foreign-born 14 100.0% NativeOne native, one foreign-born parent 21 100.0% NativeChildren 6 to 17 years - Living with one parent Native parent 32 100.0% NativeForeign-born parent 28 60.3% Native19 39.7% Foreign-born
Grandparents responsible for own grandchildren in East Garden City
Grandparents (30 to 59 years) Asian 9 100.0% Not responsible for grandchildren
Grandparents (60 years and over)