Races in East Grand Rapids, Michigan (MI) Detailed Stats
Ancestries, Foreign-born residents, place of birth
Settings
X


Recent posts about races in East Grand Rapids, Michigan on our local forum with over 2,400,000 registered users:
 | Possible to move to East Grand Rapids (3 replies) |
| Rental home in east Grand Rapids or forest hills? (4 replies) |
| Relocating to Grand Rapids from CA - Need neighborhood recommendations! (23 replies) |
| Why Didn't Grand Rapids Decline? (74 replies) |
| Now considering Grand Rapids (7 replies) |
| Help with Neighborhoods in Grand Rapids (4 replies) |
According to 2022 data, the most numerous races in East Grand Rapids, MI are White alone (10,413 residents), Black alone (112 residents), and Hispanic (196 residents). 96.2% of East Grand Rapids residents speak English at home. 4.3% of East Grand Rapids, MI residents are foreign-born (1.4% born in Europe, 1.0% born in Latin America, 0.8% born in North America, 0.6% born in Asia, 0.6% born in Africa), which is 39.2% less than the foreign-born rate of 6.0% across the entire state of Michigan.
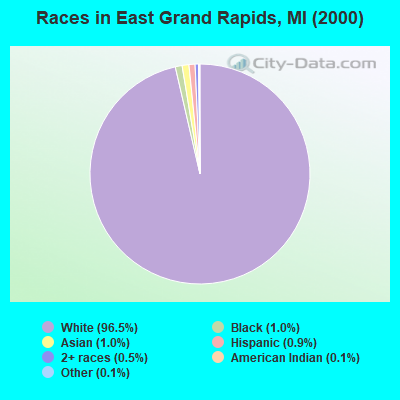
Race distribution in East Grand Rapids
2000
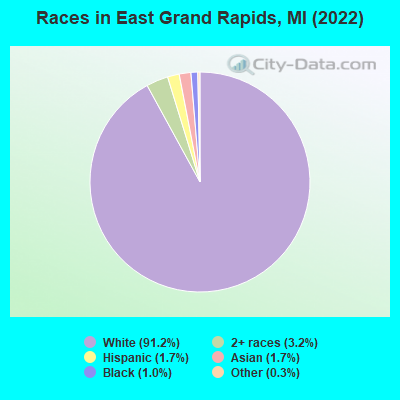
2022

- 10,38496.5%White alone
- 1051.0%Black alone
- 1031.0%Asian alone
- 920.9%Hispanic
- 560.5%Two or more races
- 110.1%Other race alone
- 130.1%American Indian alone
-
- 10,41391.2%White alone
- 3633.2%Two or more races
- 1961.7%Hispanic
- 1911.7%Asian alone
- 1121.0%Black alone
- 340.3%Other race alone
- 30.03%American Indian alone
2000
2022
-
- 7,806,69178.6%White alone
- 1,402,04714.1%Black alone
- 323,8773.3%Hispanic
- 175,3111.8%Asian alone
- 163,4871.6%Two or more races
- 53,4210.5%American Indian alone
- 11,4650.1%Other race alone
- 2,1450.02%Native Hawaiian and Other
Pacific Islander alone

-
- 7,289,05172.6%White alone
- 1,310,46413.1%Black alone
- 572,4055.7%Hispanic
- 450,0314.5%Two or more races
- 335,7323.3%Asian alone
- 45,2170.5%Other race alone
- 29,0110.3%American Indian alone
- 2,2070.02%Native Hawaiian and Other
Pacific Islander alone

Income and house value in East Grand Rapids
- Median household income in 2022
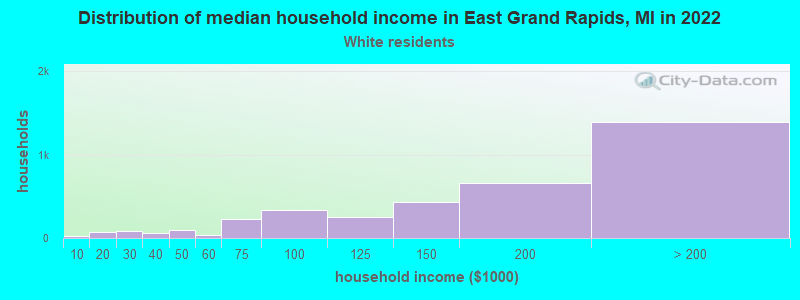
- $162,766White non-Hispanic householders
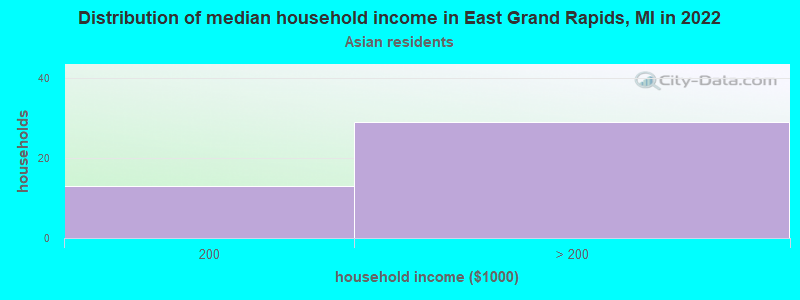
- over $200,000Asian householders
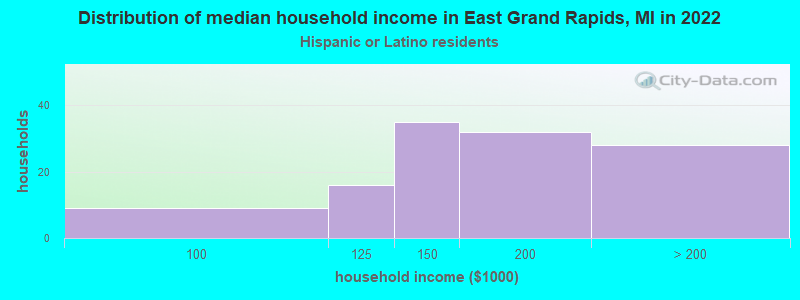
- $150,185Hispanic or Latino race householders
- Median 2022 house value
- $536,320White Non-Hispanic householders
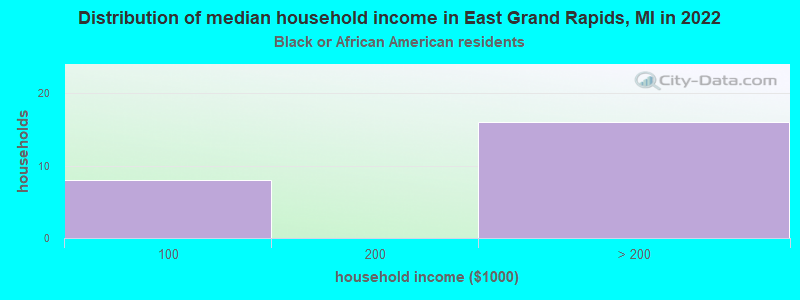
- $485,562Black or African American householders
- $356,079American Indian or Alaska Native householders
- $264,405Asian householders
- $434,805Hispanic or Latino householders
Household income for White non-Hispanic householders
Household income for Black householders
Household income for Asian householders
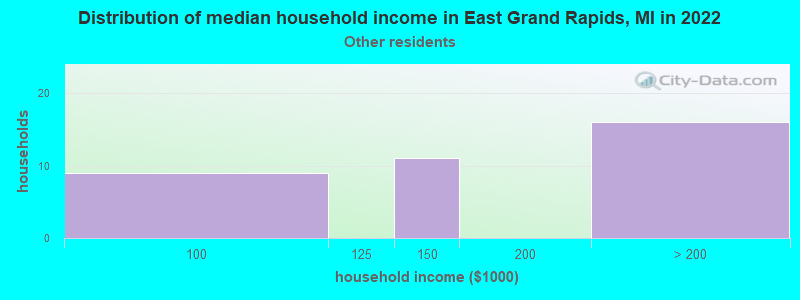
Household income for Some other race householders
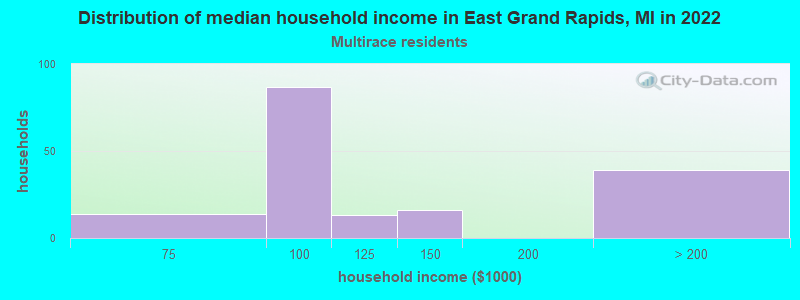
Household income for Two or more races householders
Household income for Hispanic or Latino race householders
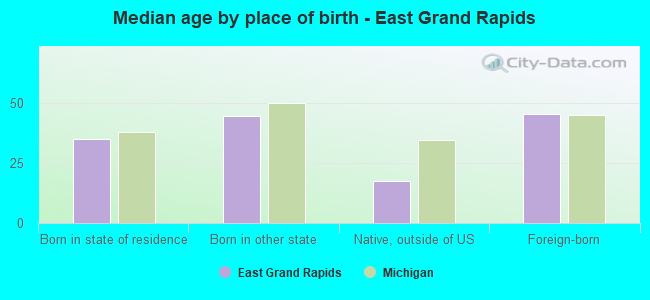
Median age by race in East Grand Rapids
- 39.0Median age for White residents
- 37.3Males
- 40.5Females
- 35.0Median age for Black or African American residents
- 36.3Males
- 9.4Females
- -697,722,566.6Median age for American Indian / Alaska Native residents
- -697,626,418.3Males
- -677,018,632.9Females
- 17.3Median age for Asian residents
- 47.9Males
- 14.8Females
- -670,531,400.3Median age for Native Hawaiian / Pacific Islander residents
- -674,772,035.8Males
- -699,588,476.7Females
- 36.8Median age for Other race residents
- 16.3Males
- -690,058,478.8Females
- 16.8Median age for Two or more races residents
- 15.7Males
- 19.4Females
- 38.6Median age for White alone residents
- 37.1Males
- 40.1Females
- 38.9Median age for Hispanic or Latino residents
- 19.2Males
- 53.6Females
Owner/renter occupied households by race in East Grand Rapids
- House owners and renters - White residents
- 3,37595.1%Owner occupied
- 1744.9%Renter occupied
- House owners and renters - Black or African American residents
- 24100.0%Owner occupied
- House owners and renters - Asian residents
- 45100.0%Owner occupied
- House owners and renters - Other race residents
- 24100.0%Owner occupied
- House owners and renters - Two or more races residents
- 9471.3%Owner occupied
- 3828.7%Renter occupied
- House owners and renters - White alone residents
- 3,33395.0%Owner occupied
- 1745.0%Renter occupied
- House owners and renters - Hispanic or Latino residents
- 114100.0%Owner occupied
Language usage in East Grand Rapids
- English speakers - Total
- 96.2% of residents of East Grand Rapids speak English at home.
- 0.9% of residents speak Spanish at home
- 90100.0%Speak English very well
- 2.3% of residents speak other language at home
- 20185.5%Speak English very well
- 3414.5%Speak English less than very well
All residents speak only English at home
All residents speak only English at home
- English speakers - Foreign-born
- 68.6% of residents of East Grand Rapids speak English at home.
- 5.7% of residents speak Spanish at home
- 29100.0%Speak English very well
- 18.6% of residents speak other language at home
- 6164.9%Speak English very well
- 3335.1%Speak English less than very well
White (Caucasian) - Speak only English
| Native: | 98.4% (9,082) |
| Foreign-born: | 78.5% (217) |
White (Caucasian) - Speak another language
| Native: | 1.7% (156) |
| Foreign-born: | 24.2% (67) |
Black or African American - Speak another language
| Native: | 25.8% (23) |
| Foreign-born: | 100.0% (7) |
Asian - Speak only English
| Native: | 88.6% (33) |
| Foreign-born: | 91.9% (140) |
Asian - Speak another language
| Native: | 10.9% (4) |
| Foreign-born: | 8.6% (13) |
Other race - Speak only English
| Native: | 100.0% (43) |
| Foreign-born: | 56.4% (5) |
White alone - Speak only English
| Native: | 97.9% (9,020) |
| Foreign-born: | 64.7% (206) |
White alone - Speak another language
| Native: | 2.1% (195) |
| Foreign-born: | 26.7% (85) |
Hispanic or Latino - Speak only English
| Native: | 100.0% (124) |
| Foreign-born: | 22.7% (9) |
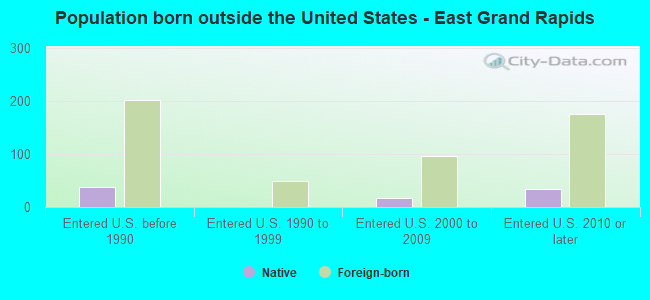
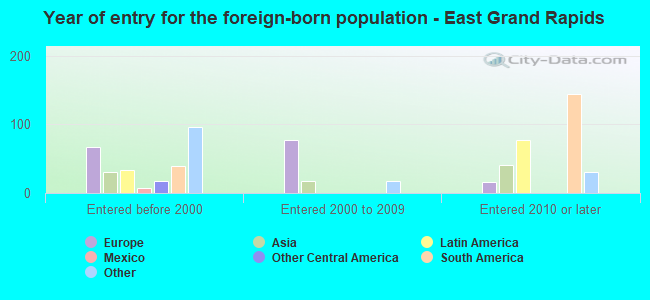
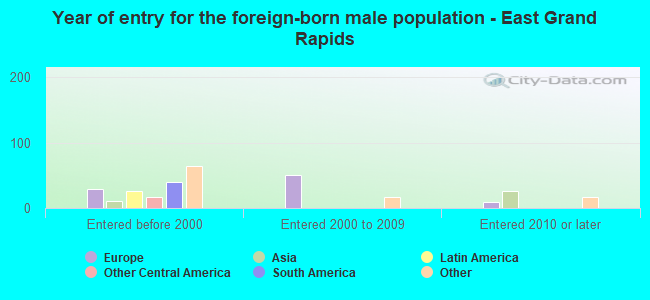
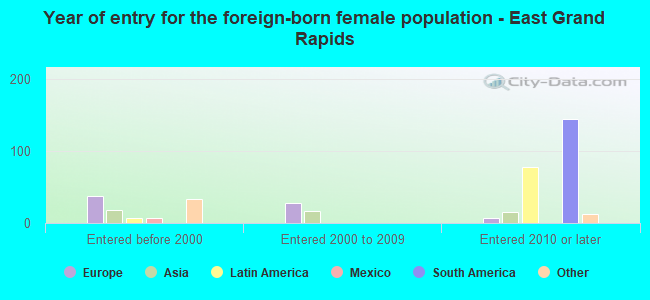
Foreign-born residents in East Grand Rapids
492 residents are foreign born (1.4% Europe, 1.0% Latin America, 0.8% North America, 0.6% Asia, 0.6% Africa).
| This city: | 4.3% |
| Michigan: | 6.9% |
Marital status for residents in East Grand Rapids
Marital status - White (Caucasian) population 15 years and over
- Males
- 20.5%Never married
- 73.4%Now married
- 0.0%Separated
- 1.7%Widowed
- 4.4%Divorced
- Females
- 13.6%Never married
- 71.5%Now married
- 1.1%Separated
- 4.1%Widowed
- 9.6%Divorced
Women who gave birth in the past 12 months
| Now married: | 100.0% (192) |
| Unmarried: | 0.0% (0) |
Women who did not give birth in the past 12 months
| Now married: | 71.8% (1,481) |
| Unmarried: | 28.2% (580) |
Marital status - Black or African American population 15 years and over
- Males
- 34.9%Never married
- 65.1%Now married
- 0.0%Separated
- 0.0%Widowed
- 0.0%Divorced
- Females
- 26.3%Never married
- 73.7%Now married
- 0.0%Separated
- 0.0%Widowed
- 0.0%Divorced
Women who did not give birth in the past 12 months
| Now married: | 0.0% (0) |
| Unmarried: | 100.0% (5) |
Marital status - Asian population 15 years and over
- Males
- 0.0%Never married
- 100.0%Now married
- 0.0%Separated
- 0.0%Widowed
- 0.0%Divorced
- Females
- 54.3%Never married
- 17.1%Now married
- 0.0%Separated
- 0.0%Widowed
- 28.6%Divorced
Women who did not give birth in the past 12 months
| Now married: | 17.1% (13) |
| Unmarried: | 82.9% (61) |
Marital status - Other race population 15 years and over
- Males
- 13.2%Never married
- 86.8%Now married
- 0.0%Separated
- 0.0%Widowed
- 0.0%Divorced
- Females
- 0.0%Never married
- 0.0%Now married
- 0.0%Separated
- 0.0%Widowed
- 100.0%Divorced
Women who did not give birth in the past 12 months
| Now married: | 0.0% (0) |
| Unmarried: | 100.0% (6) |
Marital status - Two or more races population 15 years and over
- Males
- 28.8%Never married
- 53.4%Now married
- 0.0%Separated
- 0.0%Widowed
- 17.8%Divorced
- Females
- 21.3%Never married
- 70.5%Now married
- 0.0%Separated
- 0.0%Widowed
- 8.2%Divorced
Women who gave birth in the past 12 months
| Now married: | 100.0% (12) |
| Unmarried: | 0.0% (0) |
Women who did not give birth in the past 12 months
| Now married: | 61.3% (77) |
| Unmarried: | 38.7% (48) |
Marital status - White alone, not Hispanic / Latino population 15 years and over
- Males
- 20.3%Never married
- 73.6%Now married
- 0.0%Separated
- 1.7%Widowed
- 4.4%Divorced
- Females
- 13.9%Never married
- 71.7%Now married
- 1.1%Separated
- 3.5%Widowed
- 9.8%Divorced
Women who gave birth in the past 12 months
| Now married: | 100.0% (194) |
| Unmarried: | 0.0% (0) |
Women who did not give birth in the past 12 months
| Now married: | 71.5% (1,475) |
| Unmarried: | 28.5% (587) |
Marital status - Hispanic or Latino population 15 years and over
- Males
- 39.1%Never married
- 40.6%Now married
- 0.0%Separated
- 0.0%Widowed
- 20.3%Divorced
- Females
- 0.0%Never married
- 55.0%Now married
- 0.0%Separated
- 36.2%Widowed
- 8.8%Divorced
Women who did not give birth in the past 12 months
| Now married: | 77.4% (25) |
| Unmarried: | 22.6% (7) |
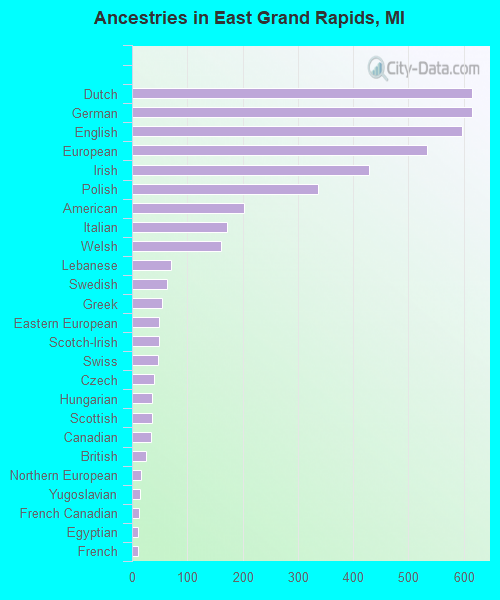
Ancestries in East Grand Rapids

- 61513.1%Dutch
- 61513.1%German
- 59712.7%English
- 53411.4%European
- 4289.1%Irish
- 3367.2%Polish
- 2034.3%American
- 1723.7%Italian
- 1613.4%Welsh
- 701.5%Lebanese
- 631.3%Swedish
- 541.2%Greek
- 491.0%Eastern European
- 491.0%Scotch-Irish
- 471.0%Swiss
- 390.8%Czech
- 370.8%Hungarian
- 370.8%Scottish
- 340.7%Canadian
- 250.5%British
- 160.3%Northern European
- 150.3%Yugoslavian
- 130.3%French Canadian
- 100.2%Egyptian
- 100.2%French
- 100.2%Ukrainian
- 90.2%Ethiopian
- 70.1%Belgian
- 20.04%Brazilian
- 10.02%Norwegian
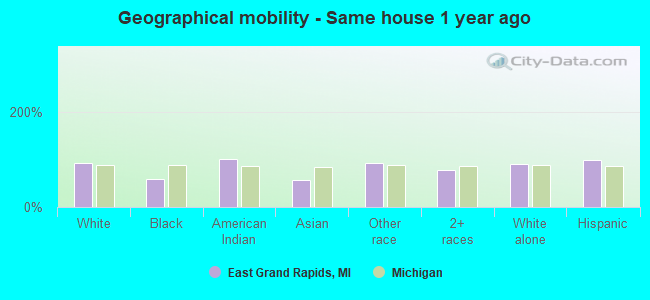
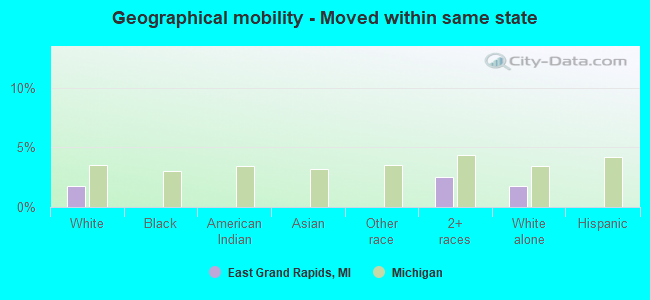
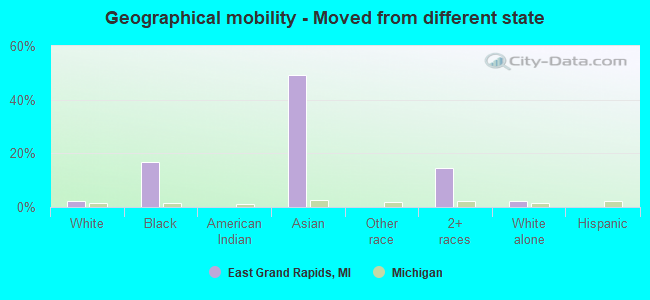
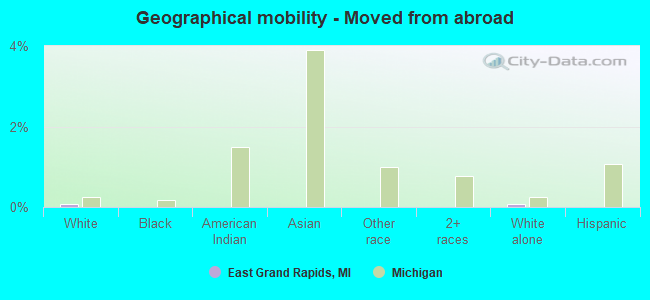
Geographical mobility in East Grand Rapids

- Same house 1 year ago
- 9,37791.6%White (Caucasian)
- 6658.8%Black or African American
- 5100.0%American Indian / Alaska Native
- 10556.2%Asian
- 5493.4%Other race
- 38476.7%Two or more races
- 9,40991.5%White alone, not Hispanic / Latino
- 19699.1%Hispanic or Latino
-
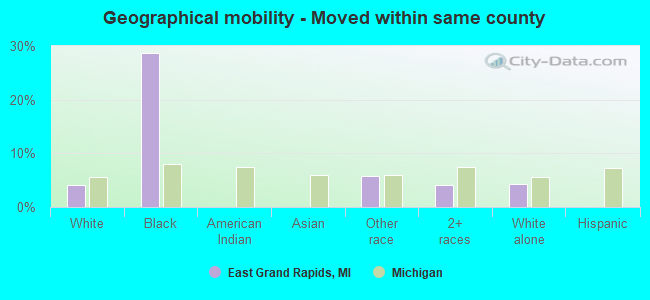
- Moved within same county
- 4244.1%White / Caucasian
- 3228.7%Black or African American
- 35.8%Other race
- 214.1%Two or more races
- 4384.3%White alone, not Hispanic / Latino
-
- Moved within same state
- 1821.8%White / Caucasian
- 132.5%Two or more races
- 1781.7%White alone, not Hispanic / Latino
-
- Moved from different state
- 2312.3%White / Caucasian
- 1916.9%Black or African American
- 9249.1%Asian
- 7214.4%Two or more races
- 2432.4%White alone, not Hispanic / Latino
-
- Moved from abroad
- 80.1%White
- 90.1%White alone, not Hispanic / Latino
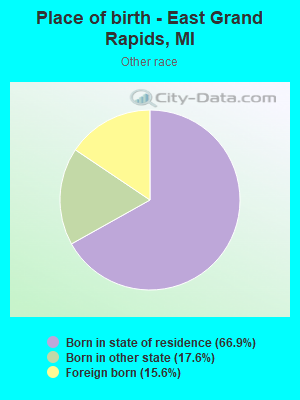
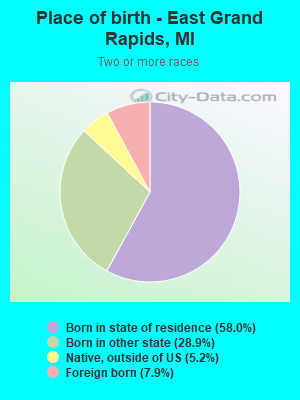
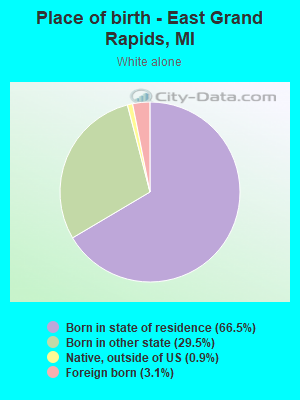
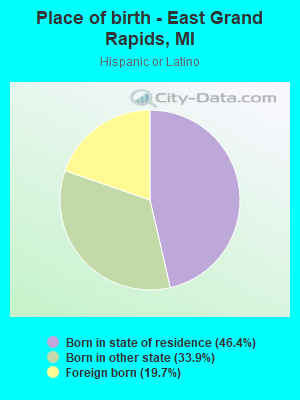
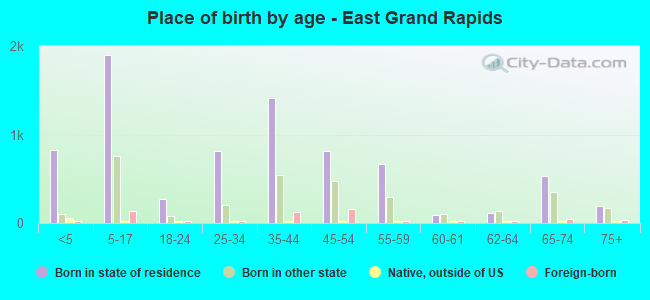
Children Nativity (place of birth) in East Grand Rapids
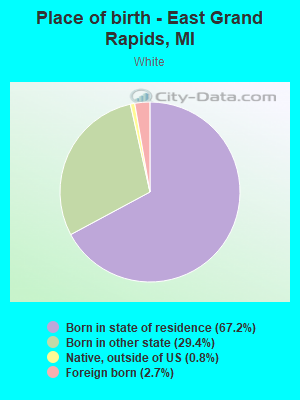
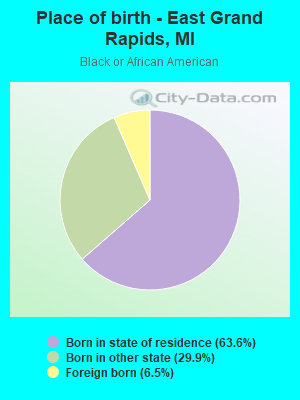
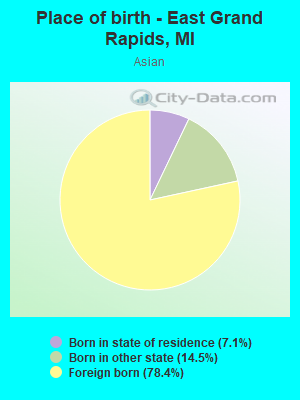
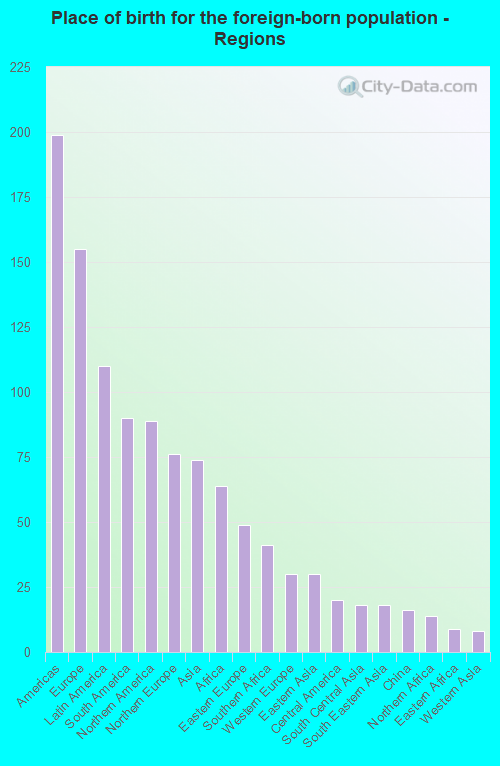
Place of birth for residents in East Grand Rapids
![Place of birth for the foreign-born population - Regions]()
- 199Americas
- 155Europe
- 110Latin America
- 90South America
- 89Northern America
- 76Northern Europe
- 74Asia
- 64Africa
- 49Eastern Europe
- 41Southern Africa
- 30Western Europe
- 30Eastern Asia
- 20Central America
- 18South Central Asia
- 18South Eastern Asia
- 16China
- 14Northern Africa
- 9Eastern Africa
- 8Western Asia
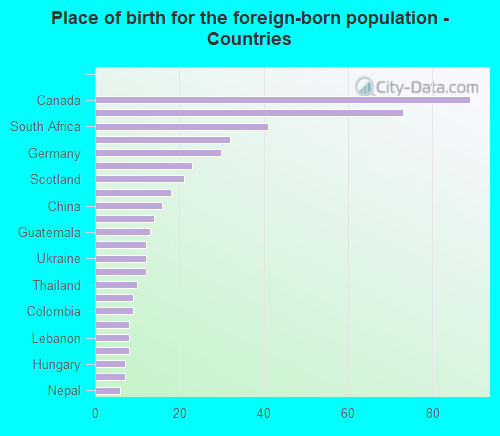
![Place of birth for the foreign-born population - Countries]()
- 89Canada
- 73Guyana
- 41South Africa
- 32England
- 30Germany
- 23United Kingdom
- 21Scotland
- 18Bosnia and Herzegovina
- 16China
- 14Korea
- 13Guatemala
- 12Bulgaria
- 12Ukraine
- 12India
- 10Thailand
- 9Eritrea
- 9Colombia
- 8Philippines
- 8Lebanon
- 8Uruguay
- 7Hungary
- 7Mexico
- 6Nepal
Grandparents responsible for own grandchildren in East Grand Rapids
Zip codes: 49506.