Races in East Lake, Florida (FL) Detailed Stats
Data:
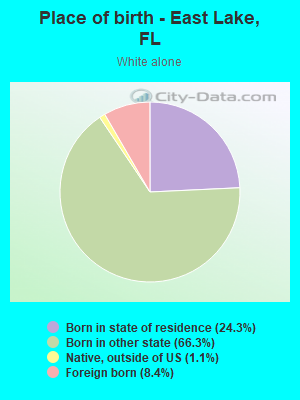
Races - White alone (%)
Races - White alone (% change since 2000)
Races - Black alone (%)
Races - Black alone (% change since 2000)
Races - American Indian alone (%)
Races - American Indian alone (% change since 2000)
Races - Asian alone (%)
Races - Asian alone (% change since 2000)
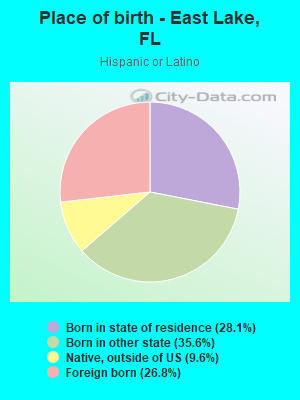
Races - Hispanic (%)
Races - Hispanic (% change since 2000)
Races - Native Hawaiian and Other Pacific Islander alone (%)
Races - Native Hawaiian and Other Pacific Islander alone (% change since 2000)
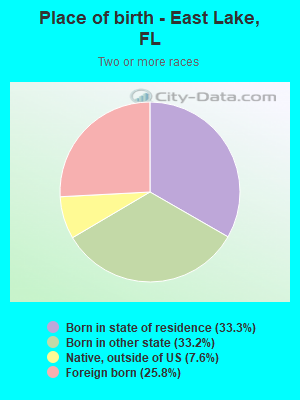
Races - Two or more races(%)
Races - Two or more races(% change since 2000)
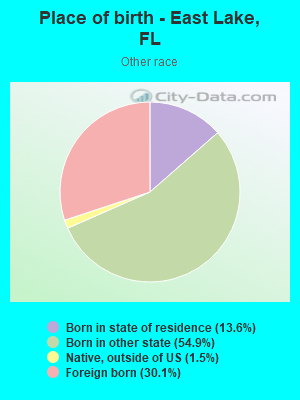
Races - Other race alone (%)
Races - Other race alone (% change since 2000)
Racial diversity
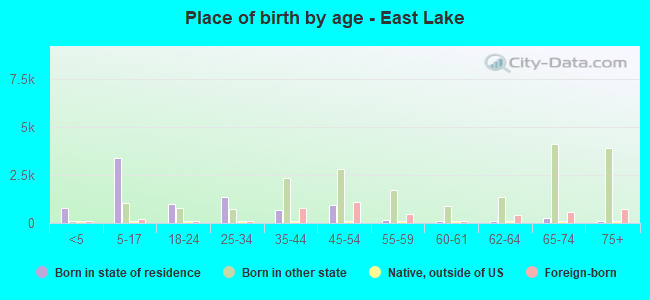
Place of birth - Born in state of residence (%)
Place of birth - Born in state of residence (%) - White
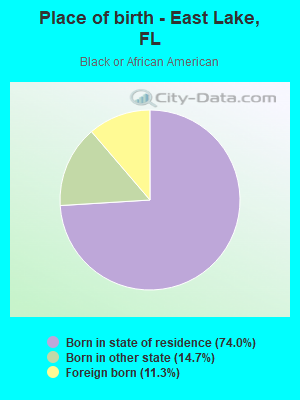
Place of birth - Born in state of residence (%) - Black or African American
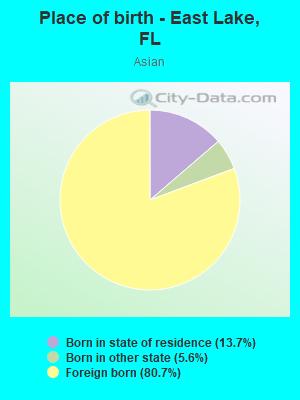
Place of birth - Born in state of residence (%) - Asian
Place of birth - Born in state of residence (%) - Hispanic or Latino
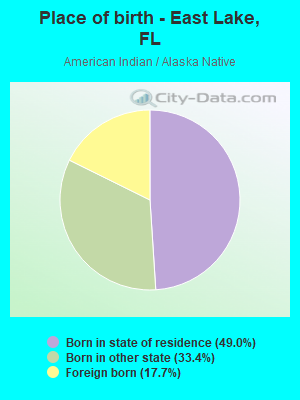
Place of birth - Born in state of residence (%) - American Indian and Alaska Native
Place of birth - Born in state of residence (%) - Multirace
Place of birth - Born in state of residence (%) - Other Race
Place of birth - Born in other state (%)
Place of birth - Born in other state (%) - White
Place of birth - Born in other state (%) - Black or African American
Place of birth - Born in other state (%) - Asian
Place of birth - Born in other state (%) - Hispanic or Latino
Place of birth - Born in other state (%) - American Indian and Alaska Native
Place of birth - Born in other state (%) - Multirace
Place of birth - Born in other state (%) - Other Race
Place of birth - Native, outside of US (%)
Place of birth - Native, outside of US (%) - White
Place of birth - Native, outside of US (%) - Black or African American
Place of birth - Native, outside of US (%) - Asian
Place of birth - Native, outside of US (%) - Hispanic or Latino
Place of birth - Native, outside of US (%) - American Indian and Alaska Native
Place of birth - Native, outside of US (%) - Multirace
Place of birth - Native, outside of US (%) - Other Race
Place of birth - Foreign born (%)
Place of birth - Foreign born (%) - White
Place of birth - Foreign born (%) - Black or African American
Place of birth - Foreign born (%) - Asian
Place of birth - Foreign born (%) - Hispanic or Latino
Place of birth - Foreign born (%) - American Indian and Alaska Native
Place of birth - Foreign born (%) - Multirace
Place of birth - Foreign born (%) - Other Race
Residents speaking English at home (%)
Residents speaking English at home - Born in the United States (%)
Residents speaking English at home - Native, born elsewhere (%)
Residents speaking English at home - Foreign born (%)
Residents speaking Spanish at home (%)
Residents speaking Spanish at home - Born in the United States (%)
Residents speaking Spanish at home - Native, born elsewhere (%)
Residents speaking Spanish at home - Foreign born (%)
Residents speaking other language at home (%)
Residents speaking other language at home - Born in the United States (%)
Residents speaking other language at home - Native, born elsewhere (%)
Residents speaking other language at home - Foreign born (%)
Marital status - Never married (%)
Marital status - Now married (%)
Marital status - Separated (%)
Marital status - Widowed (%)
Marital status - Divorced (%)
Ancestries Reported - Arab (%)
Ancestries Reported - Czech (%)
Ancestries Reported - Danish (%)
Ancestries Reported - Dutch (%)
Ancestries Reported - English (%)
Ancestries Reported - French (%)
Ancestries Reported - French Canadian (%)
Ancestries Reported - German (%)
Ancestries Reported - Greek (%)
Ancestries Reported - Hungarian (%)
Ancestries Reported - Irish (%)
Ancestries Reported - Italian (%)
Ancestries Reported - Lithuanian (%)
Ancestries Reported - Norwegian (%)
Ancestries Reported - Polish (%)
Ancestries Reported - Portuguese (%)
Ancestries Reported - Russian (%)
Ancestries Reported - Scotch-Irish (%)
Ancestries Reported - Scottish (%)
Ancestries Reported - Slovak (%)
Ancestries Reported - Subsaharan African (%)
Ancestries Reported - Swedish (%)
Ancestries Reported - Swiss (%)
Ancestries Reported - Ukrainian (%)
Ancestries Reported - United States (%)
Ancestries Reported - Welsh (%)
Ancestries Reported - West Indian (%)
Ancestries Reported - Other (%)
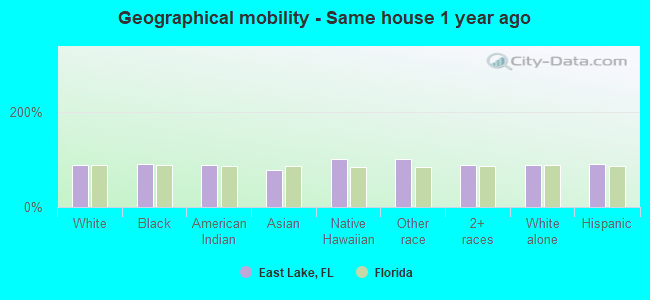
Geographical mobility - Same house 1 year ago (%)
Geographical mobility - Same house 1 year ago (%) - White
Geographical mobility - Same house 1 year ago (%) - Black or African American
Geographical mobility - Same house 1 year ago (%) - Asian
Geographical mobility - Same house 1 year ago (%) - Hispanic or Latino
Geographical mobility - Same house 1 year ago (%) - American Indian and Alaska Native
Geographical mobility - Same house 1 year ago (%) - Multirace
Geographical mobility - Same house 1 year ago (%) - Other Race
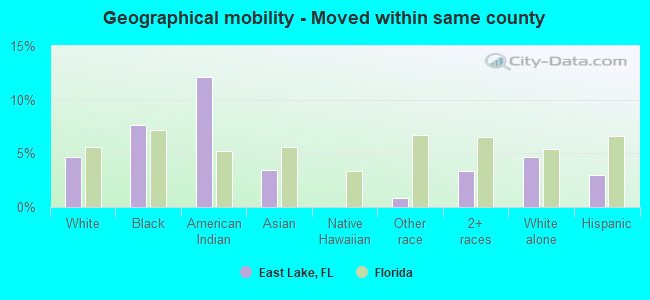
Geographical mobility - Moved within same county (%)
Geographical mobility - Moved within same county (%) - White
Geographical mobility - Moved within same county (%) - Black or African American
Geographical mobility - Moved within same county (%) - Asian
Geographical mobility - Moved within same county (%) - Hispanic or Latino
Geographical mobility - Moved within same county (%) - American Indian and Alaska Native
Geographical mobility - Moved within same county (%) - Multirace
Geographical mobility - Moved within same county (%) - Other Race
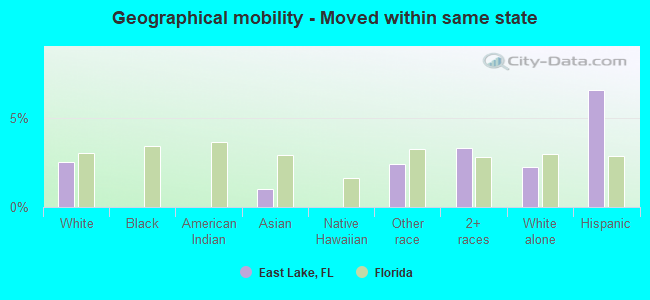
Geographical mobility - Moved from different county within same state (%)
Geographical mobility - Moved from different county within same state (%) - White
Geographical mobility - Moved from different county within same state (%) - Black or African American
Geographical mobility - Moved from different county within same state (%) - Asian
Geographical mobility - Moved from different county within same state (%) - Hispanic or Latino
Geographical mobility - Moved from different county within same state (%) - American Indian and Alaska Native
Geographical mobility - Moved from different county within same state (%) - Multirace
Geographical mobility - Moved from different county within same state (%) - Other Race
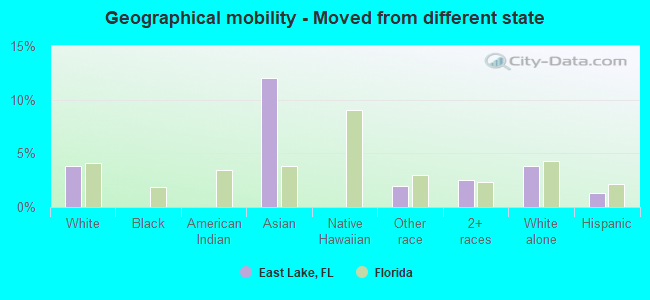
Geographical mobility - Moved from different state (%)
Geographical mobility - Moved from different state (%) - White
Geographical mobility - Moved from different state (%) - Black or African American
Geographical mobility - Moved from different state (%) - Asian
Geographical mobility - Moved from different state (%) - Hispanic or Latino
Geographical mobility - Moved from different state (%) - American Indian and Alaska Native
Geographical mobility - Moved from different state (%) - Multirace
Geographical mobility - Moved from different state (%) - Other Race
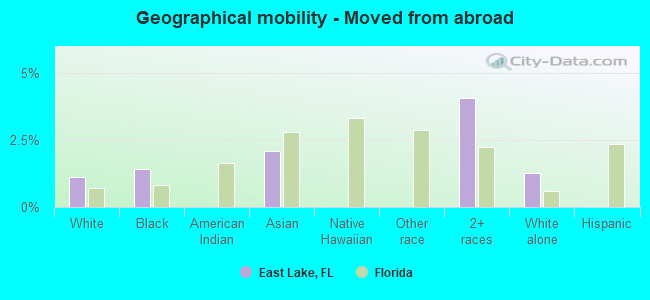
Geographical mobility - Moved from abroad (%)
Geographical mobility - Moved from abroad (%) - White
Geographical mobility - Moved from abroad (%) - Black or African American
Geographical mobility - Moved from abroad (%) - Asian
Geographical mobility - Moved from abroad (%) - Hispanic or Latino
Geographical mobility - Moved from abroad (%) - American Indian and Alaska Native
Geographical mobility - Moved from abroad (%) - Multirace
Geographical mobility - Moved from abroad (%) - Other Race
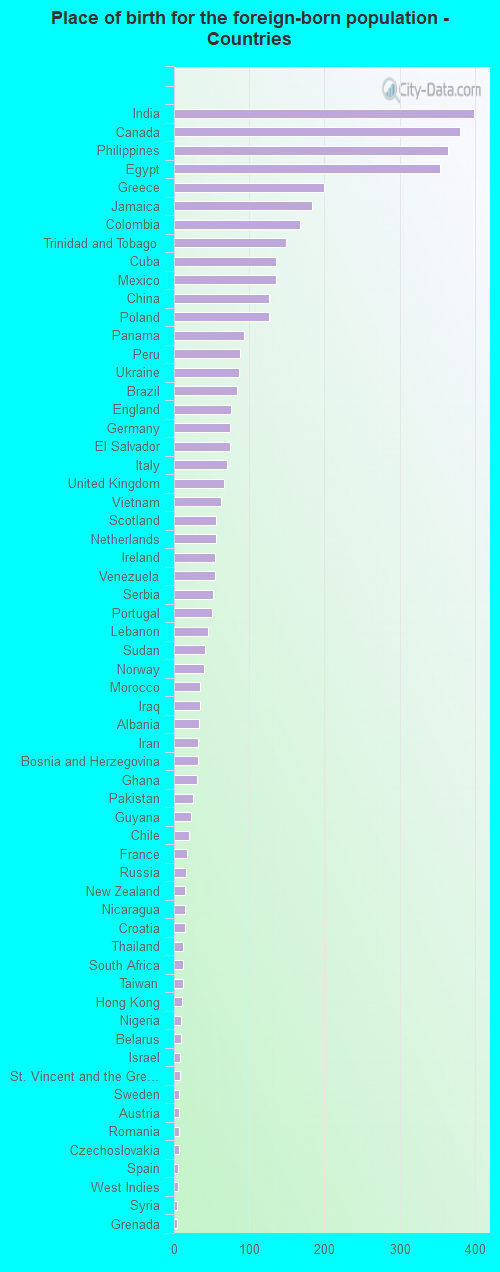
Place of birth for the foreign-born population - Ireland (%)
Place of birth for the foreign-born population - Denmark (%)
Place of birth for the foreign-born population - Norway (%)
Place of birth for the foreign-born population - Sweden (%)
Place of birth for the foreign-born population - United Kingdom (%)
Place of birth for the foreign-born population - England (%)
Place of birth for the foreign-born population - Scotland (%)
Place of birth for the foreign-born population - Other Northern Europe (%)
Place of birth for the foreign-born population - Austria (%)
Place of birth for the foreign-born population - Belgium (%)
Place of birth for the foreign-born population - France (%)
Place of birth for the foreign-born population - Germany (%)
Place of birth for the foreign-born population - Netherlands (%)
Place of birth for the foreign-born population - Switzerland (%)
Place of birth for the foreign-born population - Other Western Europe (%)
Place of birth for the foreign-born population - Greece (%)
Place of birth for the foreign-born population - Italy (%)
Place of birth for the foreign-born population - Portugal (%)
Place of birth for the foreign-born population - Spain (%)
Place of birth for the foreign-born population - Other Southern Europe (%)
Place of birth for the foreign-born population - Albania (%)
Place of birth for the foreign-born population - Belarus (%)
Place of birth for the foreign-born population - Bosnia and Herzegovina (%)
Place of birth for the foreign-born population - Bulgaria (%)
Place of birth for the foreign-born population - Croatia (%)
Place of birth for the foreign-born population - Czechoslovakia (%)
Place of birth for the foreign-born population - Hungary (%)
Place of birth for the foreign-born population - Latvia (%)
Place of birth for the foreign-born population - Lithuania (%)
Place of birth for the foreign-born population - North Macedonia (Macedonia) (%)
Place of birth for the foreign-born population - Moldova (%)
Place of birth for the foreign-born population - Poland (%)
Place of birth for the foreign-born population - Romania (%)
Place of birth for the foreign-born population - Russia (%)
Place of birth for the foreign-born population - Serbia (%)
Place of birth for the foreign-born population - Ukraine (%)
Place of birth for the foreign-born population - Other Eastern Europe (%)
Place of birth for the foreign-born population - China (%)
Place of birth for the foreign-born population - Hong Kong (%)
Place of birth for the foreign-born population - Taiwan (%)
Place of birth for the foreign-born population - Japan (%)
Place of birth for the foreign-born population - Korea (%)
Place of birth for the foreign-born population - Other Eastern Asia (%)
Place of birth for the foreign-born population - Afghanistan (%)
Place of birth for the foreign-born population - Bangladesh (%)
Place of birth for the foreign-born population - India (%)
Place of birth for the foreign-born population - Iran (%)
Place of birth for the foreign-born population - Kazakhstan (%)
Place of birth for the foreign-born population - Nepal (%)
Place of birth for the foreign-born population - Pakistan (%)
Place of birth for the foreign-born population - Sri Lanka (%)
Place of birth for the foreign-born population - Uzbekistan (%)
Place of birth for the foreign-born population - Other South Central Asia (%)
Place of birth for the foreign-born population - Burma (%)
Place of birth for the foreign-born population - Cambodia (%)
Place of birth for the foreign-born population - Indonesia (%)
Place of birth for the foreign-born population - Laos (%)
Place of birth for the foreign-born population - Malaysia (%)
Place of birth for the foreign-born population - Philippines (%)
Place of birth for the foreign-born population - Singapore (%)
Place of birth for the foreign-born population - Thailand (%)
Place of birth for the foreign-born population - Vietnam (%)
Place of birth for the foreign-born population - Other South Eastern Asia (%)
Place of birth for the foreign-born population - Armenia (%)
Place of birth for the foreign-born population - Iraq (%)
Place of birth for the foreign-born population - Israel (%)
Place of birth for the foreign-born population - Jordan (%)
Place of birth for the foreign-born population - Kuwait (%)
Place of birth for the foreign-born population - Lebanon (%)
Place of birth for the foreign-born population - Saudi Arabia (%)
Place of birth for the foreign-born population - Syria (%)
Place of birth for the foreign-born population - Turkey (%)
Place of birth for the foreign-born population - Yemen (%)
Place of birth for the foreign-born population - Other Western Asia (%)
Place of birth for the foreign-born population - Eritrea (%)
Place of birth for the foreign-born population - Ethiopia (%)
Place of birth for the foreign-born population - Kenya (%)
Place of birth for the foreign-born population - Somalia (%)
Place of birth for the foreign-born population - Uganda (%)
Place of birth for the foreign-born population - Zimbabwe (%)
Place of birth for the foreign-born population - Other Eastern Africa (%)
Place of birth for the foreign-born population - Cameroon (%)
Place of birth for the foreign-born population - Congo (%)
Place of birth for the foreign-born population - Democratic Republic of Congo (Zaire) (%)
Place of birth for the foreign-born population - Other Middle Africa (%)
Place of birth for the foreign-born population - Egypt (%)
Place of birth for the foreign-born population - Morocco (%)
Place of birth for the foreign-born population - Sudan (%)
Place of birth for the foreign-born population - Other Northern Africa (%)
Place of birth for the foreign-born population - South Africa (%)
Place of birth for the foreign-born population - Other Southern Africa (%)
Place of birth for the foreign-born population - Cabo Verde (%)
Place of birth for the foreign-born population - Ghana (%)
Place of birth for the foreign-born population - Liberia (%)
Place of birth for the foreign-born population - Nigeria (%)
Place of birth for the foreign-born population - Senegal (%)
Place of birth for the foreign-born population - Sierra Leone (%)
Place of birth for the foreign-born population - Other Western Africa (%)
Place of birth for the foreign-born population - Australia (%)
Place of birth for the foreign-born population - New Zealand (%)
Place of birth for the foreign-born population - Fiji (%)
Place of birth for the foreign-born population - Micronesia (%)
Place of birth for the foreign-born population - Bahamas (%)
Place of birth for the foreign-born population - Barbados (%)
Place of birth for the foreign-born population - Cuba (%)
Place of birth for the foreign-born population - Dominica (%)
Place of birth for the foreign-born population - Dominican Republic (%)
Place of birth for the foreign-born population - Grenada (%)
Place of birth for the foreign-born population - Haiti (%)
Place of birth for the foreign-born population - Jamaica (%)
Place of birth for the foreign-born population - St. Vincent and the Grenadines (%)
Place of birth for the foreign-born population - Trinidad and Tobago (%)
Place of birth for the foreign-born population - West Indies (%)
Place of birth for the foreign-born population - Other Caribbean (%)
Place of birth for the foreign-born population - Belize (%)
Place of birth for the foreign-born population - Costa Rica (%)
Place of birth for the foreign-born population - El Salvador (%)
Place of birth for the foreign-born population - Guatemala (%)
Place of birth for the foreign-born population - Honduras (%)
Place of birth for the foreign-born population - Mexico (%)
Place of birth for the foreign-born population - Nicaragua (%)
Place of birth for the foreign-born population - Panama (%)
Place of birth for the foreign-born population - Other Central America (%)
Place of birth for the foreign-born population - Argentina (%)
Place of birth for the foreign-born population - Bolivia (%)
Place of birth for the foreign-born population - Brazil (%)
Place of birth for the foreign-born population - Chile (%)
Place of birth for the foreign-born population - Colombia (%)
Place of birth for the foreign-born population - Ecuador (%)
Place of birth for the foreign-born population - Guyana (%)
Place of birth for the foreign-born population - Peru (%)
Place of birth for the foreign-born population - Uruguay (%)
Place of birth for the foreign-born population - Venezuela (%)
Place of birth for the foreign-born population - Other South America (%)
Place of birth for the foreign-born population - Canada (%)
Place of birth for the foreign-born population - Other Northern America (%)
Place of birth for the foreign-born population - Other (%)
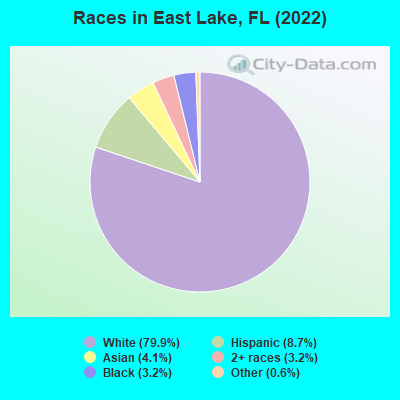
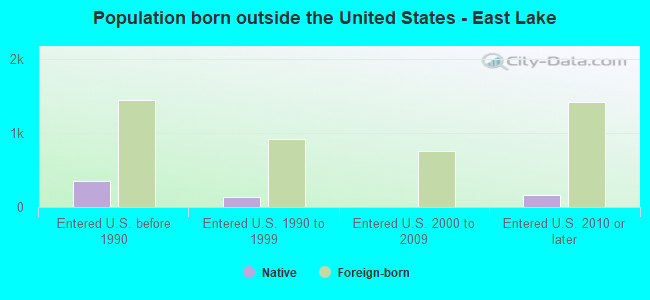
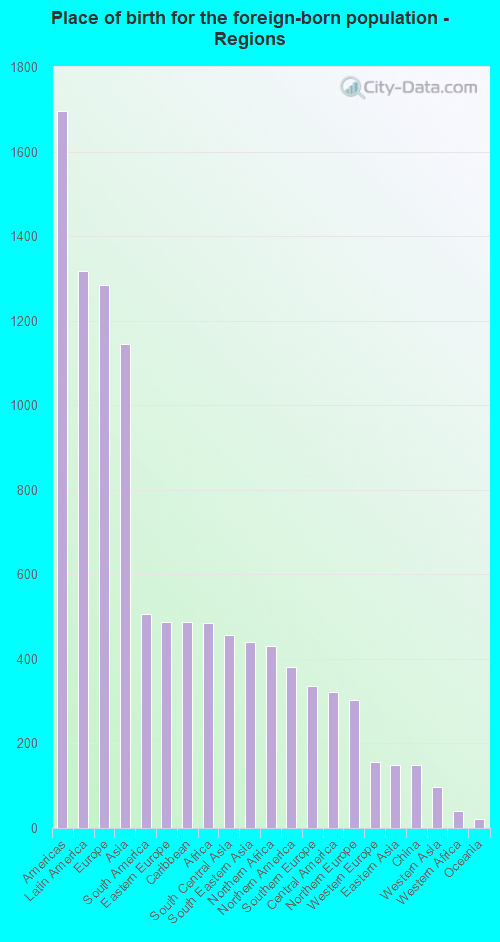
According to 2022 data, the most numerous races in East Lake, FL are White alone (26,936 residents), Hispanic (2,931 residents), and Black alone (1,092 residents). 84.7% of East Lake residents speak English at home. 13.8% of East Lake, FL residents are foreign-born (3.7% born in Latin America, 3.6% born in Europe, 3.2% born in Asia), which is 52.7% less than the foreign-born rate of 21.0% across the entire state of Florida.
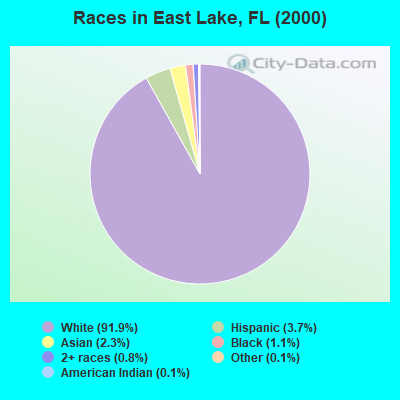
Race distribution in East Lake
2000 2022
10,458,509 65.4% White alone 2,682,715 16.8% Hispanic 2,264,268 14.2% Black alone 261,693 1.6% Asian alone 236,954 1.5% Two or more races 42,358 0.3% American Indian alone 28,994 0.2% Other race alone 6,887 0.04% Native Hawaiian and Other
11,309,403 50.8% White alone 6,025,039 27.1% Hispanic 3,241,015 14.6% Black alone 861,630 3.9% Two or more races 623,692 2.8% Asian alone 152,054 0.7% Other race alone 22,504 0.1% American Indian alone 9,486 0.04% Native Hawaiian and Other
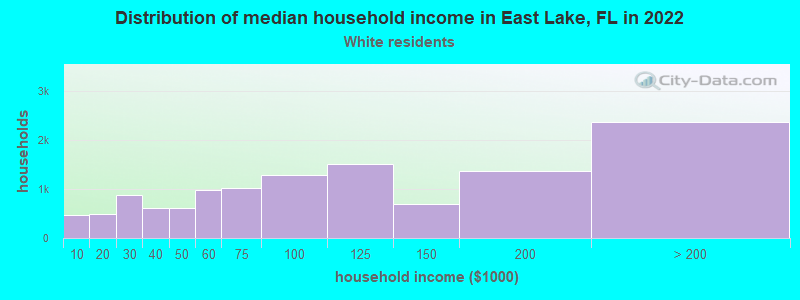
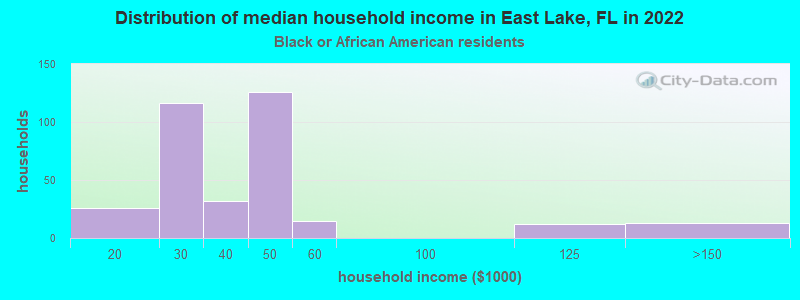
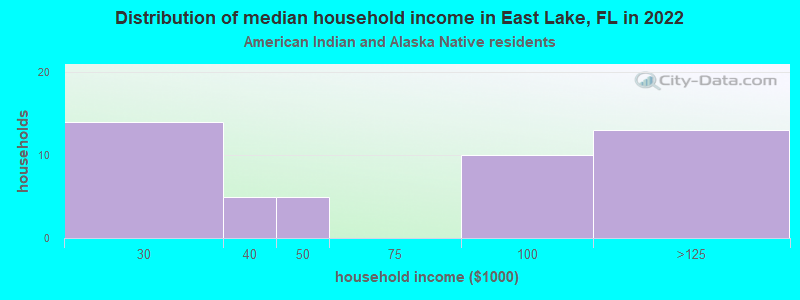
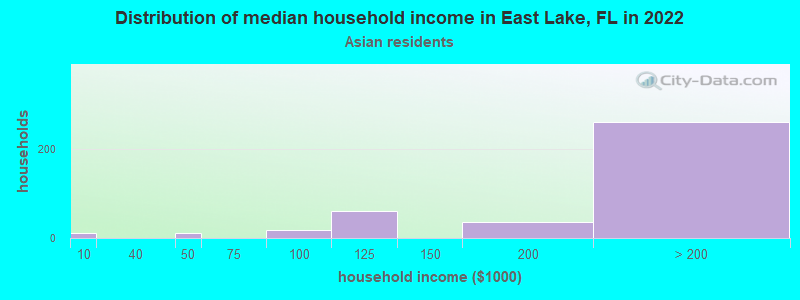
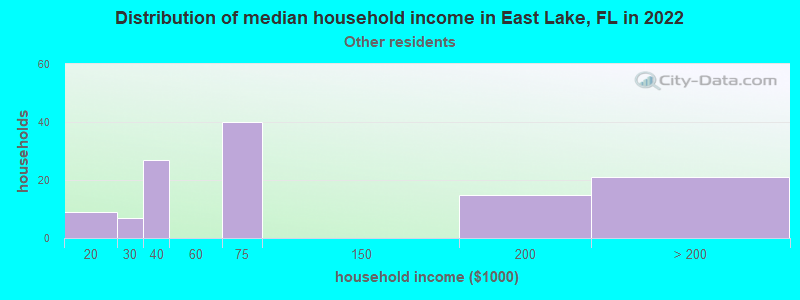
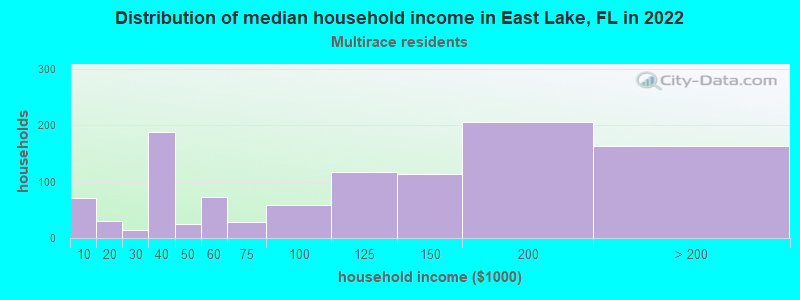
Income and house value in East Lake Median household income in 2022 $91,054 White non-Hispanic householders$30,433 Black householdersover $200,000 Asian householders$61,177 Some other race householders$114,763 Two or more races householders$109,043 Hispanic or Latino race householdersMedian 2022 house value $587,905 White Non-Hispanic householders$537,941 Black or African American householders$395,228 American Indian or Alaska Native householders $762,332 Asian householdersover $1,000,000 Some other race householders$673,174 Two or more races householders$643,853 Hispanic or Latino householders
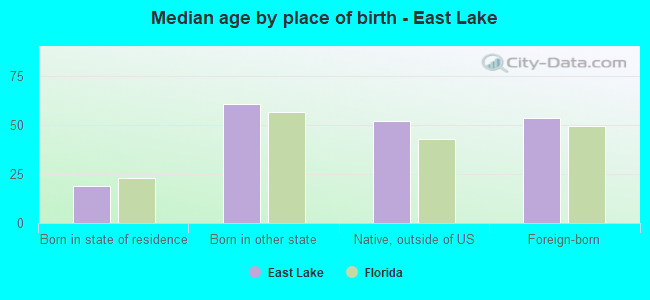
Median age by race in East Lake
54.8 Median age for White residents53.3 56.4 29.3 Median age for Black or African American residents17.5 38.0 25.3 Median age for American Indian / Alaska Native residents31.7 31.2 51.4 Median age for Asian residents52.9 49.0 -556,089,743.0 Median age for Native Hawaiian / Pacific Islander residents-663,446,054.1 -373,522,458.3 36.3 Median age for Other race residents33.4 40.2 43.1 Median age for Two or more races residents27.8 48.3 54.7 Median age for White alone residents53.4 56.0 40.0 Median age for Hispanic or Latino residents37.0 42.5
Owner/renter occupied households by race in East Lake
House owners and renters - White residents 10,154 83.5% Owner occupied2,009 16.5% Renter occupiedHouse owners and renters - Black or African American residents 47 12.4% Owner occupied330 87.6% Renter occupiedHouse owners and renters - American Indian / Alaska Native residents 40 91.7% Owner occupied4 8.3% Renter occupiedHouse owners and renters - Asian residents 282 83.6% Owner occupied55 16.4% Renter occupiedHouse owners and renters - Native Hawaiian / Pacific Islander residents 7 100.0% Owner occupiedHouse owners and renters - Other race residents 106 84.8% Owner occupied19 15.2% Renter occupiedHouse owners and renters - Two or more races residents 790 78.1% Owner occupied222 21.9% Renter occupiedHouse owners and renters - White alone residents 9,973 83.4% Owner occupied1,988 16.6% Renter occupiedHouse owners and renters - Hispanic or Latino residents 753 79.3% Owner occupied197 20.7% Renter occupied
Language usage in East Lake
English speakers - Total 84.7% of residents of East Lake speak English at home.
4.5% of residents speak Spanish at home 937 62.8% Speak English very well555 37.2% Speak English less than very well10.2% of residents speak other language at home 2,521 75.4% Speak English very well821 24.6% Speak English less than very well
English speakers - Born in the United States 93.4% of residents of East Lake speak English at home.
2.6% of residents speak Spanish at home 389 76.4% Speak English very well120 23.6% Speak English less than very well3.6% of residents speak other language at home 651 91.6% Speak English very well60 8.4% Speak English less than very well
English speakers - Native, born elsewhere 54.5% of residents of East Lake speak English at home.
38.5% of residents speak Spanish at home 176 73.3% Speak English very well64 26.7% Speak English less than very well5.3% of residents speak other language at home 27 81.8% Speak English very well6 18.2% Speak English less than very well
English speakers - Foreign-born 30.5% of residents of East Lake speak English at home.
14.7% of residents speak Spanish at home 328 49.0% Speak English very well342 51.0% Speak English less than very well52.6% of residents speak other language at home 1,661 69.1% Speak English very well743 30.9% Speak English less than very well
White (Caucasian) - Speak only English Native:
95.4% (23,224)Foreign-born:
35.6% (792)
White (Caucasian) - Speak another language Native:
4.4% (1,061)Foreign-born:
64.4% (1,433)
Black or African American - Speak only English Native:
100.0% (923)Foreign-born:
100.0% (121)
American Indian / Alaska Native - Speak only English Native:
77.0% (59)Foreign-born:
61.4% (8)
Asian - Speak only English Native:
81.2% (203)Foreign-born:
18.7% (207)
Asian - Speak another language Native:
17.5% (44)Foreign-born:
81.3% (901)
Other race - Speak only English Native:
59.6% (447)Foreign-born:
25.7% (84)
Other race - Speak another language Native:
40.5% (303)Foreign-born:
70.6% (231)
Two or more races - Speak only English Native:
85.7% (1,591)Foreign-born:
30.7% (222)
Two or more races - Speak another language Native:
14.9% (276)Foreign-born:
69.9% (506)
White alone - Speak only English Native:
95.5% (22,979)Foreign-born:
35.4% (800)
White alone - Speak another language Native:
4.1% (991)Foreign-born:
65.1% (1,468)
Hispanic or Latino - Speak only English Native:
66.1% (1,306)Foreign-born:
11.3% (89)
Hispanic or Latino - Speak another language Native:
32.7% (646)Foreign-born:
86.5% (679)
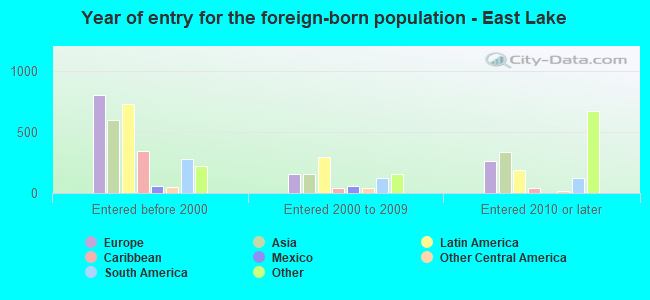
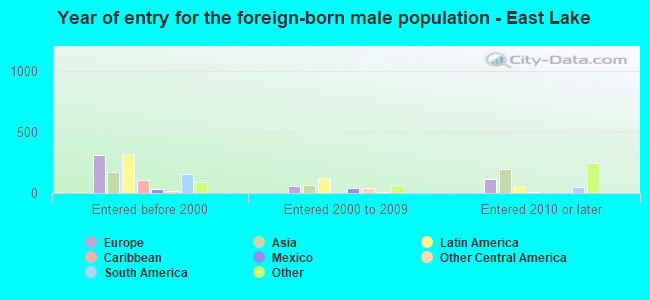
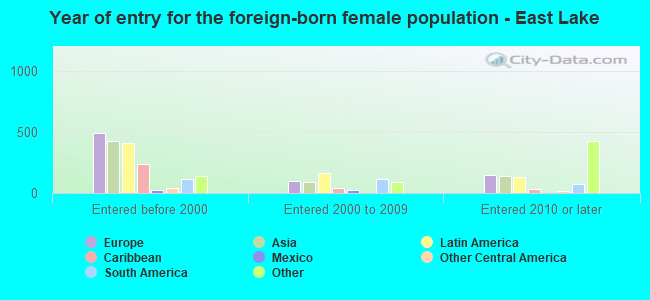
Foreign-born residents in East Lake 4,635 residents are foreign born (3.7% Latin America , 3.6% Europe , 3.2% Asia ).
This city:
13.8%Florida:
21.1%
Marital status for residents in East Lake Marital status - White (Caucasian) population 15 years and over
Males 21.7% Never married65.3% Now married1.1% Separated3.8% Widowed8.1% DivorcedFemales 18.9% Never married51.9% Now married0.6% Separated11.6% Widowed17.0% DivorcedWomen who gave birth in the past 12 months Now married:
91.6% (132)Unmarried:
8.4% (12)
Women who did not give birth in the past 12 months Now married:
43.5% (1,945)Unmarried:
56.5% (2,523)
Marital status - Black or African American population 15 years and over
Males 61.0% Never married26.6% Now married8.3% Separated0.9% Widowed3.2% DivorcedFemales 65.6% Never married17.1% Now married0.0% Separated10.4% Widowed6.9% DivorcedWomen who did not give birth in the past 12 months Now married:
8.7% (35)Unmarried:
91.3% (371)
Marital status - American Indian / Alaska Native population 15 years and over
Males 26.2% Never married23.8% Now married0.0% Separated7.1% Widowed42.9% DivorcedFemales 0.0% Never married27.3% Now married0.0% Separated31.8% Widowed40.9% DivorcedMarital status - Asian population 15 years and over
Males 28.8% Never married62.6% Now married0.0% Separated2.9% Widowed5.7% DivorcedFemales 13.5% Never married74.9% Now married0.0% Separated3.8% Widowed7.8% DivorcedWomen who did not give birth in the past 12 months Now married:
64.5% (298)Unmarried:
35.5% (164)
Marital status - Other race population 15 years and over
Males 67.7% Never married28.7% Now married0.0% Separated0.0% Widowed3.7% DivorcedFemales 51.0% Never married34.9% Now married0.0% Separated0.0% Widowed14.2% DivorcedWomen who did not give birth in the past 12 months Now married:
43.0% (153)Unmarried:
57.0% (202)
Marital status - Two or more races population 15 years and over
Males 30.8% Never married61.6% Now married2.3% Separated0.0% Widowed5.4% DivorcedFemales 21.6% Never married53.8% Now married0.0% Separated1.5% Widowed23.1% DivorcedWomen who gave birth in the past 12 months Now married:
84.7% (73)Unmarried:
15.3% (13)
Women who did not give birth in the past 12 months Now married:
46.3% (230)Unmarried:
53.7% (267)
Marital status - White alone, not Hispanic / Latino population 15 years and over
Males 21.4% Never married65.5% Now married1.1% Separated3.5% Widowed8.5% DivorcedFemales 18.9% Never married51.9% Now married0.6% Separated11.7% Widowed16.9% DivorcedWomen who gave birth in the past 12 months Now married:
91.6% (138)Unmarried:
8.4% (13)
Women who did not give birth in the past 12 months Now married:
43.9% (1,966)Unmarried:
56.1% (2,508)
Marital status - Hispanic or Latino population 15 years and over
Males 37.1% Never married55.1% Now married0.8% Separated4.5% Widowed2.6% DivorcedFemales 24.7% Never married50.3% Now married0.0% Separated3.3% Widowed21.7% DivorcedWomen who gave birth in the past 12 months Now married:
100.0% (53)Unmarried:
0.0% (0)
Women who did not give birth in the past 12 months Now married:
41.8% (233)Unmarried:
58.2% (324)
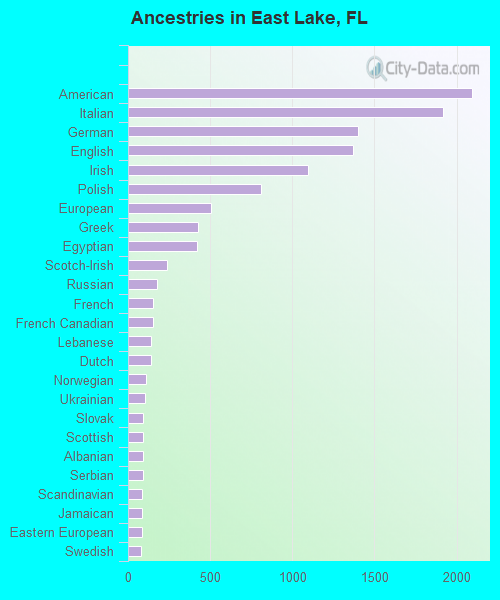
Ancestries in East Lake
2,093 12.4% American1,915 11.4% Italian1,402 8.3% German1,367 8.1% English1,096 6.5% Irish808 4.8% Polish508 3.0% European424 2.5% Greek422 2.5% Egyptian237 1.4% Scotch-Irish179 1.1% Russian155 0.9% French153 0.9% French Canadian143 0.8% Lebanese137 0.8% Dutch107 0.6% Norwegian101 0.6% Ukrainian92 0.5% Slovak91 0.5% Scottish90 0.5% Albanian90 0.5% Serbian85 0.5% Scandinavian85 0.5% Jamaican83 0.5% Eastern European82 0.5% Swedish80 0.5% Hungarian78 0.5% Canadian75 0.4% Portuguese56 0.3% Austrian50 0.3% Trinidadian and Tobagonian50 0.3% British44 0.3% Armenian36 0.2% Iranian34 0.2% Welsh33 0.2% Romanian32 0.2% Czech27 0.2% Lithuanian27 0.2% Barbadian24 0.1% Finnish23 0.1% Yugoslavian21 0.1% Maltese17 0.1% African15 0.09% Swiss14 0.08% Croatian10 0.06% Macedonian10 0.06% Czechoslovakian9 0.05% Pennsylvania German9 0.05% Belgian9 0.05% Brazilian8 0.05% Northern European8 0.05% Israeli7 0.04% Danish5 0.03% British West Indian4 0.02% Slavic4 0.02% Slovene3 0.02% Syrian
Geographical mobility in East Lake Same house 1 year ago 23,744 87.9% White (Caucasian)971 90.4% Black or African American85 87.1% American Indian / Alaska Native1,080 78.1% Asian6 100.0% Native Hawaiian / Pacific Islander1,075 100.0% Other race2,457 88.7% Two or more races23,618 88.1% White alone, not Hispanic / Latino2,603 90.6% Hispanic or LatinoMoved within same county 1,270 4.7% White / Caucasian82 7.6% Black or African American12 12.1% American Indian / Alaska Native48 3.5% Asian9 0.9% Other race92 3.3% Two or more races1,245 4.6% White alone, not Hispanic / Latino86 3.0% Hispanic or LatinoMoved within same state 678 2.5% White / Caucasian14 1.0% Asian26 2.4% Other race91 3.3% Two or more races603 2.2% White alone, not Hispanic / Latino188 6.6% Hispanic or LatinoMoved from different state 1,026 3.8% White / Caucasian166 12.0% Asian21 2.0% Other race71 2.6% Two or more races1,013 3.8% White alone, not Hispanic / Latino37 1.3% Hispanic or LatinoMoved from abroad 305 1.1% White15 1.4% Black or African American29 2.1% Asian112 4.1% Two or more races340 1.3% White alone, not Hispanic / Latino
Children Nativity (place of birth) in East Lake
Children under 6 years - Living with two parents Both parents native 617 100.0% NativeBoth parents foreign-born 122 100.0% NativeOne native, one foreign-born parent 66 100.0% NativeChildren under 6 years - Living with one parent Native parent 179 100.0% NativeForeign-born parent 15 100.0% NativeChildren 6 to 17 years - Living with two parents Both parents native 2,520 100.0% NativeBoth parents foreign-born 317 55.3% Native256 44.7% Foreign-bornOne native, one foreign-born parent 398 100.0% NativeChildren 6 to 17 years - Living with one parent Native parent 813 100.0% NativeForeign-born parent 55 50.7% Native53 49.3% Foreign-born
Grandparents responsible for own grandchildren in East Lake
Grandparents (30 to 59 years) White / Caucasian 4 3.1% Responsible for grandchildren112 96.9% Not responsible for grandchildrenWhite alone, not Hispanic / Latino 4 3.8% Responsible for grandchildren108 96.2% Not responsible for grandchildrenHispanic or Latino 10 100.0% Not responsible for grandchildrenGrandparents (60 years and over) White / Caucasian 51 14.9% Responsible for grandchildren292 85.1% Not responsible for grandchildrenWhite alone, not Hispanic / Latino 36 12.6% Responsible for grandchildren252 87.4% Not responsible for grandchildrenHispanic or Latino 24 25.8% Responsible for grandchildren70 74.2% Not responsible for grandchildren