Races in East Leon, Florida (FL) Detailed Stats
Ancestries, Foreign-born residents, place of birth
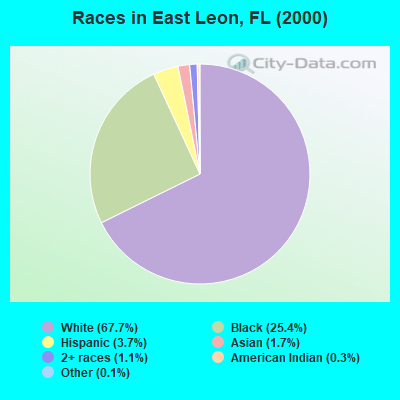
Race distribution in East Leon

- 19,33867.7%White alone
- 7,25225.4%Black alone
- 1,0523.7%Hispanic
- 4771.7%Asian alone
- 3131.1%Two or more races
- 820.3%American Indian alone
- 290.1%Other race alone
- 110.04%Native Hawaiian and Other
Pacific Islander alone
2000
2022
-
- 10,458,50965.4%White alone
- 2,682,71516.8%Hispanic
- 2,264,26814.2%Black alone
- 261,6931.6%Asian alone
- 236,9541.5%Two or more races
- 42,3580.3%American Indian alone
- 28,9940.2%Other race alone
- 6,8870.04%Native Hawaiian and Other
Pacific Islander alone

-
- 11,309,40350.8%White alone
- 6,025,03927.1%Hispanic
- 3,241,01514.6%Black alone
- 861,6303.9%Two or more races
- 623,6922.8%Asian alone
- 152,0540.7%Other race alone
- 22,5040.1%American Indian alone
- 9,4860.04%Native Hawaiian and Other
Pacific Islander alone

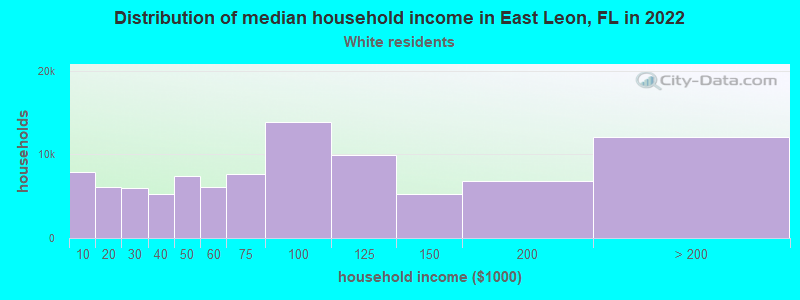
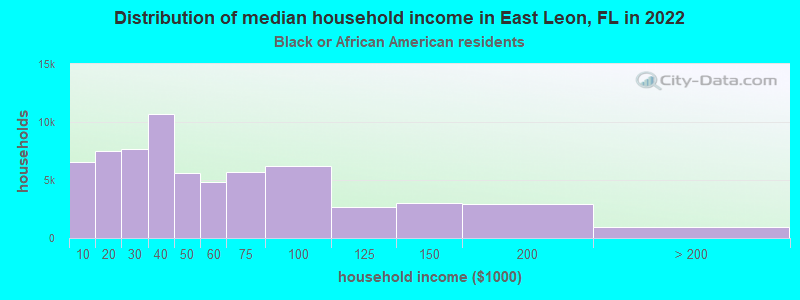
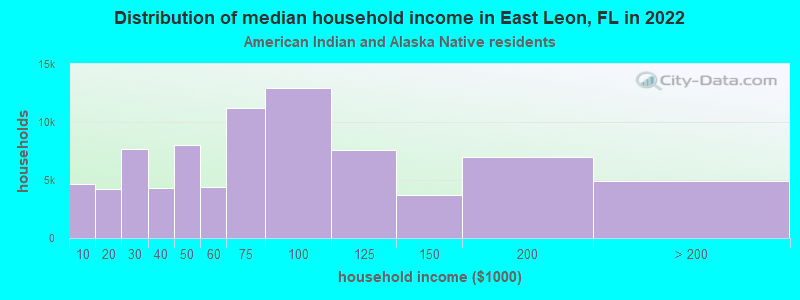
Income and house value in East Leon
- Median household income in 2022
- $98,343White non-Hispanic householders
- $71,423Black householders
- over $200,000American Indian and Alaska Native householders
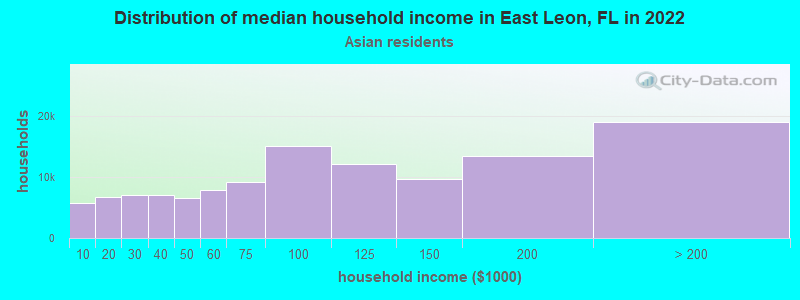
- $92,070Asian householders
- $163,246Some other race householders
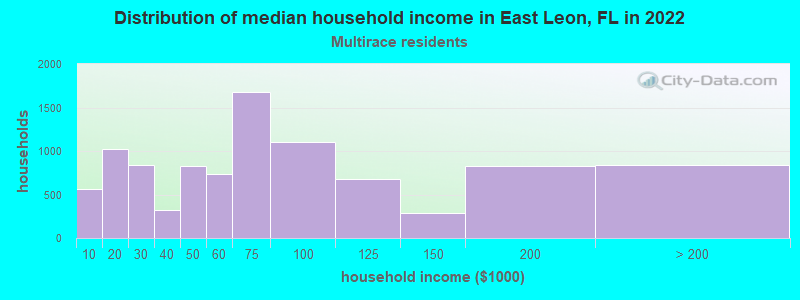
- $105,611Two or more races householders
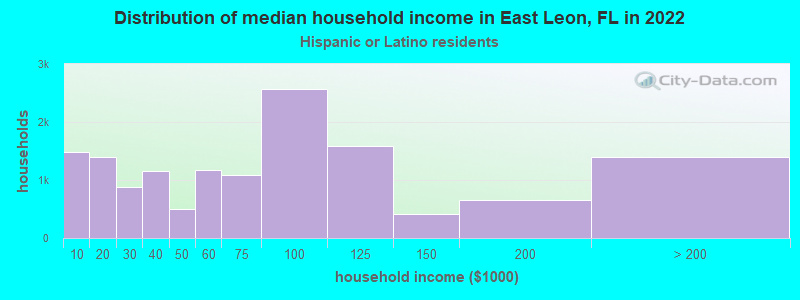
- $132,505Hispanic or Latino race householders
- Median 2022 house value
- $398,947White Non-Hispanic householders
- $276,546Black or African American householders
- $382,646American Indian or Alaska Native householders
- $437,841Asian householders
- $393,228Some other race householders
- $275,402Two or more races householders
- $435,839Hispanic or Latino householders
Household income for White non-Hispanic householders
Household income for Black householders
Household income for American Indian and Alaska Native householders
Household income for Asian householders
Household income for Two or more races householders
Household income for Hispanic or Latino race householders
Zip code: 32308