Races in East Meadow, New York (NY) Detailed Stats
Data:
Races - White alone (%)
Races - White alone (% change since 2000)
Races - Black alone (%)
Races - Black alone (% change since 2000)
Races - American Indian alone (%)
Races - American Indian alone (% change since 2000)
Races - Asian alone (%)
Races - Asian alone (% change since 2000)
Races - Hispanic (%)
Races - Hispanic (% change since 2000)
Races - Native Hawaiian and Other Pacific Islander alone (%)
Races - Native Hawaiian and Other Pacific Islander alone (% change since 2000)
Races - Two or more races(%)
Races - Two or more races(% change since 2000)
Races - Other race alone (%)
Races - Other race alone (% change since 2000)
Racial diversity
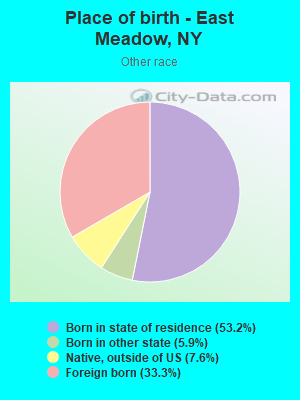
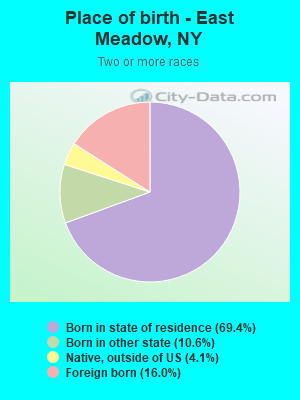
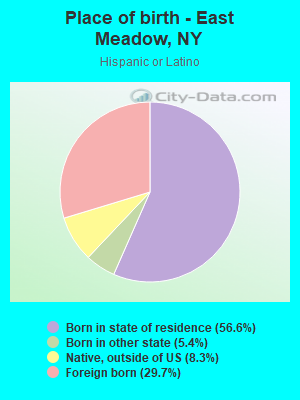
Place of birth - Born in state of residence (%)
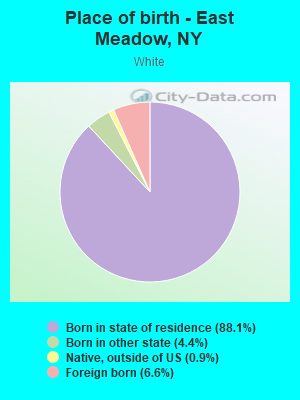
Place of birth - Born in state of residence (%) - White
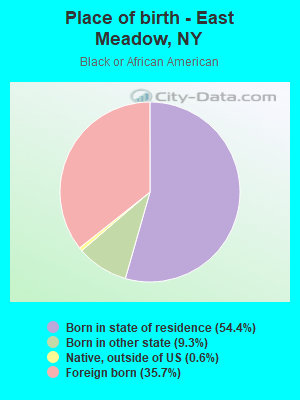
Place of birth - Born in state of residence (%) - Black or African American
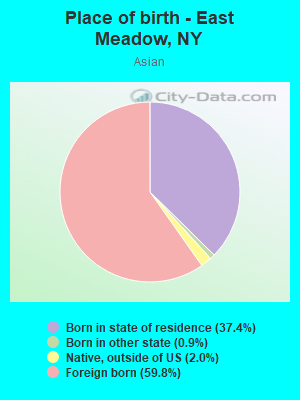
Place of birth - Born in state of residence (%) - Asian
Place of birth - Born in state of residence (%) - Hispanic or Latino
Place of birth - Born in state of residence (%) - American Indian and Alaska Native
Place of birth - Born in state of residence (%) - Multirace
Place of birth - Born in state of residence (%) - Other Race
Place of birth - Born in other state (%)
Place of birth - Born in other state (%) - White
Place of birth - Born in other state (%) - Black or African American
Place of birth - Born in other state (%) - Asian
Place of birth - Born in other state (%) - Hispanic or Latino
Place of birth - Born in other state (%) - American Indian and Alaska Native
Place of birth - Born in other state (%) - Multirace
Place of birth - Born in other state (%) - Other Race
Place of birth - Native, outside of US (%)
Place of birth - Native, outside of US (%) - White
Place of birth - Native, outside of US (%) - Black or African American
Place of birth - Native, outside of US (%) - Asian
Place of birth - Native, outside of US (%) - Hispanic or Latino
Place of birth - Native, outside of US (%) - American Indian and Alaska Native
Place of birth - Native, outside of US (%) - Multirace
Place of birth - Native, outside of US (%) - Other Race
Place of birth - Foreign born (%)
Place of birth - Foreign born (%) - White
Place of birth - Foreign born (%) - Black or African American
Place of birth - Foreign born (%) - Asian
Place of birth - Foreign born (%) - Hispanic or Latino
Place of birth - Foreign born (%) - American Indian and Alaska Native
Place of birth - Foreign born (%) - Multirace
Place of birth - Foreign born (%) - Other Race
Residents speaking English at home (%)
Residents speaking English at home - Born in the United States (%)
Residents speaking English at home - Native, born elsewhere (%)
Residents speaking English at home - Foreign born (%)
Residents speaking Spanish at home (%)
Residents speaking Spanish at home - Born in the United States (%)
Residents speaking Spanish at home - Native, born elsewhere (%)
Residents speaking Spanish at home - Foreign born (%)
Residents speaking other language at home (%)
Residents speaking other language at home - Born in the United States (%)
Residents speaking other language at home - Native, born elsewhere (%)
Residents speaking other language at home - Foreign born (%)
Marital status - Never married (%)
Marital status - Now married (%)
Marital status - Separated (%)
Marital status - Widowed (%)
Marital status - Divorced (%)
Ancestries Reported - Arab (%)
Ancestries Reported - Czech (%)
Ancestries Reported - Danish (%)
Ancestries Reported - Dutch (%)
Ancestries Reported - English (%)
Ancestries Reported - French (%)
Ancestries Reported - French Canadian (%)
Ancestries Reported - German (%)
Ancestries Reported - Greek (%)
Ancestries Reported - Hungarian (%)
Ancestries Reported - Irish (%)
Ancestries Reported - Italian (%)
Ancestries Reported - Lithuanian (%)
Ancestries Reported - Norwegian (%)
Ancestries Reported - Polish (%)
Ancestries Reported - Portuguese (%)
Ancestries Reported - Russian (%)
Ancestries Reported - Scotch-Irish (%)
Ancestries Reported - Scottish (%)
Ancestries Reported - Slovak (%)
Ancestries Reported - Subsaharan African (%)
Ancestries Reported - Swedish (%)
Ancestries Reported - Swiss (%)
Ancestries Reported - Ukrainian (%)
Ancestries Reported - United States (%)
Ancestries Reported - Welsh (%)
Ancestries Reported - West Indian (%)
Ancestries Reported - Other (%)
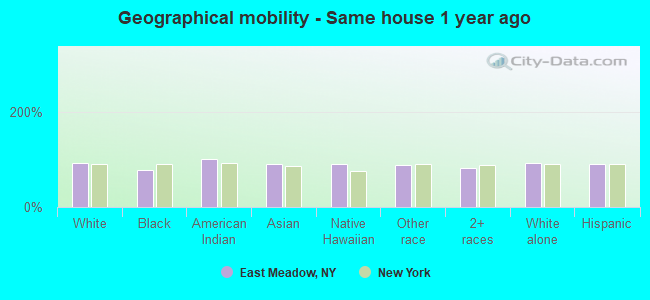
Geographical mobility - Same house 1 year ago (%)
Geographical mobility - Same house 1 year ago (%) - White
Geographical mobility - Same house 1 year ago (%) - Black or African American
Geographical mobility - Same house 1 year ago (%) - Asian
Geographical mobility - Same house 1 year ago (%) - Hispanic or Latino
Geographical mobility - Same house 1 year ago (%) - American Indian and Alaska Native
Geographical mobility - Same house 1 year ago (%) - Multirace
Geographical mobility - Same house 1 year ago (%) - Other Race
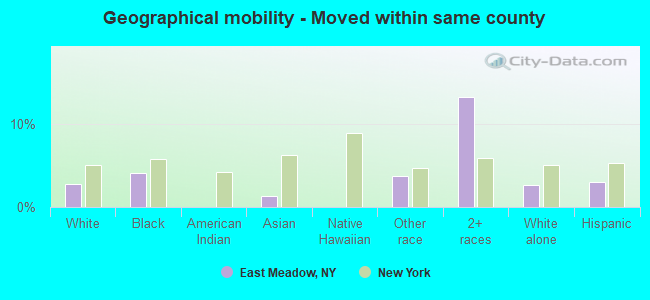
Geographical mobility - Moved within same county (%)
Geographical mobility - Moved within same county (%) - White
Geographical mobility - Moved within same county (%) - Black or African American
Geographical mobility - Moved within same county (%) - Asian
Geographical mobility - Moved within same county (%) - Hispanic or Latino
Geographical mobility - Moved within same county (%) - American Indian and Alaska Native
Geographical mobility - Moved within same county (%) - Multirace
Geographical mobility - Moved within same county (%) - Other Race
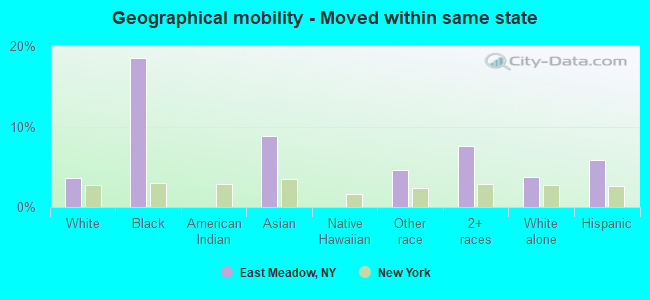
Geographical mobility - Moved from different county within same state (%)
Geographical mobility - Moved from different county within same state (%) - White
Geographical mobility - Moved from different county within same state (%) - Black or African American
Geographical mobility - Moved from different county within same state (%) - Asian
Geographical mobility - Moved from different county within same state (%) - Hispanic or Latino
Geographical mobility - Moved from different county within same state (%) - American Indian and Alaska Native
Geographical mobility - Moved from different county within same state (%) - Multirace
Geographical mobility - Moved from different county within same state (%) - Other Race
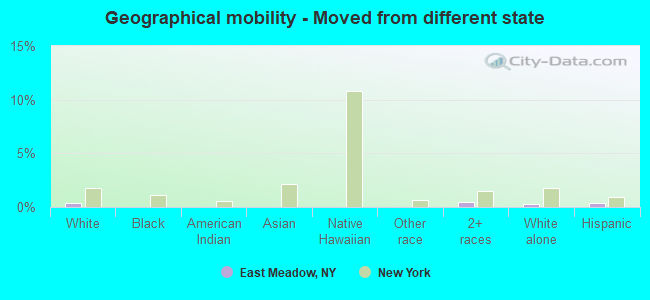
Geographical mobility - Moved from different state (%)
Geographical mobility - Moved from different state (%) - White
Geographical mobility - Moved from different state (%) - Black or African American
Geographical mobility - Moved from different state (%) - Asian
Geographical mobility - Moved from different state (%) - Hispanic or Latino
Geographical mobility - Moved from different state (%) - American Indian and Alaska Native
Geographical mobility - Moved from different state (%) - Multirace
Geographical mobility - Moved from different state (%) - Other Race
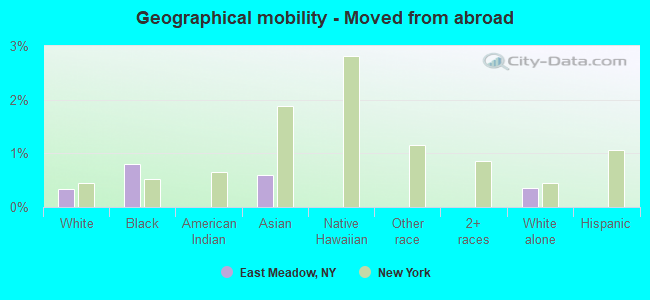
Geographical mobility - Moved from abroad (%)
Geographical mobility - Moved from abroad (%) - White
Geographical mobility - Moved from abroad (%) - Black or African American
Geographical mobility - Moved from abroad (%) - Asian
Geographical mobility - Moved from abroad (%) - Hispanic or Latino
Geographical mobility - Moved from abroad (%) - American Indian and Alaska Native
Geographical mobility - Moved from abroad (%) - Multirace
Geographical mobility - Moved from abroad (%) - Other Race
Place of birth for the foreign-born population - Ireland (%)
Place of birth for the foreign-born population - Denmark (%)
Place of birth for the foreign-born population - Norway (%)
Place of birth for the foreign-born population - Sweden (%)
Place of birth for the foreign-born population - United Kingdom (%)
Place of birth for the foreign-born population - England (%)
Place of birth for the foreign-born population - Scotland (%)
Place of birth for the foreign-born population - Other Northern Europe (%)
Place of birth for the foreign-born population - Austria (%)
Place of birth for the foreign-born population - Belgium (%)
Place of birth for the foreign-born population - France (%)
Place of birth for the foreign-born population - Germany (%)
Place of birth for the foreign-born population - Netherlands (%)
Place of birth for the foreign-born population - Switzerland (%)
Place of birth for the foreign-born population - Other Western Europe (%)
Place of birth for the foreign-born population - Greece (%)
Place of birth for the foreign-born population - Italy (%)
Place of birth for the foreign-born population - Portugal (%)
Place of birth for the foreign-born population - Spain (%)
Place of birth for the foreign-born population - Other Southern Europe (%)
Place of birth for the foreign-born population - Albania (%)
Place of birth for the foreign-born population - Belarus (%)
Place of birth for the foreign-born population - Bosnia and Herzegovina (%)
Place of birth for the foreign-born population - Bulgaria (%)
Place of birth for the foreign-born population - Croatia (%)
Place of birth for the foreign-born population - Czechoslovakia (%)
Place of birth for the foreign-born population - Hungary (%)
Place of birth for the foreign-born population - Latvia (%)
Place of birth for the foreign-born population - Lithuania (%)
Place of birth for the foreign-born population - North Macedonia (Macedonia) (%)
Place of birth for the foreign-born population - Moldova (%)
Place of birth for the foreign-born population - Poland (%)
Place of birth for the foreign-born population - Romania (%)
Place of birth for the foreign-born population - Russia (%)
Place of birth for the foreign-born population - Serbia (%)
Place of birth for the foreign-born population - Ukraine (%)
Place of birth for the foreign-born population - Other Eastern Europe (%)
Place of birth for the foreign-born population - China (%)
Place of birth for the foreign-born population - Hong Kong (%)
Place of birth for the foreign-born population - Taiwan (%)
Place of birth for the foreign-born population - Japan (%)
Place of birth for the foreign-born population - Korea (%)
Place of birth for the foreign-born population - Other Eastern Asia (%)
Place of birth for the foreign-born population - Afghanistan (%)
Place of birth for the foreign-born population - Bangladesh (%)
Place of birth for the foreign-born population - India (%)
Place of birth for the foreign-born population - Iran (%)
Place of birth for the foreign-born population - Kazakhstan (%)
Place of birth for the foreign-born population - Nepal (%)
Place of birth for the foreign-born population - Pakistan (%)
Place of birth for the foreign-born population - Sri Lanka (%)
Place of birth for the foreign-born population - Uzbekistan (%)
Place of birth for the foreign-born population - Other South Central Asia (%)
Place of birth for the foreign-born population - Burma (%)
Place of birth for the foreign-born population - Cambodia (%)
Place of birth for the foreign-born population - Indonesia (%)
Place of birth for the foreign-born population - Laos (%)
Place of birth for the foreign-born population - Malaysia (%)
Place of birth for the foreign-born population - Philippines (%)
Place of birth for the foreign-born population - Singapore (%)
Place of birth for the foreign-born population - Thailand (%)
Place of birth for the foreign-born population - Vietnam (%)
Place of birth for the foreign-born population - Other South Eastern Asia (%)
Place of birth for the foreign-born population - Armenia (%)
Place of birth for the foreign-born population - Iraq (%)
Place of birth for the foreign-born population - Israel (%)
Place of birth for the foreign-born population - Jordan (%)
Place of birth for the foreign-born population - Kuwait (%)
Place of birth for the foreign-born population - Lebanon (%)
Place of birth for the foreign-born population - Saudi Arabia (%)
Place of birth for the foreign-born population - Syria (%)
Place of birth for the foreign-born population - Turkey (%)
Place of birth for the foreign-born population - Yemen (%)
Place of birth for the foreign-born population - Other Western Asia (%)
Place of birth for the foreign-born population - Eritrea (%)
Place of birth for the foreign-born population - Ethiopia (%)
Place of birth for the foreign-born population - Kenya (%)
Place of birth for the foreign-born population - Somalia (%)
Place of birth for the foreign-born population - Uganda (%)
Place of birth for the foreign-born population - Zimbabwe (%)
Place of birth for the foreign-born population - Other Eastern Africa (%)
Place of birth for the foreign-born population - Cameroon (%)
Place of birth for the foreign-born population - Congo (%)
Place of birth for the foreign-born population - Democratic Republic of Congo (Zaire) (%)
Place of birth for the foreign-born population - Other Middle Africa (%)
Place of birth for the foreign-born population - Egypt (%)
Place of birth for the foreign-born population - Morocco (%)
Place of birth for the foreign-born population - Sudan (%)
Place of birth for the foreign-born population - Other Northern Africa (%)
Place of birth for the foreign-born population - South Africa (%)
Place of birth for the foreign-born population - Other Southern Africa (%)
Place of birth for the foreign-born population - Cabo Verde (%)
Place of birth for the foreign-born population - Ghana (%)
Place of birth for the foreign-born population - Liberia (%)
Place of birth for the foreign-born population - Nigeria (%)
Place of birth for the foreign-born population - Senegal (%)
Place of birth for the foreign-born population - Sierra Leone (%)
Place of birth for the foreign-born population - Other Western Africa (%)
Place of birth for the foreign-born population - Australia (%)
Place of birth for the foreign-born population - New Zealand (%)
Place of birth for the foreign-born population - Fiji (%)
Place of birth for the foreign-born population - Micronesia (%)
Place of birth for the foreign-born population - Bahamas (%)
Place of birth for the foreign-born population - Barbados (%)
Place of birth for the foreign-born population - Cuba (%)
Place of birth for the foreign-born population - Dominica (%)
Place of birth for the foreign-born population - Dominican Republic (%)
Place of birth for the foreign-born population - Grenada (%)
Place of birth for the foreign-born population - Haiti (%)
Place of birth for the foreign-born population - Jamaica (%)
Place of birth for the foreign-born population - St. Vincent and the Grenadines (%)
Place of birth for the foreign-born population - Trinidad and Tobago (%)
Place of birth for the foreign-born population - West Indies (%)
Place of birth for the foreign-born population - Other Caribbean (%)
Place of birth for the foreign-born population - Belize (%)
Place of birth for the foreign-born population - Costa Rica (%)
Place of birth for the foreign-born population - El Salvador (%)
Place of birth for the foreign-born population - Guatemala (%)
Place of birth for the foreign-born population - Honduras (%)
Place of birth for the foreign-born population - Mexico (%)
Place of birth for the foreign-born population - Nicaragua (%)
Place of birth for the foreign-born population - Panama (%)
Place of birth for the foreign-born population - Other Central America (%)
Place of birth for the foreign-born population - Argentina (%)
Place of birth for the foreign-born population - Bolivia (%)
Place of birth for the foreign-born population - Brazil (%)
Place of birth for the foreign-born population - Chile (%)
Place of birth for the foreign-born population - Colombia (%)
Place of birth for the foreign-born population - Ecuador (%)
Place of birth for the foreign-born population - Guyana (%)
Place of birth for the foreign-born population - Peru (%)
Place of birth for the foreign-born population - Uruguay (%)
Place of birth for the foreign-born population - Venezuela (%)
Place of birth for the foreign-born population - Other South America (%)
Place of birth for the foreign-born population - Canada (%)
Place of birth for the foreign-born population - Other Northern America (%)
Place of birth for the foreign-born population - Other (%)
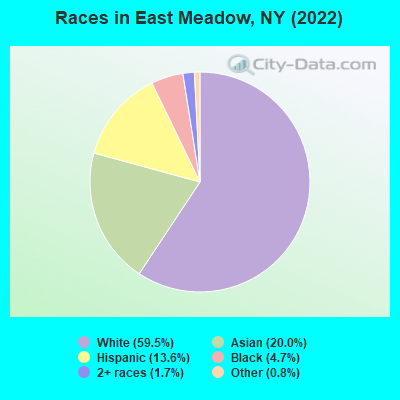
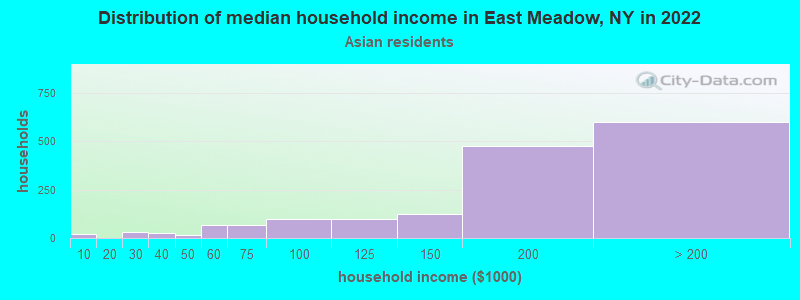
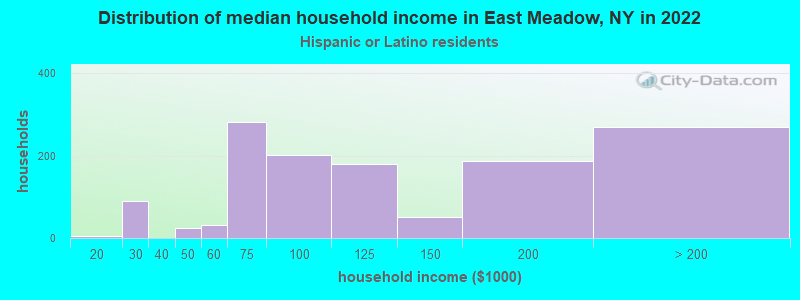
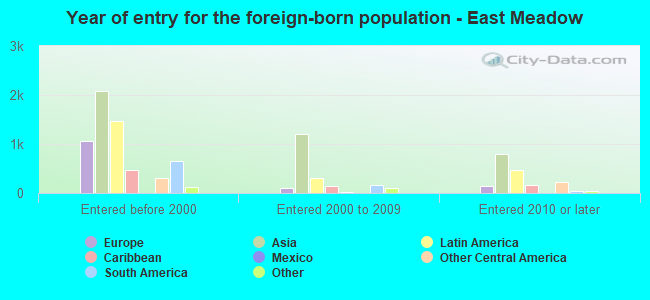
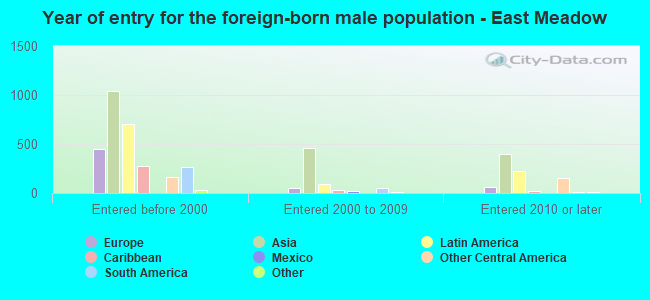
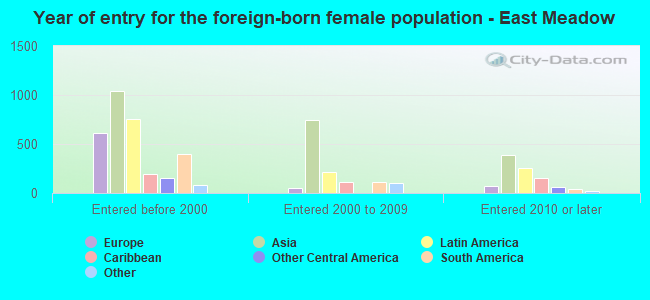
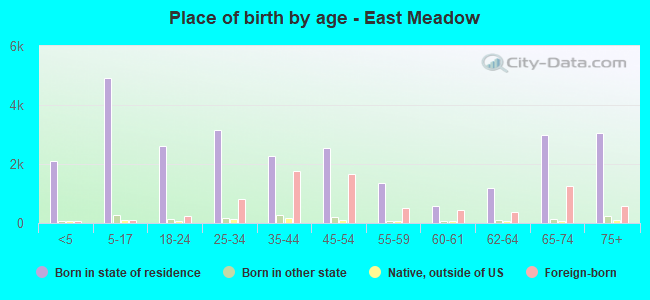
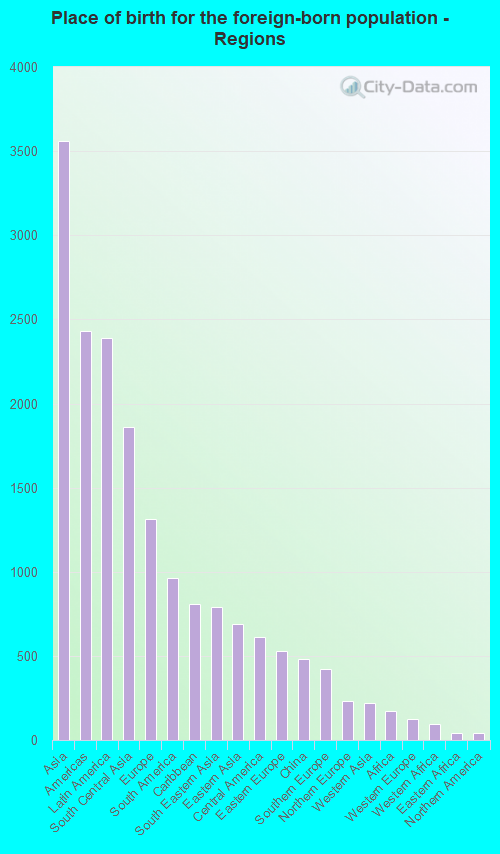
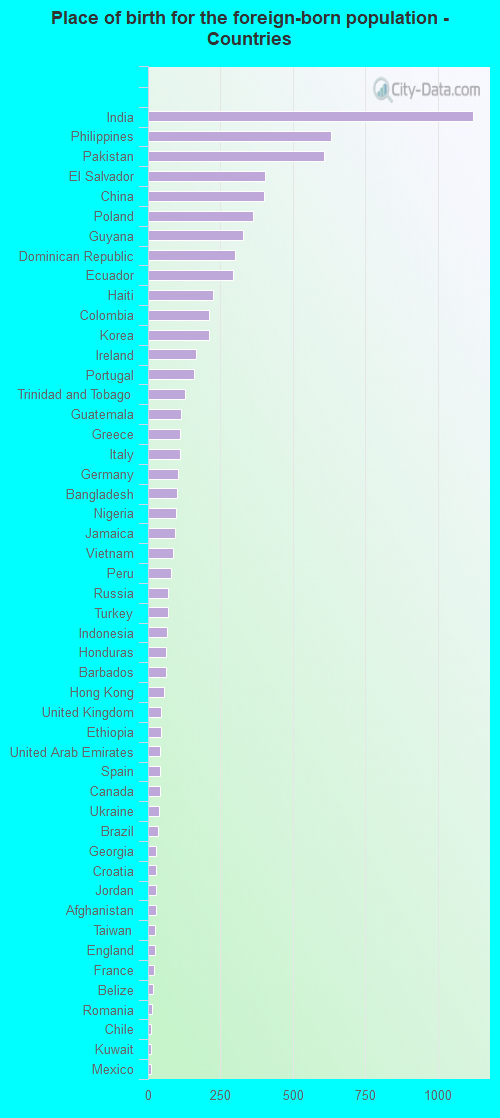
According to 2022 data, the most numerous races in East Meadow, NY are White alone (21,837 residents), Hispanic (4,985 residents), and Black alone (1,721 residents). 68.6% of East Meadow residents speak English at home. 20.4% of East Meadow, NY residents are foreign-born (9.8% born in Asia, 6.5% born in Latin America, 3.6% born in Europe), which is 8.1% less than the foreign-born rate of 22.0% across the entire state of New York.
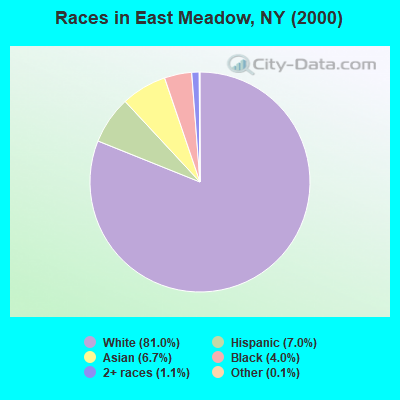
Race distribution in East Meadow
2000 2022
11,760,981 62.0% White alone 2,867,583 15.1% Hispanic 2,812,623 14.8% Black alone 1,035,926 5.5% Asian alone 366,116 1.9% Two or more races 75,499 0.4% Other race alone 52,499 0.3% American Indian alone 5,230 0.03% Native Hawaiian and Other
10,408,933 52.9% White alone 3,867,299 19.7% Hispanic 2,633,840 13.4% Black alone 1,776,286 9.0% Asian alone 732,670 3.7% Two or more races 216,110 1.1% Other race alone 35,082 0.2% American Indian alone 6,931 0.04% Native Hawaiian and Other
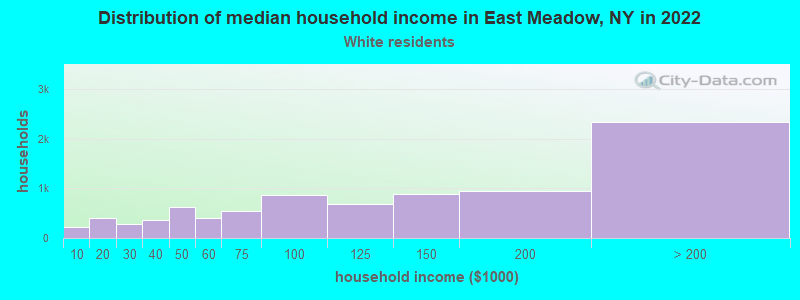
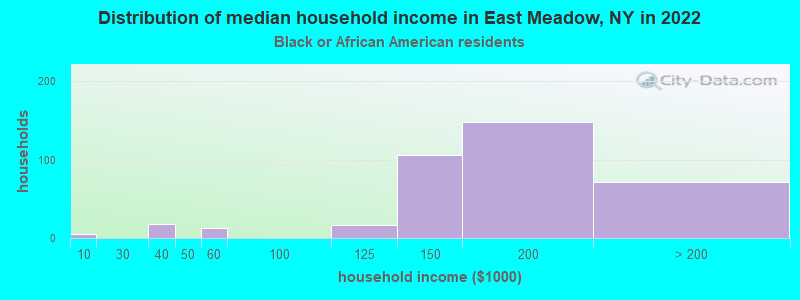
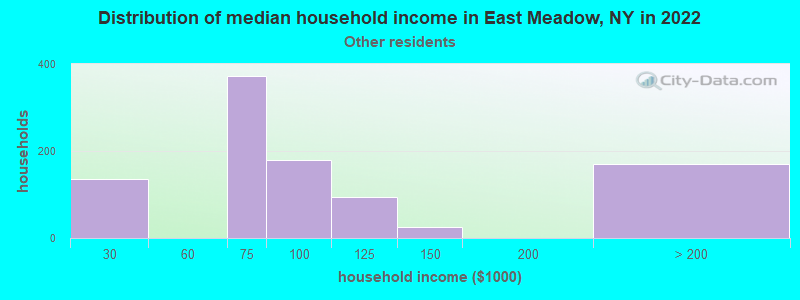
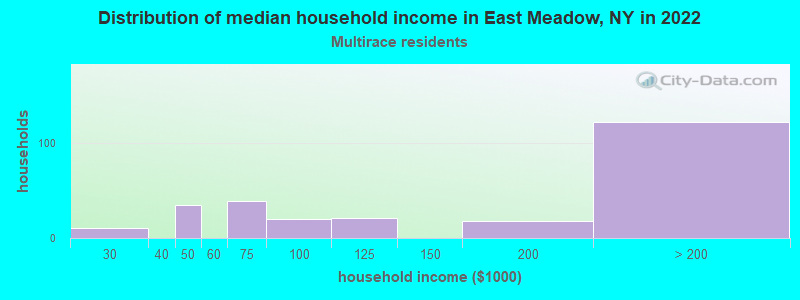
Income and house value in East Meadow Median household income in 2022 $121,153 White non-Hispanic householders$173,181 Black householders$165,898 Asian householders$79,800 Some other race householders$192,205 Two or more races householders$102,282 Hispanic or Latino race householdersMedian 2022 house value $622,664 White Non-Hispanic householders$648,645 Black or African American householders$401,389 American Indian or Alaska Native householders $738,556 Asian householders$401,389 Native Hawaiian and other Pacific Islander householders$529,250 Some other race householders$729,799 Two or more races householders$615,366 Hispanic or Latino householders
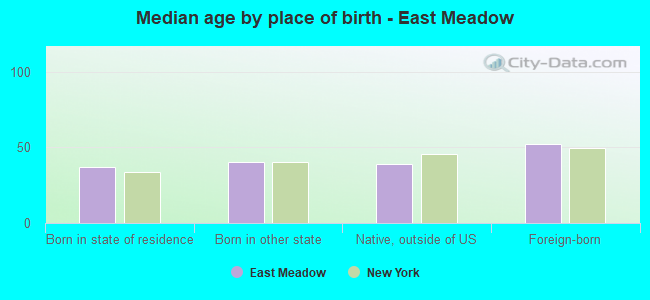
Median age by race in East Meadow
51.6 Median age for White residents50.3 53.5 35.2 Median age for Black or African American residents32.8 37.6 -855,158,729.3 Median age for American Indian / Alaska Native residents-607,543,322.5 -837,121,211.3 36.1 Median age for Asian residents38.5 34.2 -487,992,314.6 Median age for Native Hawaiian / Pacific Islander residents-477,502,295.2 -497,387,669.3 35.2 Median age for Other race residents41.1 25.7 23.1 Median age for Two or more races residents24.6 22.7 51.4 Median age for White alone residents50.3 53.6 34.7 Median age for Hispanic or Latino residents37.4 31.4
Owner/renter occupied households by race in East Meadow
House owners and renters - White residents 7,561 89.7% Owner occupied868 10.3% Renter occupiedHouse owners and renters - Black or African American residents 267 78.4% Owner occupied74 21.6% Renter occupiedHouse owners and renters - American Indian / Alaska Native residents 8 100.0% Owner occupiedHouse owners and renters - Asian residents 1,569 93.7% Owner occupied105 6.3% Renter occupiedHouse owners and renters - Native Hawaiian / Pacific Islander residents 10 100.0% Owner occupiedHouse owners and renters - Other race residents 639 69.7% Owner occupied278 30.3% Renter occupiedHouse owners and renters - Two or more races residents 280 100.0% Owner occupiedHouse owners and renters - White alone residents 7,358 89.2% Owner occupied886 10.8% Renter occupiedHouse owners and renters - Hispanic or Latino residents 1,061 79.1% Owner occupied281 20.9% Renter occupied
Language usage in East Meadow
English speakers - Total 68.6% of residents of East Meadow speak English at home.
8.5% of residents speak Spanish at home 2,191 74.2% Speak English very well763 25.8% Speak English less than very well23.2% of residents speak other language at home 5,863 73.2% Speak English very well2,148 26.8% Speak English less than very well
English speakers - Born in the United States 87.6% of residents of East Meadow speak English at home.
12.0% of residents speak Spanish at home 184 100.0% Speak English very well3.1% of residents speak other language at home 48 100.0% Speak English very well
English speakers - Native, born elsewhere 16.2% of residents of East Meadow speak English at home.
50.4% of residents speak Spanish at home 215 61.8% Speak English very well133 38.2% Speak English less than very well34.2% of residents speak other language at home 236 100.0% Speak English very well
English speakers - Foreign-born 18.3% of residents of East Meadow speak English at home.
17.0% of residents speak Spanish at home 730 55.5% Speak English very well586 44.5% Speak English less than very well66.2% of residents speak other language at home 3,161 61.8% Speak English very well1,950 38.2% Speak English less than very well
White (Caucasian) - Speak only English Native:
91.6% (18,176)Foreign-born:
25.1% (372)
White (Caucasian) - Speak another language Native:
8.0% (1,584)Foreign-born:
73.9% (1,094)
Black or African American - Speak only English Native:
91.3% (904)Foreign-born:
40.8% (247)
Black or African American - Speak another language Native:
8.5% (84)Foreign-born:
59.7% (361)
Asian - Speak only English Native:
45.8% (1,066)Foreign-born:
13.3% (584)
Asian - Speak another language Native:
54.0% (1,256)Foreign-born:
86.4% (3,788)
Other race - Speak only English Native:
51.1% (985)Foreign-born:
11.1% (116)
Other race - Speak another language Native:
50.6% (976)Foreign-born:
87.8% (922)
Two or more races - Speak only English Native:
77.5% (1,167)Foreign-born:
22.2% (70)
Two or more races - Speak another language Native:
19.6% (295)Foreign-born:
77.2% (244)
White alone - Speak only English Native:
92.5% (18,001)Foreign-born:
25.8% (379)
White alone - Speak another language Native:
7.3% (1,420)Foreign-born:
74.3% (1,090)
Hispanic or Latino - Speak only English Native:
47.7% (1,483)Foreign-born:
9.7% (146)
Hispanic or Latino - Speak another language Native:
52.2% (1,624)Foreign-born:
90.3% (1,358)
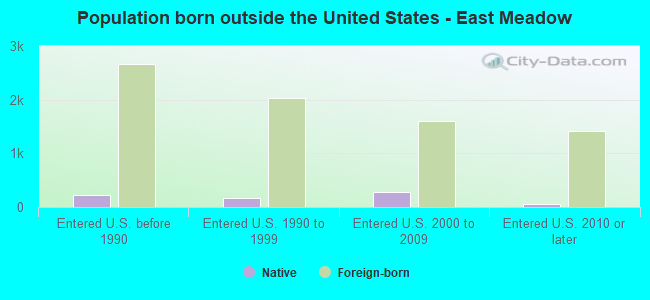
Foreign-born residents in East Meadow 7,472 residents are foreign born (9.8% Asia , 6.5% Latin America , 3.6% Europe ).
This city:
20.4%New York:
22.6%
Marital status for residents in East Meadow Marital status - White (Caucasian) population 15 years and over
Males 31.0% Never married58.4% Now married0.9% Separated4.5% Widowed5.3% DivorcedFemales 25.5% Never married49.5% Now married0.9% Separated12.8% Widowed11.4% DivorcedWomen who gave birth in the past 12 months Now married:
84.2% (139)Unmarried:
15.8% (26)
Women who did not give birth in the past 12 months Now married:
42.6% (1,632)Unmarried:
57.4% (2,203)
Marital status - Black or African American population 15 years and over
Males 63.4% Never married36.3% Now married0.0% Separated0.4% Widowed0.0% DivorcedFemales 30.8% Never married38.2% Now married3.4% Separated14.3% Widowed13.3% DivorcedWomen who gave birth in the past 12 months Now married:
100.0% (38)Unmarried:
0.0% (0)
Women who did not give birth in the past 12 months Now married:
37.6% (78)Unmarried:
62.4% (130)
Marital status - Asian population 15 years and over
Males 19.1% Never married73.0% Now married0.3% Separated6.4% Widowed1.2% DivorcedFemales 23.1% Never married68.7% Now married1.5% Separated5.5% Widowed1.2% DivorcedWomen who gave birth in the past 12 months Now married:
100.0% (85)Unmarried:
0.0% (0)
Women who did not give birth in the past 12 months Now married:
60.9% (1,168)Unmarried:
39.1% (750)
Marital status - Other race population 15 years and over
Males 26.5% Never married57.8% Now married1.9% Separated0.0% Widowed13.8% DivorcedFemales 23.9% Never married60.9% Now married5.9% Separated1.4% Widowed8.0% DivorcedWomen who gave birth in the past 12 months Now married:
100.0% (74)Unmarried:
0.0% (0)
Women who did not give birth in the past 12 months Now married:
65.1% (491)Unmarried:
34.9% (264)
Marital status - Two or more races population 15 years and over
Males 50.8% Never married49.2% Now married0.0% Separated0.0% Widowed0.0% DivorcedFemales 36.9% Never married33.2% Now married0.0% Separated18.1% Widowed11.9% DivorcedWomen who gave birth in the past 12 months Now married:
100.0% (12)Unmarried:
0.0% (0)
Women who did not give birth in the past 12 months Now married:
29.8% (135)Unmarried:
70.2% (317)
Marital status - White alone, not Hispanic / Latino population 15 years and over
Males 31.1% Never married58.0% Now married0.9% Separated4.7% Widowed5.2% DivorcedFemales 25.1% Never married49.1% Now married0.9% Separated13.0% Widowed11.9% DivorcedWomen who gave birth in the past 12 months Now married:
84.2% (148)Unmarried:
15.8% (28)
Women who did not give birth in the past 12 months Now married:
42.8% (1,649)Unmarried:
57.2% (2,201)
Marital status - Hispanic or Latino population 15 years and over
Males 34.0% Never married55.3% Now married1.1% Separated0.0% Widowed9.6% DivorcedFemales 29.1% Never married54.5% Now married3.8% Separated7.0% Widowed5.6% DivorcedWomen who gave birth in the past 12 months Now married:
100.0% (49)Unmarried:
0.0% (0)
Women who did not give birth in the past 12 months Now married:
52.9% (570)Unmarried:
47.1% (507)
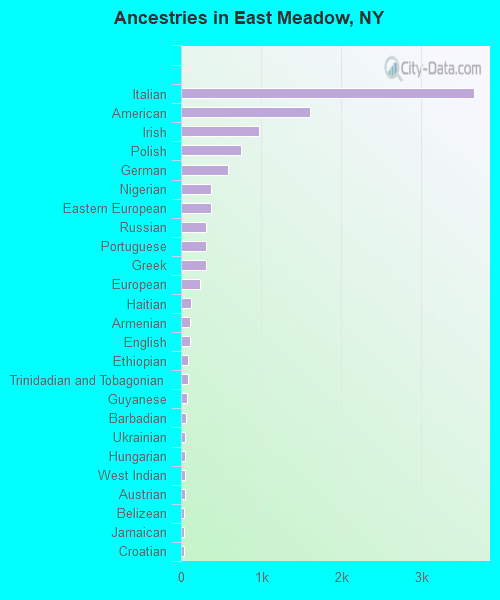
Ancestries in East Meadow
3,663 18.5% Italian1,608 8.1% American978 4.9% Irish754 3.8% Polish593 3.0% German378 1.9% Nigerian375 1.9% Eastern European314 1.6% Russian312 1.6% Portuguese312 1.6% Greek234 1.2% European123 0.6% Haitian114 0.6% Armenian112 0.6% English87 0.4% Ethiopian84 0.4% Trinidadian and Tobagonian74 0.4% Guyanese58 0.3% Barbadian50 0.3% Ukrainian49 0.2% Hungarian49 0.2% West Indian48 0.2% Austrian43 0.2% Belizean42 0.2% Jamaican40 0.2% Croatian32 0.2% Brazilian30 0.2% Cypriot27 0.1% Afghan22 0.1% Romanian15 0.08% Scotch-Irish13 0.07% Dutch12 0.06% Israeli10 0.05% Arab9 0.05% French7 0.04% Albanian6 0.03% Northern European6 0.03% Scottish6 0.03% Egyptian5 0.03% French Canadian3 0.02% African1 0.01% Scandinavian
Geographical mobility in East Meadow Same house 1 year ago 20,515 93.0% White (Caucasian)1,323 78.3% Black or African American8 100.0% American Indian / Alaska Native6,558 89.9% Asian8 89.7% Native Hawaiian / Pacific Islander2,660 89.0% Other race1,585 80.7% Two or more races20,222 93.1% White alone, not Hispanic / Latino4,318 89.7% Hispanic or LatinoMoved within same county 620 2.8% White / Caucasian69 4.1% Black or African American97 1.3% Asian112 3.7% Other race262 13.3% Two or more races567 2.6% White alone, not Hispanic / Latino145 3.0% Hispanic or LatinoMoved within same state 797 3.6% White / Caucasian312 18.5% Black or African American645 8.8% Asian138 4.6% Other race149 7.6% Two or more races815 3.8% White alone, not Hispanic / Latino278 5.8% Hispanic or LatinoMoved from different state 79 0.4% White / Caucasian9 0.5% Two or more races63 0.3% White alone, not Hispanic / Latino18 0.4% Hispanic or LatinoMoved from abroad 75 0.3% White13 0.8% Black or African American43 0.6% Asian78 0.4% White alone, not Hispanic / Latino
Children Nativity (place of birth) in East Meadow
Children under 6 years - Living with two parents Both parents native 1,032 100.0% NativeBoth parents foreign-born 626 100.0% NativeOne native, one foreign-born parent 556 100.0% NativeChildren under 6 years - Living with one parent Native parent 204 100.0% NativeForeign-born parent 82 100.0% NativeChildren 6 to 17 years - Living with two parents Both parents native 1,986 100.0% NativeBoth parents foreign-born 1,070 97.5% Native28 2.5% Foreign-bornOne native, one foreign-born parent 739 100.0% NativeChildren 6 to 17 years - Living with one parent Native parent 588 100.0% NativeForeign-born parent 269 54.8% Native221 45.2% Foreign-born
Grandparents responsible for own grandchildren in East Meadow
Grandparents (30 to 59 years) White / Caucasian 58 69.6% Responsible for grandchildren25 30.4% Not responsible for grandchildrenAsian 27 100.0% Not responsible for grandchildrenTwo or more races 8 100.0% Not responsible for grandchildrenWhite alone, not Hispanic / Latino 24 59.6% Responsible for grandchildren16 40.4% Not responsible for grandchildrenHispanic or Latino 43 87.2% Responsible for grandchildren6 12.8% Not responsible for grandchildrenGrandparents (60 years and over) White / Caucasian 76 17.2% Responsible for grandchildren365 82.8% Not responsible for grandchildrenAsian 115 30.0% Responsible for grandchildren268 70.0% Not responsible for grandchildrenTwo or more races 24 100.0% Responsible for grandchildrenWhite alone, not Hispanic / Latino 72 17.1% Responsible for grandchildren347 82.9% Not responsible for grandchildrenHispanic or Latino 24 8.6% Responsible for grandchildren255 91.4% Not responsible for grandchildren