Races in East Millcreek, Utah (UT) Detailed Stats
Ancestries, Foreign-born residents, place of birth

Recent posts about races in East Millcreek, Utah on our local forum with over 2,400,000 registered users:
 | Which neighborhoods to tour before a potential move (33 replies) |
| Relocating to SLC in late fall (9 replies) |
| Philly to SLC Relocation - Best LIBERAL places to live (16 replies) |
| Best Place to Live in SLC/Ogden/Provo Metro (22 replies) |
| Best east bench neighborhood for young family (14 replies) |
| Moving to STL with 4 boys and husband at U of U (16 replies) |
4.9% of East Millcreek, UT residents are foreign-born (2.7% born in Europe, 1.2% born in Asia, 0.6% born in Latin America), which is 64.0% less than the foreign-born rate of 8.0% across the entire state of Utah.
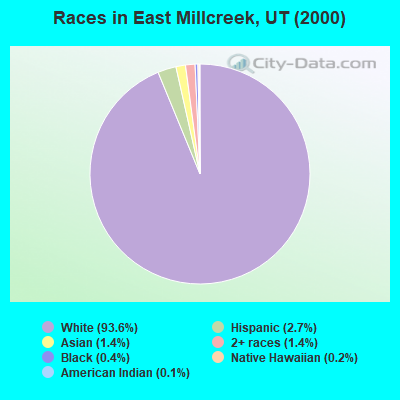
Race distribution in East Millcreek

- 20,00893.6%White alone
- 5862.7%Hispanic
- 2941.4%Two or more races
- 3061.4%Asian alone
- 890.4%Black alone
- 530.2%Native Hawaiian and Other
Pacific Islander alone - 280.1%American Indian alone
- 210.10%Other race alone
2000
2022
-
- 1,904,26585.3%White alone
- 201,5599.0%Hispanic
- 36,4831.6%Asian alone
- 31,3081.4%Two or more races
- 26,6631.2%American Indian alone
- 14,8060.7%Native Hawaiian and Other
Pacific Islander alone - 16,1370.7%Black alone
- 1,9480.09%Other race alone

-
- 2,557,46675.6%White alone
- 512,08615.1%Hispanic
- 119,3083.5%Two or more races
- 82,3882.4%Asian alone
- 36,9781.1%Native Hawaiian and Other
Pacific Islander alone - 34,8731.0%Black alone
- 22,8030.7%American Indian alone
- 14,8980.4%Other race alone

Income and house value in East Millcreek
- Median household income in 2022
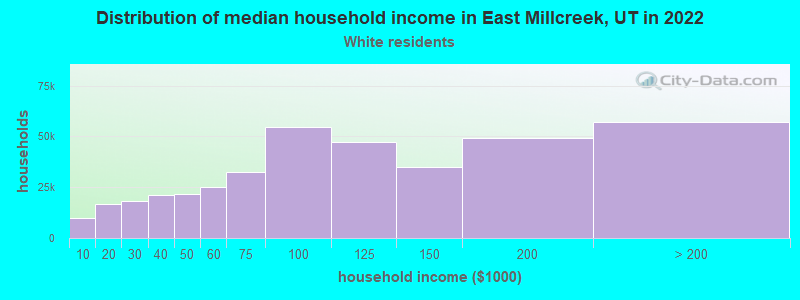
- $113,592White non-Hispanic householders
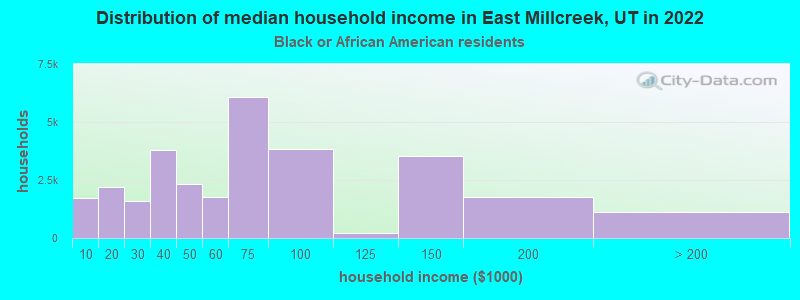
- $184,045Black householders
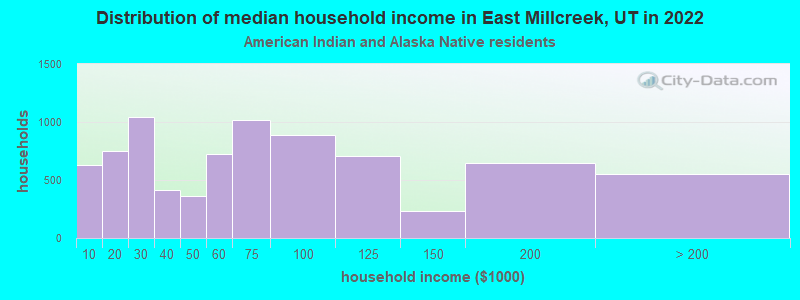
- $44,373American Indian and Alaska Native householders
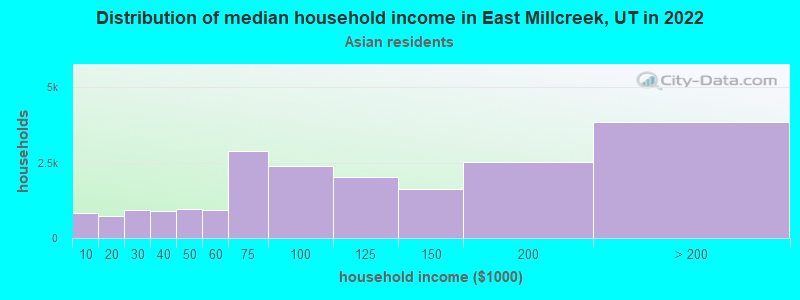
- $111,883Asian householders
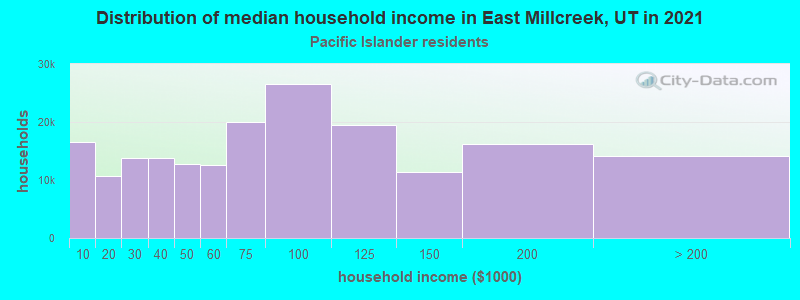
- $74,632Native Hawaiian and other Pacific Islander householders
- $44,440Some other race householders
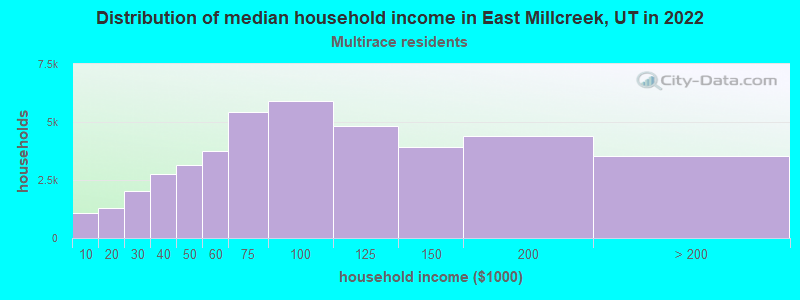
- $100,908Two or more races householders
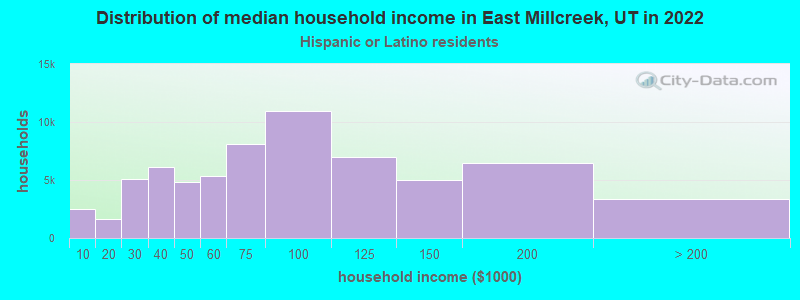
- $76,809Hispanic or Latino race householders
- Median 2022 house value
- $727,780White Non-Hispanic householders
- $226,885Black or African American householders
- $572,101Asian householders
- $479,951Native Hawaiian and other Pacific Islander householders
- $648,195Two or more races householders
- over $1,000,000Hispanic or Latino householders
Household income for White non-Hispanic householders
Household income for Black householders
Household income for American Indian and Alaska Native householders
Household income for Asian householders
Household income for Native Hawaiian and other Pacific Islander householders
Household income for Two or more races householders
Household income for Hispanic or Latino race householders
Foreign-born residents in East Millcreek
1,043 residents are foreign born (2.7% Europe, 1.2% Asia, 0.6% Latin America).
| This city: | 4.9% |
| Utah: | 7.1% |
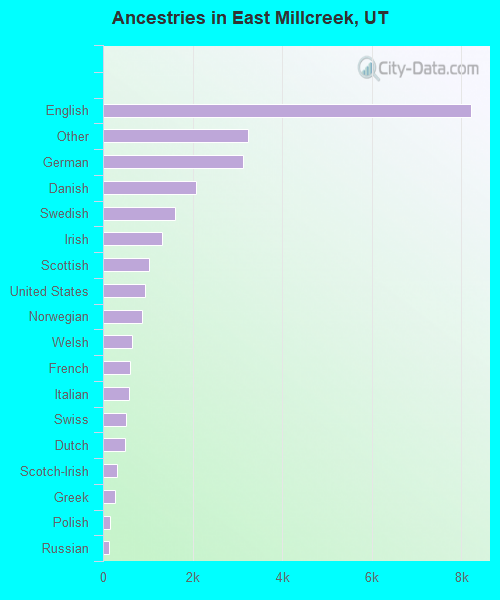
Ancestries in East Millcreek

- 8,21031.1%English
- 3,24012.3%Other
- 3,13511.9%German
- 2,0787.9%Danish
- 1,5996.1%Swedish
- 1,3095.0%Irish
- 1,0233.9%Scottish
- 9423.6%United States
- 8693.3%Norwegian
- 6382.4%Welsh
- 5922.2%French
- 5722.2%Italian
- 5061.9%Swiss
- 4851.8%Dutch
- 3121.2%Scotch-Irish
- 2791.1%Greek
- 1620.6%Polish
- 1280.5%Russian
- 500.2%Czech
- 440.2%Slovak
- 420.2%Subsaharan African
- 410.2%Arab
- 380.1%French Canadian
- 330.1%Ukrainian
- 190.07%Lithuanian
- 160.06%Hungarian
- 110.04%Portuguese
Zip codes: 84109.