Races in East Wenatchee, Washington (WA) Detailed Stats
Data:
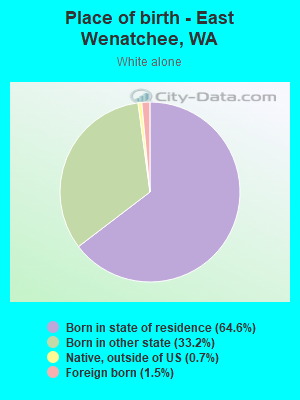
Races - White alone (%)
Races - White alone (% change since 2000)
Races - Black alone (%)
Races - Black alone (% change since 2000)
Races - American Indian alone (%)
Races - American Indian alone (% change since 2000)
Races - Asian alone (%)
Races - Asian alone (% change since 2000)
Races - Hispanic (%)
Races - Hispanic (% change since 2000)
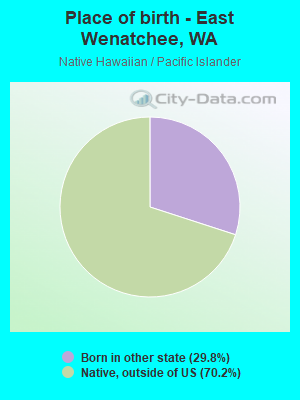
Races - Native Hawaiian and Other Pacific Islander alone (%)
Races - Native Hawaiian and Other Pacific Islander alone (% change since 2000)
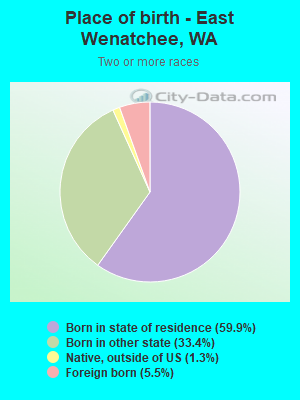
Races - Two or more races(%)
Races - Two or more races(% change since 2000)
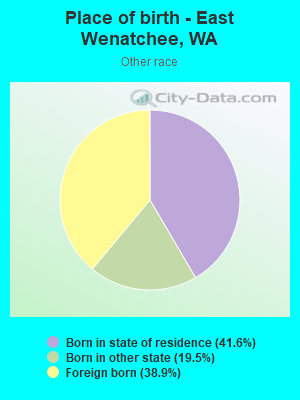
Races - Other race alone (%)
Races - Other race alone (% change since 2000)
Racial diversity
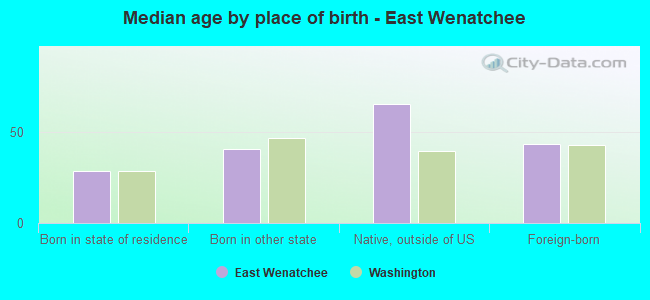
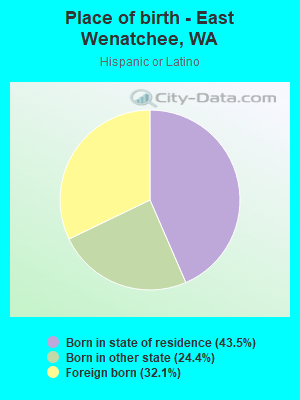
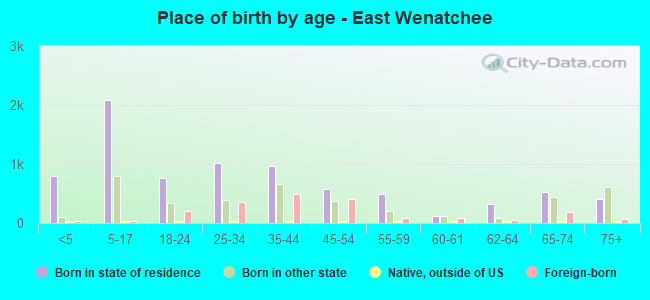
Place of birth - Born in state of residence (%)
Place of birth - Born in state of residence (%) - White
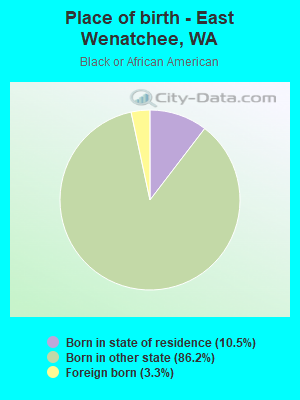
Place of birth - Born in state of residence (%) - Black or African American
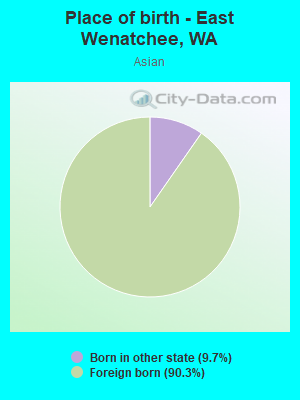
Place of birth - Born in state of residence (%) - Asian
Place of birth - Born in state of residence (%) - Hispanic or Latino
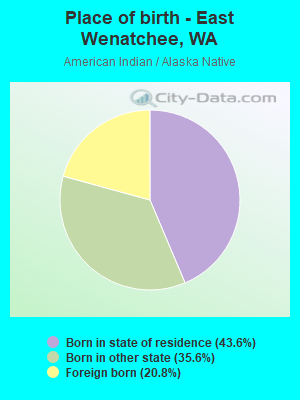
Place of birth - Born in state of residence (%) - American Indian and Alaska Native
Place of birth - Born in state of residence (%) - Multirace
Place of birth - Born in state of residence (%) - Other Race
Place of birth - Born in other state (%)
Place of birth - Born in other state (%) - White
Place of birth - Born in other state (%) - Black or African American
Place of birth - Born in other state (%) - Asian
Place of birth - Born in other state (%) - Hispanic or Latino
Place of birth - Born in other state (%) - American Indian and Alaska Native
Place of birth - Born in other state (%) - Multirace
Place of birth - Born in other state (%) - Other Race
Place of birth - Native, outside of US (%)
Place of birth - Native, outside of US (%) - White
Place of birth - Native, outside of US (%) - Black or African American
Place of birth - Native, outside of US (%) - Asian
Place of birth - Native, outside of US (%) - Hispanic or Latino
Place of birth - Native, outside of US (%) - American Indian and Alaska Native
Place of birth - Native, outside of US (%) - Multirace
Place of birth - Native, outside of US (%) - Other Race
Place of birth - Foreign born (%)
Place of birth - Foreign born (%) - White
Place of birth - Foreign born (%) - Black or African American
Place of birth - Foreign born (%) - Asian
Place of birth - Foreign born (%) - Hispanic or Latino
Place of birth - Foreign born (%) - American Indian and Alaska Native
Place of birth - Foreign born (%) - Multirace
Place of birth - Foreign born (%) - Other Race
Residents speaking English at home (%)
Residents speaking English at home - Born in the United States (%)
Residents speaking English at home - Native, born elsewhere (%)
Residents speaking English at home - Foreign born (%)
Residents speaking Spanish at home (%)
Residents speaking Spanish at home - Born in the United States (%)
Residents speaking Spanish at home - Native, born elsewhere (%)
Residents speaking Spanish at home - Foreign born (%)
Residents speaking other language at home (%)
Residents speaking other language at home - Born in the United States (%)
Residents speaking other language at home - Native, born elsewhere (%)
Residents speaking other language at home - Foreign born (%)
Marital status - Never married (%)
Marital status - Now married (%)
Marital status - Separated (%)
Marital status - Widowed (%)
Marital status - Divorced (%)
Ancestries Reported - Arab (%)
Ancestries Reported - Czech (%)
Ancestries Reported - Danish (%)
Ancestries Reported - Dutch (%)
Ancestries Reported - English (%)
Ancestries Reported - French (%)
Ancestries Reported - French Canadian (%)
Ancestries Reported - German (%)
Ancestries Reported - Greek (%)
Ancestries Reported - Hungarian (%)
Ancestries Reported - Irish (%)
Ancestries Reported - Italian (%)
Ancestries Reported - Lithuanian (%)
Ancestries Reported - Norwegian (%)
Ancestries Reported - Polish (%)
Ancestries Reported - Portuguese (%)
Ancestries Reported - Russian (%)
Ancestries Reported - Scotch-Irish (%)
Ancestries Reported - Scottish (%)
Ancestries Reported - Slovak (%)
Ancestries Reported - Subsaharan African (%)
Ancestries Reported - Swedish (%)
Ancestries Reported - Swiss (%)
Ancestries Reported - Ukrainian (%)
Ancestries Reported - United States (%)
Ancestries Reported - Welsh (%)
Ancestries Reported - West Indian (%)
Ancestries Reported - Other (%)
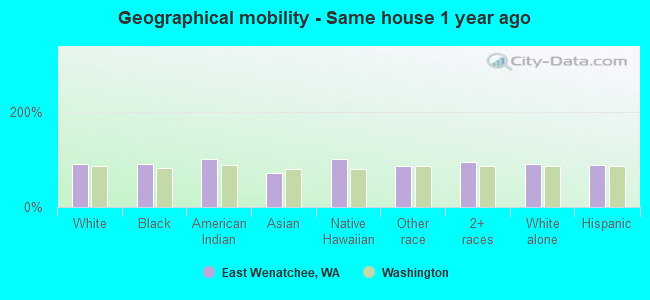
Geographical mobility - Same house 1 year ago (%)
Geographical mobility - Same house 1 year ago (%) - White
Geographical mobility - Same house 1 year ago (%) - Black or African American
Geographical mobility - Same house 1 year ago (%) - Asian
Geographical mobility - Same house 1 year ago (%) - Hispanic or Latino
Geographical mobility - Same house 1 year ago (%) - American Indian and Alaska Native
Geographical mobility - Same house 1 year ago (%) - Multirace
Geographical mobility - Same house 1 year ago (%) - Other Race
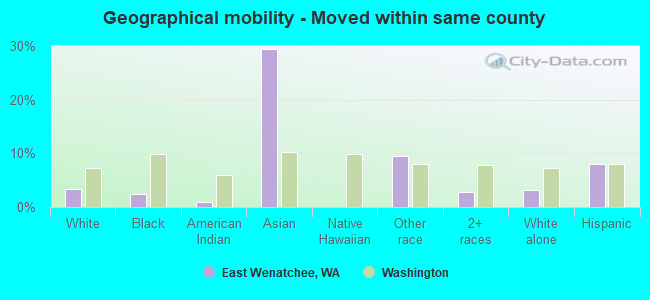
Geographical mobility - Moved within same county (%)
Geographical mobility - Moved within same county (%) - White
Geographical mobility - Moved within same county (%) - Black or African American
Geographical mobility - Moved within same county (%) - Asian
Geographical mobility - Moved within same county (%) - Hispanic or Latino
Geographical mobility - Moved within same county (%) - American Indian and Alaska Native
Geographical mobility - Moved within same county (%) - Multirace
Geographical mobility - Moved within same county (%) - Other Race
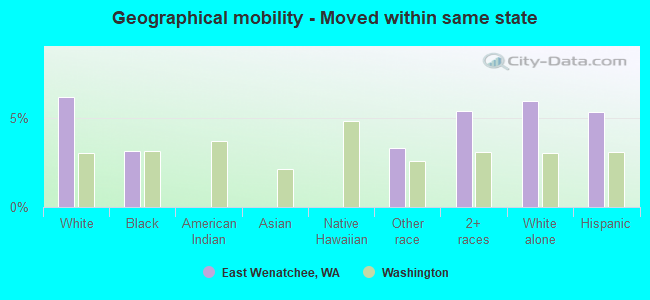
Geographical mobility - Moved from different county within same state (%)
Geographical mobility - Moved from different county within same state (%) - White
Geographical mobility - Moved from different county within same state (%) - Black or African American
Geographical mobility - Moved from different county within same state (%) - Asian
Geographical mobility - Moved from different county within same state (%) - Hispanic or Latino
Geographical mobility - Moved from different county within same state (%) - American Indian and Alaska Native
Geographical mobility - Moved from different county within same state (%) - Multirace
Geographical mobility - Moved from different county within same state (%) - Other Race
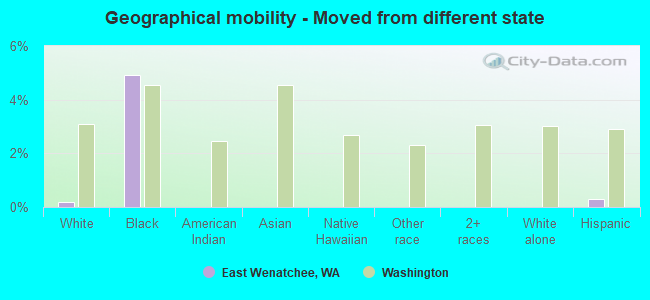
Geographical mobility - Moved from different state (%)
Geographical mobility - Moved from different state (%) - White
Geographical mobility - Moved from different state (%) - Black or African American
Geographical mobility - Moved from different state (%) - Asian
Geographical mobility - Moved from different state (%) - Hispanic or Latino
Geographical mobility - Moved from different state (%) - American Indian and Alaska Native
Geographical mobility - Moved from different state (%) - Multirace
Geographical mobility - Moved from different state (%) - Other Race
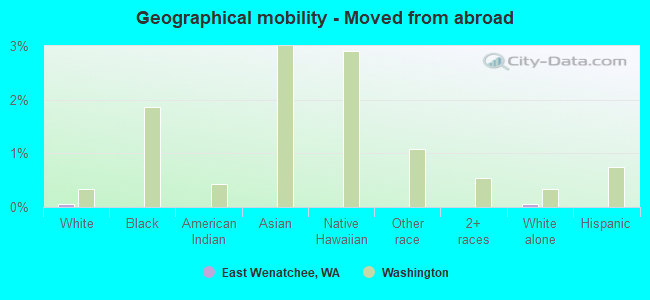
Geographical mobility - Moved from abroad (%)
Geographical mobility - Moved from abroad (%) - White
Geographical mobility - Moved from abroad (%) - Black or African American
Geographical mobility - Moved from abroad (%) - Asian
Geographical mobility - Moved from abroad (%) - Hispanic or Latino
Geographical mobility - Moved from abroad (%) - American Indian and Alaska Native
Geographical mobility - Moved from abroad (%) - Multirace
Geographical mobility - Moved from abroad (%) - Other Race
Place of birth for the foreign-born population - Ireland (%)
Place of birth for the foreign-born population - Denmark (%)
Place of birth for the foreign-born population - Norway (%)
Place of birth for the foreign-born population - Sweden (%)
Place of birth for the foreign-born population - United Kingdom (%)
Place of birth for the foreign-born population - England (%)
Place of birth for the foreign-born population - Scotland (%)
Place of birth for the foreign-born population - Other Northern Europe (%)
Place of birth for the foreign-born population - Austria (%)
Place of birth for the foreign-born population - Belgium (%)
Place of birth for the foreign-born population - France (%)
Place of birth for the foreign-born population - Germany (%)
Place of birth for the foreign-born population - Netherlands (%)
Place of birth for the foreign-born population - Switzerland (%)
Place of birth for the foreign-born population - Other Western Europe (%)
Place of birth for the foreign-born population - Greece (%)
Place of birth for the foreign-born population - Italy (%)
Place of birth for the foreign-born population - Portugal (%)
Place of birth for the foreign-born population - Spain (%)
Place of birth for the foreign-born population - Other Southern Europe (%)
Place of birth for the foreign-born population - Albania (%)
Place of birth for the foreign-born population - Belarus (%)
Place of birth for the foreign-born population - Bosnia and Herzegovina (%)
Place of birth for the foreign-born population - Bulgaria (%)
Place of birth for the foreign-born population - Croatia (%)
Place of birth for the foreign-born population - Czechoslovakia (%)
Place of birth for the foreign-born population - Hungary (%)
Place of birth for the foreign-born population - Latvia (%)
Place of birth for the foreign-born population - Lithuania (%)
Place of birth for the foreign-born population - North Macedonia (Macedonia) (%)
Place of birth for the foreign-born population - Moldova (%)
Place of birth for the foreign-born population - Poland (%)
Place of birth for the foreign-born population - Romania (%)
Place of birth for the foreign-born population - Russia (%)
Place of birth for the foreign-born population - Serbia (%)
Place of birth for the foreign-born population - Ukraine (%)
Place of birth for the foreign-born population - Other Eastern Europe (%)
Place of birth for the foreign-born population - China (%)
Place of birth for the foreign-born population - Hong Kong (%)
Place of birth for the foreign-born population - Taiwan (%)
Place of birth for the foreign-born population - Japan (%)
Place of birth for the foreign-born population - Korea (%)
Place of birth for the foreign-born population - Other Eastern Asia (%)
Place of birth for the foreign-born population - Afghanistan (%)
Place of birth for the foreign-born population - Bangladesh (%)
Place of birth for the foreign-born population - India (%)
Place of birth for the foreign-born population - Iran (%)
Place of birth for the foreign-born population - Kazakhstan (%)
Place of birth for the foreign-born population - Nepal (%)
Place of birth for the foreign-born population - Pakistan (%)
Place of birth for the foreign-born population - Sri Lanka (%)
Place of birth for the foreign-born population - Uzbekistan (%)
Place of birth for the foreign-born population - Other South Central Asia (%)
Place of birth for the foreign-born population - Burma (%)
Place of birth for the foreign-born population - Cambodia (%)
Place of birth for the foreign-born population - Indonesia (%)
Place of birth for the foreign-born population - Laos (%)
Place of birth for the foreign-born population - Malaysia (%)
Place of birth for the foreign-born population - Philippines (%)
Place of birth for the foreign-born population - Singapore (%)
Place of birth for the foreign-born population - Thailand (%)
Place of birth for the foreign-born population - Vietnam (%)
Place of birth for the foreign-born population - Other South Eastern Asia (%)
Place of birth for the foreign-born population - Armenia (%)
Place of birth for the foreign-born population - Iraq (%)
Place of birth for the foreign-born population - Israel (%)
Place of birth for the foreign-born population - Jordan (%)
Place of birth for the foreign-born population - Kuwait (%)
Place of birth for the foreign-born population - Lebanon (%)
Place of birth for the foreign-born population - Saudi Arabia (%)
Place of birth for the foreign-born population - Syria (%)
Place of birth for the foreign-born population - Turkey (%)
Place of birth for the foreign-born population - Yemen (%)
Place of birth for the foreign-born population - Other Western Asia (%)
Place of birth for the foreign-born population - Eritrea (%)
Place of birth for the foreign-born population - Ethiopia (%)
Place of birth for the foreign-born population - Kenya (%)
Place of birth for the foreign-born population - Somalia (%)
Place of birth for the foreign-born population - Uganda (%)
Place of birth for the foreign-born population - Zimbabwe (%)
Place of birth for the foreign-born population - Other Eastern Africa (%)
Place of birth for the foreign-born population - Cameroon (%)
Place of birth for the foreign-born population - Congo (%)
Place of birth for the foreign-born population - Democratic Republic of Congo (Zaire) (%)
Place of birth for the foreign-born population - Other Middle Africa (%)
Place of birth for the foreign-born population - Egypt (%)
Place of birth for the foreign-born population - Morocco (%)
Place of birth for the foreign-born population - Sudan (%)
Place of birth for the foreign-born population - Other Northern Africa (%)
Place of birth for the foreign-born population - South Africa (%)
Place of birth for the foreign-born population - Other Southern Africa (%)
Place of birth for the foreign-born population - Cabo Verde (%)
Place of birth for the foreign-born population - Ghana (%)
Place of birth for the foreign-born population - Liberia (%)
Place of birth for the foreign-born population - Nigeria (%)
Place of birth for the foreign-born population - Senegal (%)
Place of birth for the foreign-born population - Sierra Leone (%)
Place of birth for the foreign-born population - Other Western Africa (%)
Place of birth for the foreign-born population - Australia (%)
Place of birth for the foreign-born population - New Zealand (%)
Place of birth for the foreign-born population - Fiji (%)
Place of birth for the foreign-born population - Micronesia (%)
Place of birth for the foreign-born population - Bahamas (%)
Place of birth for the foreign-born population - Barbados (%)
Place of birth for the foreign-born population - Cuba (%)
Place of birth for the foreign-born population - Dominica (%)
Place of birth for the foreign-born population - Dominican Republic (%)
Place of birth for the foreign-born population - Grenada (%)
Place of birth for the foreign-born population - Haiti (%)
Place of birth for the foreign-born population - Jamaica (%)
Place of birth for the foreign-born population - St. Vincent and the Grenadines (%)
Place of birth for the foreign-born population - Trinidad and Tobago (%)
Place of birth for the foreign-born population - West Indies (%)
Place of birth for the foreign-born population - Other Caribbean (%)
Place of birth for the foreign-born population - Belize (%)
Place of birth for the foreign-born population - Costa Rica (%)
Place of birth for the foreign-born population - El Salvador (%)
Place of birth for the foreign-born population - Guatemala (%)
Place of birth for the foreign-born population - Honduras (%)
Place of birth for the foreign-born population - Mexico (%)
Place of birth for the foreign-born population - Nicaragua (%)
Place of birth for the foreign-born population - Panama (%)
Place of birth for the foreign-born population - Other Central America (%)
Place of birth for the foreign-born population - Argentina (%)
Place of birth for the foreign-born population - Bolivia (%)
Place of birth for the foreign-born population - Brazil (%)
Place of birth for the foreign-born population - Chile (%)
Place of birth for the foreign-born population - Colombia (%)
Place of birth for the foreign-born population - Ecuador (%)
Place of birth for the foreign-born population - Guyana (%)
Place of birth for the foreign-born population - Peru (%)
Place of birth for the foreign-born population - Uruguay (%)
Place of birth for the foreign-born population - Venezuela (%)
Place of birth for the foreign-born population - Other South America (%)
Place of birth for the foreign-born population - Canada (%)
Place of birth for the foreign-born population - Other Northern America (%)
Place of birth for the foreign-born population - Other (%)
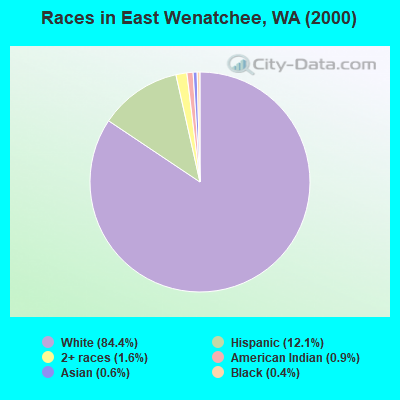
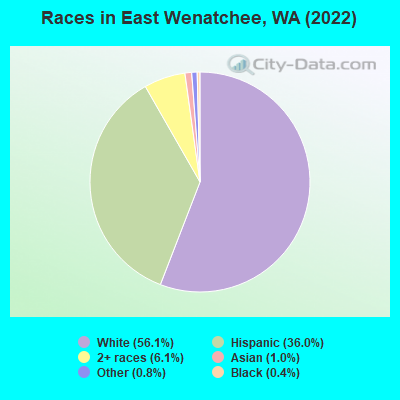
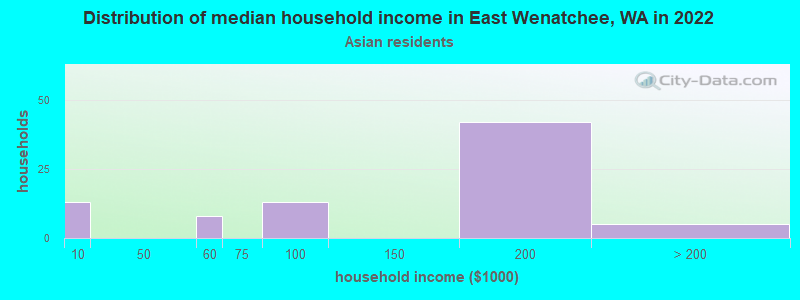
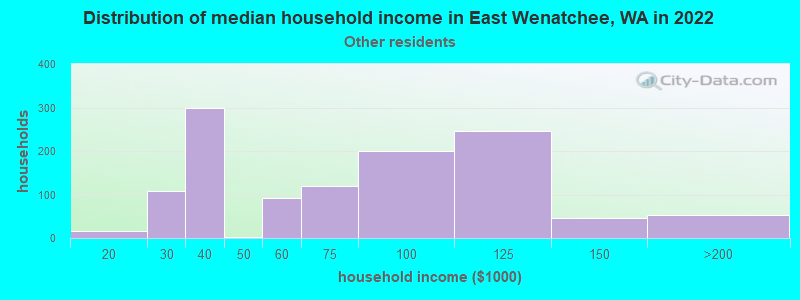
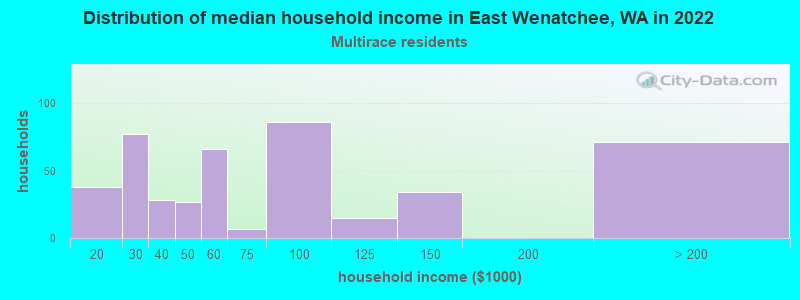
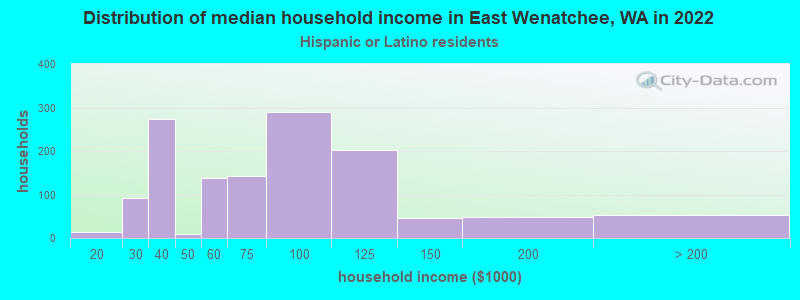
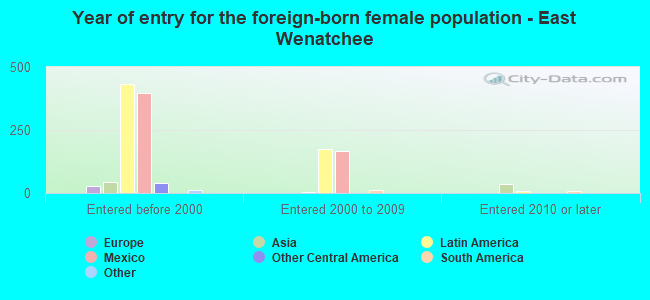
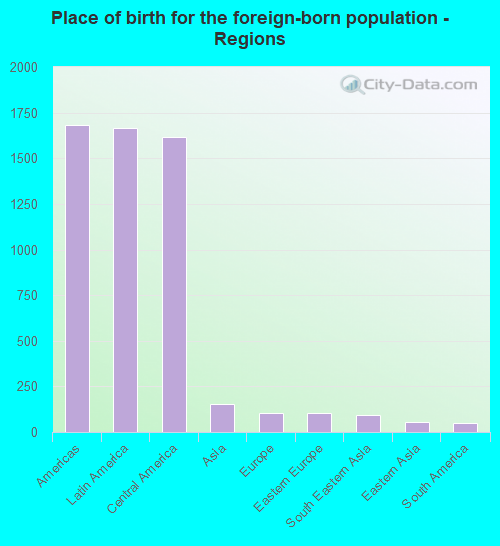
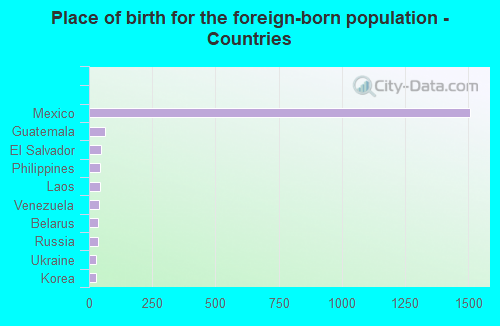
According to 2022 data, the most numerous races in East Wenatchee, WA are White alone (7,990 residents), Hispanic (5,125 residents), and Asian alone (146 residents). 73.7% of East Wenatchee residents speak English at home. 13.6% of East Wenatchee, WA residents are foreign-born (11.4% born in Latin America), which is 10.1% less than the foreign-born rate of 15.0% across the entire state of Washington.
Race distribution in East Wenatchee
2000 2022
4,652,490 78.9% White alone 441,509 7.5% Hispanic 319,401 5.4% Asian alone 184,631 3.1% Black alone 175,926 3.0% Two or more races 85,396 1.4% American Indian alone 22,779 0.4% Native Hawaiian and Other 11,989 0.2% Other race alone
4,941,456 63.5% White alone 1,093,313 14.0% Hispanic 755,832 9.7% Asian alone 523,448 6.7% Two or more races 299,537 3.8% Black alone 69,024 0.9% American Indian alone 52,231 0.7% Native Hawaiian and Other 50,945 0.7% Other race alone
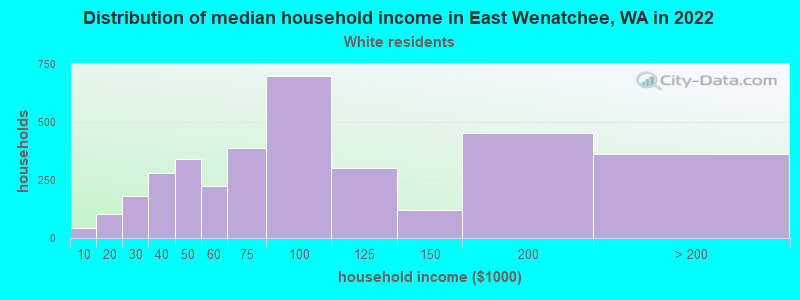
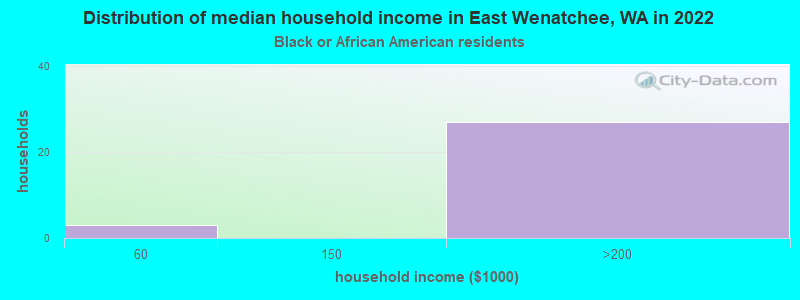
Income and house value in East Wenatchee Median household income in 2022 $82,781 White non-Hispanic householders$174,707 Asian householders$66,554 Some other race householders$53,180 Two or more races householders$72,867 Hispanic or Latino race householdersMedian 2022 house value $467,527 White Non-Hispanic householders $733,568 Asian householders$448,291 Some other race householders$309,728 Two or more races householders$421,231 Hispanic or Latino householders
Median age by race in East Wenatchee
42.6 Median age for White residents41.1 44.1 21.8 Median age for Black or African American residents21.5 25.1 33.8 Median age for American Indian / Alaska Native residents59.6 33.0 40.3 Median age for Asian residents40.4 60.6 40.4 Median age for Native Hawaiian / Pacific Islander residents41.3 -666,666,666.0 24.1 Median age for Other race residents23.1 26.6 20.6 Median age for Two or more races residents15.8 30.7 43.2 Median age for White alone residents41.7 44.9 23.9 Median age for Hispanic or Latino residents23.0 24.6
Owner/renter occupied households by race in East Wenatchee
House owners and renters - White residents 2,255 64.1% Owner occupied1,264 35.9% Renter occupiedHouse owners and renters - Black or African American residents 27 100.0% Owner occupiedHouse owners and renters - American Indian / Alaska Native residents 21 100.0% Owner occupiedHouse owners and renters - Asian residents 67 83.8% Owner occupied13 16.2% Renter occupiedHouse owners and renters - Other race residents 618 51.7% Owner occupied577 48.3% Renter occupiedHouse owners and renters - Two or more races residents 240 48.2% Owner occupied258 51.8% Renter occupiedHouse owners and renters - White alone residents 2,218 63.6% Owner occupied1,270 36.4% Renter occupiedHouse owners and renters - Hispanic or Latino residents 728 54.1% Owner occupied618 45.9% Renter occupied
Language usage in East Wenatchee
English speakers - Total 73.7% of residents of East Wenatchee speak English at home.
23.9% of residents speak Spanish at home 1,827 57.2% Speak English very well1,366 42.8% Speak English less than very well2.2% of residents speak other language at home 175 60.3% Speak English very well115 39.7% Speak English less than very well
English speakers - Born in the United States 84.6% of residents of East Wenatchee speak English at home.
15.0% of residents speak Spanish at home 596 99.2% Speak English very well5 0.8% Speak English less than very well1.0% of residents speak other language at home 39 100.0% Speak English very well
English speakers - Native, born elsewhere 80.9% of residents of East Wenatchee speak English at home.
16.2% of residents speak other language at home 7 63.6% Speak English very well4 36.4% Speak English less than very well
English speakers - Foreign-born 6.7% of residents of East Wenatchee speak English at home.
80.3% of residents speak Spanish at home 349 22.4% Speak English very well1,209 77.6% Speak English less than very well11.4% of residents speak other language at home 112 50.5% Speak English very well110 49.5% Speak English less than very well
White (Caucasian) - Speak only English Native:
97.6% (7,547)Foreign-born:
8.9% (16)
White (Caucasian) - Speak another language Native:
2.6% (203)Foreign-born:
88.1% (160)
Black or African American - Speak another language Native:
5.4% (3)Foreign-born:
97.1% (2)
American Indian / Alaska Native - Speak another language Native:
100.0% (38)Foreign-born:
100.0% (22)
Asian - Speak only English Native:
98.3% (15)Foreign-born:
26.3% (38)
Other race - Speak only English Native:
37.6% (793)Foreign-born:
4.7% (75)
Other race - Speak another language Native:
61.8% (1,305)Foreign-born:
95.3% (1,505)
Two or more races - Speak only English Native:
86.7% (1,463)Foreign-born:
10.6% (12)
Two or more races - Speak another language Native:
11.6% (196)Foreign-born:
89.6% (99)
White alone - Speak only English Native:
97.4% (7,426)Foreign-born:
14.2% (17)
White alone - Speak another language Native:
2.6% (196)Foreign-born:
88.3% (103)
Hispanic or Latino - Speak only English Native:
52.2% (1,574)Foreign-born:
4.6% (76)
Hispanic or Latino - Speak another language Native:
47.6% (1,436)Foreign-born:
95.4% (1,566)
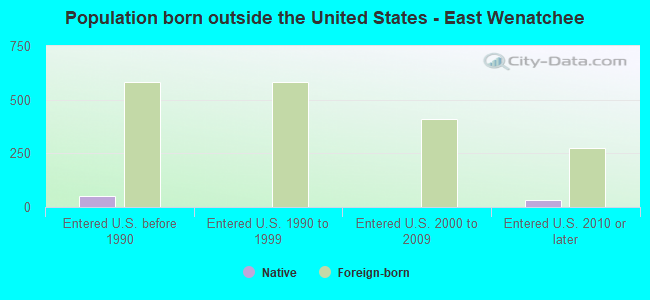
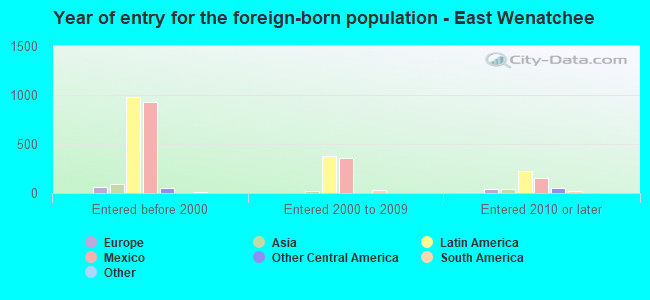
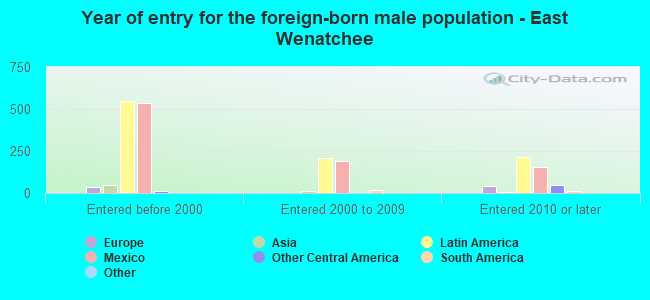
Foreign-born residents in East Wenatchee 1,941 residents are foreign born (11.4% Latin America ).
This city:
13.6%Washington:
14.9%
Marital status for residents in East Wenatchee Marital status - White (Caucasian) population 15 years and over
Males 24.6% Never married58.6% Now married2.4% Separated3.1% Widowed11.3% DivorcedFemales 18.3% Never married59.7% Now married0.2% Separated10.1% Widowed11.7% DivorcedWomen who gave birth in the past 12 months Now married:
75.0% (43)Unmarried:
25.0% (14)
Women who did not give birth in the past 12 months Now married:
54.6% (898)Unmarried:
45.4% (748)
Marital status - Black or African American population 15 years and over
Males 54.5% Never married45.5% Now married0.0% Separated0.0% Widowed0.0% DivorcedFemales 100.0% Never married0.0% Now married0.0% Separated0.0% Widowed0.0% DivorcedWomen who gave birth in the past 12 months Now married:
0.0% (0)Unmarried:
100.0% (1)
Women who did not give birth in the past 12 months Now married:
0.0% (0)Unmarried:
100.0% (7)
Marital status - American Indian / Alaska Native population 15 years and over
Males 4.5% Never married95.5% Now married0.0% Separated0.0% Widowed0.0% DivorcedFemales 0.0% Never married53.3% Now married0.0% Separated0.0% Widowed46.7% DivorcedWomen who gave birth in the past 12 months Now married:
0.0% (0)Unmarried:
100.0% (17)
Marital status - Asian population 15 years and over
Males 0.0% Never married100.0% Now married0.0% Separated0.0% Widowed0.0% DivorcedFemales 16.1% Never married64.4% Now married0.0% Separated6.9% Widowed12.6% DivorcedWomen who did not give birth in the past 12 months Now married:
32.4% (13)Unmarried:
67.6% (27)
Marital status - Other race population 15 years and over
Males 47.9% Never married38.1% Now married7.1% Separated0.0% Widowed7.0% DivorcedFemales 51.3% Never married24.7% Now married3.1% Separated2.8% Widowed18.0% DivorcedWomen who gave birth in the past 12 months Now married:
31.2% (12)Unmarried:
68.7% (26)
Women who did not give birth in the past 12 months Now married:
24.3% (299)Unmarried:
75.7% (932)
Marital status - Two or more races population 15 years and over
Males 39.2% Never married37.6% Now married19.8% Separated0.0% Widowed3.4% DivorcedFemales 28.4% Never married23.9% Now married5.5% Separated16.4% Widowed25.8% DivorcedWomen who did not give birth in the past 12 months Now married:
36.3% (139)Unmarried:
63.7% (245)
Marital status - White alone, not Hispanic / Latino population 15 years and over
Males 24.0% Never married58.9% Now married2.5% Separated3.2% Widowed11.3% DivorcedFemales 18.0% Never married59.2% Now married0.2% Separated10.4% Widowed12.1% DivorcedWomen who gave birth in the past 12 months Now married:
70.0% (34)Unmarried:
30.0% (15)
Women who did not give birth in the past 12 months Now married:
54.3% (882)Unmarried:
45.7% (744)
Marital status - Hispanic or Latino population 15 years and over
Males 48.4% Never married37.8% Now married8.1% Separated0.0% Widowed5.6% DivorcedFemales 47.1% Never married29.0% Now married4.1% Separated2.2% Widowed17.6% DivorcedWomen who gave birth in the past 12 months Now married:
21.7% (11)Unmarried:
78.3% (38)
Women who did not give birth in the past 12 months Now married:
28.0% (396)Unmarried:
72.0% (1,019)
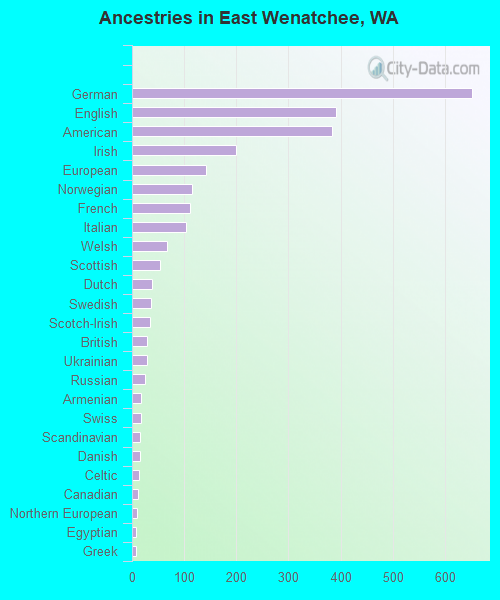
Ancestries in East Wenatchee
652 8.8% German391 5.3% English384 5.2% American200 2.7% Irish142 1.9% European116 1.6% Norwegian111 1.5% French104 1.4% Italian68 0.9% Welsh54 0.7% Scottish39 0.5% Dutch37 0.5% Swedish34 0.5% Scotch-Irish29 0.4% British28 0.4% Ukrainian24 0.3% Russian17 0.2% Armenian17 0.2% Swiss16 0.2% Scandinavian15 0.2% Danish14 0.2% Celtic11 0.1% Canadian9 0.1% Northern European8 0.1% Egyptian7 0.09% Greek6 0.08% Finnish5 0.07% Czechoslovakian4 0.05% French Canadian4 0.05% Slavic1 0.01% Kenyan
Children Nativity (place of birth) in East Wenatchee
Children under 6 years - Living with two parents Both parents native 418 100.0% NativeBoth parents foreign-born 34 100.0% NativeOne native, one foreign-born parent 88 100.0% NativeChildren under 6 years - Living with one parent Native parent 313 100.0% NativeForeign-born parent 124 100.0% NativeChildren 6 to 17 years - Living with two parents Both parents native 1,109 100.0% NativeBoth parents foreign-born 138 100.0% NativeOne native, one foreign-born parent 31 100.0% NativeChildren 6 to 17 years - Living with one parent Native parent 930 100.0% NativeForeign-born parent 354 51.1% Native338 48.9% Foreign-born
Grandparents responsible for own grandchildren in East Wenatchee
Grandparents (30 to 59 years) White / Caucasian 38 33.6% Responsible for grandchildren76 66.4% Not responsible for grandchildrenOther race 23 100.0% Not responsible for grandchildrenTwo or more races 5 100.0% Not responsible for grandchildrenWhite alone, not Hispanic / Latino 38 31.1% Responsible for grandchildren84 68.9% Not responsible for grandchildrenHispanic or Latino 22 100.0% Not responsible for grandchildrenGrandparents (60 years and over) White / Caucasian 77 67.4% Responsible for grandchildren37 32.6% Not responsible for grandchildrenOther race 97 100.0% Not responsible for grandchildrenWhite alone, not Hispanic / Latino 79 67.1% Responsible for grandchildren39 32.9% Not responsible for grandchildrenHispanic or Latino 141 100.0% Not responsible for grandchildren