Races in Eastlake, Ohio (OH) Detailed Stats
Data:
Races - White alone (%)
Races - White alone (% change since 2000)
Races - Black alone (%)
Races - Black alone (% change since 2000)
Races - American Indian alone (%)
Races - American Indian alone (% change since 2000)
Races - Asian alone (%)
Races - Asian alone (% change since 2000)
Races - Hispanic (%)
Races - Hispanic (% change since 2000)
Races - Native Hawaiian and Other Pacific Islander alone (%)
Races - Native Hawaiian and Other Pacific Islander alone (% change since 2000)
Races - Two or more races(%)
Races - Two or more races(% change since 2000)
Races - Other race alone (%)
Races - Other race alone (% change since 2000)
Racial diversity
Place of birth - Born in state of residence (%)
Place of birth - Born in state of residence (%) - White
Place of birth - Born in state of residence (%) - Black or African American
Place of birth - Born in state of residence (%) - Asian
Place of birth - Born in state of residence (%) - Hispanic or Latino
Place of birth - Born in state of residence (%) - American Indian and Alaska Native
Place of birth - Born in state of residence (%) - Multirace
Place of birth - Born in state of residence (%) - Other Race
Place of birth - Born in other state (%)
Place of birth - Born in other state (%) - White
Place of birth - Born in other state (%) - Black or African American
Place of birth - Born in other state (%) - Asian
Place of birth - Born in other state (%) - Hispanic or Latino
Place of birth - Born in other state (%) - American Indian and Alaska Native
Place of birth - Born in other state (%) - Multirace
Place of birth - Born in other state (%) - Other Race
Place of birth - Native, outside of US (%)
Place of birth - Native, outside of US (%) - White
Place of birth - Native, outside of US (%) - Black or African American
Place of birth - Native, outside of US (%) - Asian
Place of birth - Native, outside of US (%) - Hispanic or Latino
Place of birth - Native, outside of US (%) - American Indian and Alaska Native
Place of birth - Native, outside of US (%) - Multirace
Place of birth - Native, outside of US (%) - Other Race
Place of birth - Foreign born (%)
Place of birth - Foreign born (%) - White
Place of birth - Foreign born (%) - Black or African American
Place of birth - Foreign born (%) - Asian
Place of birth - Foreign born (%) - Hispanic or Latino
Place of birth - Foreign born (%) - American Indian and Alaska Native
Place of birth - Foreign born (%) - Multirace
Place of birth - Foreign born (%) - Other Race
Residents speaking English at home (%)
Residents speaking English at home - Born in the United States (%)
Residents speaking English at home - Native, born elsewhere (%)
Residents speaking English at home - Foreign born (%)
Residents speaking Spanish at home (%)
Residents speaking Spanish at home - Born in the United States (%)
Residents speaking Spanish at home - Native, born elsewhere (%)
Residents speaking Spanish at home - Foreign born (%)
Residents speaking other language at home (%)
Residents speaking other language at home - Born in the United States (%)
Residents speaking other language at home - Native, born elsewhere (%)
Residents speaking other language at home - Foreign born (%)
Marital status - Never married (%)
Marital status - Now married (%)
Marital status - Separated (%)
Marital status - Widowed (%)
Marital status - Divorced (%)
Ancestries Reported - Arab (%)
Ancestries Reported - Czech (%)
Ancestries Reported - Danish (%)
Ancestries Reported - Dutch (%)
Ancestries Reported - English (%)
Ancestries Reported - French (%)
Ancestries Reported - French Canadian (%)
Ancestries Reported - German (%)
Ancestries Reported - Greek (%)
Ancestries Reported - Hungarian (%)
Ancestries Reported - Irish (%)
Ancestries Reported - Italian (%)
Ancestries Reported - Lithuanian (%)
Ancestries Reported - Norwegian (%)
Ancestries Reported - Polish (%)
Ancestries Reported - Portuguese (%)
Ancestries Reported - Russian (%)
Ancestries Reported - Scotch-Irish (%)
Ancestries Reported - Scottish (%)
Ancestries Reported - Slovak (%)
Ancestries Reported - Subsaharan African (%)
Ancestries Reported - Swedish (%)
Ancestries Reported - Swiss (%)
Ancestries Reported - Ukrainian (%)
Ancestries Reported - United States (%)
Ancestries Reported - Welsh (%)
Ancestries Reported - West Indian (%)
Ancestries Reported - Other (%)
Geographical mobility - Same house 1 year ago (%)
Geographical mobility - Same house 1 year ago (%) - White
Geographical mobility - Same house 1 year ago (%) - Black or African American
Geographical mobility - Same house 1 year ago (%) - Asian
Geographical mobility - Same house 1 year ago (%) - Hispanic or Latino
Geographical mobility - Same house 1 year ago (%) - American Indian and Alaska Native
Geographical mobility - Same house 1 year ago (%) - Multirace
Geographical mobility - Same house 1 year ago (%) - Other Race
Geographical mobility - Moved within same county (%)
Geographical mobility - Moved within same county (%) - White
Geographical mobility - Moved within same county (%) - Black or African American
Geographical mobility - Moved within same county (%) - Asian
Geographical mobility - Moved within same county (%) - Hispanic or Latino
Geographical mobility - Moved within same county (%) - American Indian and Alaska Native
Geographical mobility - Moved within same county (%) - Multirace
Geographical mobility - Moved within same county (%) - Other Race
Geographical mobility - Moved from different county within same state (%)
Geographical mobility - Moved from different county within same state (%) - White
Geographical mobility - Moved from different county within same state (%) - Black or African American
Geographical mobility - Moved from different county within same state (%) - Asian
Geographical mobility - Moved from different county within same state (%) - Hispanic or Latino
Geographical mobility - Moved from different county within same state (%) - American Indian and Alaska Native
Geographical mobility - Moved from different county within same state (%) - Multirace
Geographical mobility - Moved from different county within same state (%) - Other Race
Geographical mobility - Moved from different state (%)
Geographical mobility - Moved from different state (%) - White
Geographical mobility - Moved from different state (%) - Black or African American
Geographical mobility - Moved from different state (%) - Asian
Geographical mobility - Moved from different state (%) - Hispanic or Latino
Geographical mobility - Moved from different state (%) - American Indian and Alaska Native
Geographical mobility - Moved from different state (%) - Multirace
Geographical mobility - Moved from different state (%) - Other Race
Geographical mobility - Moved from abroad (%)
Geographical mobility - Moved from abroad (%) - White
Geographical mobility - Moved from abroad (%) - Black or African American
Geographical mobility - Moved from abroad (%) - Asian
Geographical mobility - Moved from abroad (%) - Hispanic or Latino
Geographical mobility - Moved from abroad (%) - American Indian and Alaska Native
Geographical mobility - Moved from abroad (%) - Multirace
Geographical mobility - Moved from abroad (%) - Other Race
Place of birth for the foreign-born population - Ireland (%)
Place of birth for the foreign-born population - Denmark (%)
Place of birth for the foreign-born population - Norway (%)
Place of birth for the foreign-born population - Sweden (%)
Place of birth for the foreign-born population - United Kingdom (%)
Place of birth for the foreign-born population - England (%)
Place of birth for the foreign-born population - Scotland (%)
Place of birth for the foreign-born population - Other Northern Europe (%)
Place of birth for the foreign-born population - Austria (%)
Place of birth for the foreign-born population - Belgium (%)
Place of birth for the foreign-born population - France (%)
Place of birth for the foreign-born population - Germany (%)
Place of birth for the foreign-born population - Netherlands (%)
Place of birth for the foreign-born population - Switzerland (%)
Place of birth for the foreign-born population - Other Western Europe (%)
Place of birth for the foreign-born population - Greece (%)
Place of birth for the foreign-born population - Italy (%)
Place of birth for the foreign-born population - Portugal (%)
Place of birth for the foreign-born population - Spain (%)
Place of birth for the foreign-born population - Other Southern Europe (%)
Place of birth for the foreign-born population - Albania (%)
Place of birth for the foreign-born population - Belarus (%)
Place of birth for the foreign-born population - Bosnia and Herzegovina (%)
Place of birth for the foreign-born population - Bulgaria (%)
Place of birth for the foreign-born population - Croatia (%)
Place of birth for the foreign-born population - Czechoslovakia (%)
Place of birth for the foreign-born population - Hungary (%)
Place of birth for the foreign-born population - Latvia (%)
Place of birth for the foreign-born population - Lithuania (%)
Place of birth for the foreign-born population - North Macedonia (Macedonia) (%)
Place of birth for the foreign-born population - Moldova (%)
Place of birth for the foreign-born population - Poland (%)
Place of birth for the foreign-born population - Romania (%)
Place of birth for the foreign-born population - Russia (%)
Place of birth for the foreign-born population - Serbia (%)
Place of birth for the foreign-born population - Ukraine (%)
Place of birth for the foreign-born population - Other Eastern Europe (%)
Place of birth for the foreign-born population - China (%)
Place of birth for the foreign-born population - Hong Kong (%)
Place of birth for the foreign-born population - Taiwan (%)
Place of birth for the foreign-born population - Japan (%)
Place of birth for the foreign-born population - Korea (%)
Place of birth for the foreign-born population - Other Eastern Asia (%)
Place of birth for the foreign-born population - Afghanistan (%)
Place of birth for the foreign-born population - Bangladesh (%)
Place of birth for the foreign-born population - India (%)
Place of birth for the foreign-born population - Iran (%)
Place of birth for the foreign-born population - Kazakhstan (%)
Place of birth for the foreign-born population - Nepal (%)
Place of birth for the foreign-born population - Pakistan (%)
Place of birth for the foreign-born population - Sri Lanka (%)
Place of birth for the foreign-born population - Uzbekistan (%)
Place of birth for the foreign-born population - Other South Central Asia (%)
Place of birth for the foreign-born population - Burma (%)
Place of birth for the foreign-born population - Cambodia (%)
Place of birth for the foreign-born population - Indonesia (%)
Place of birth for the foreign-born population - Laos (%)
Place of birth for the foreign-born population - Malaysia (%)
Place of birth for the foreign-born population - Philippines (%)
Place of birth for the foreign-born population - Singapore (%)
Place of birth for the foreign-born population - Thailand (%)
Place of birth for the foreign-born population - Vietnam (%)
Place of birth for the foreign-born population - Other South Eastern Asia (%)
Place of birth for the foreign-born population - Armenia (%)
Place of birth for the foreign-born population - Iraq (%)
Place of birth for the foreign-born population - Israel (%)
Place of birth for the foreign-born population - Jordan (%)
Place of birth for the foreign-born population - Kuwait (%)
Place of birth for the foreign-born population - Lebanon (%)
Place of birth for the foreign-born population - Saudi Arabia (%)
Place of birth for the foreign-born population - Syria (%)
Place of birth for the foreign-born population - Turkey (%)
Place of birth for the foreign-born population - Yemen (%)
Place of birth for the foreign-born population - Other Western Asia (%)
Place of birth for the foreign-born population - Eritrea (%)
Place of birth for the foreign-born population - Ethiopia (%)
Place of birth for the foreign-born population - Kenya (%)
Place of birth for the foreign-born population - Somalia (%)
Place of birth for the foreign-born population - Uganda (%)
Place of birth for the foreign-born population - Zimbabwe (%)
Place of birth for the foreign-born population - Other Eastern Africa (%)
Place of birth for the foreign-born population - Cameroon (%)
Place of birth for the foreign-born population - Congo (%)
Place of birth for the foreign-born population - Democratic Republic of Congo (Zaire) (%)
Place of birth for the foreign-born population - Other Middle Africa (%)
Place of birth for the foreign-born population - Egypt (%)
Place of birth for the foreign-born population - Morocco (%)
Place of birth for the foreign-born population - Sudan (%)
Place of birth for the foreign-born population - Other Northern Africa (%)
Place of birth for the foreign-born population - South Africa (%)
Place of birth for the foreign-born population - Other Southern Africa (%)
Place of birth for the foreign-born population - Cabo Verde (%)
Place of birth for the foreign-born population - Ghana (%)
Place of birth for the foreign-born population - Liberia (%)
Place of birth for the foreign-born population - Nigeria (%)
Place of birth for the foreign-born population - Senegal (%)
Place of birth for the foreign-born population - Sierra Leone (%)
Place of birth for the foreign-born population - Other Western Africa (%)
Place of birth for the foreign-born population - Australia (%)
Place of birth for the foreign-born population - New Zealand (%)
Place of birth for the foreign-born population - Fiji (%)
Place of birth for the foreign-born population - Micronesia (%)
Place of birth for the foreign-born population - Bahamas (%)
Place of birth for the foreign-born population - Barbados (%)
Place of birth for the foreign-born population - Cuba (%)
Place of birth for the foreign-born population - Dominica (%)
Place of birth for the foreign-born population - Dominican Republic (%)
Place of birth for the foreign-born population - Grenada (%)
Place of birth for the foreign-born population - Haiti (%)
Place of birth for the foreign-born population - Jamaica (%)
Place of birth for the foreign-born population - St. Vincent and the Grenadines (%)
Place of birth for the foreign-born population - Trinidad and Tobago (%)
Place of birth for the foreign-born population - West Indies (%)
Place of birth for the foreign-born population - Other Caribbean (%)
Place of birth for the foreign-born population - Belize (%)
Place of birth for the foreign-born population - Costa Rica (%)
Place of birth for the foreign-born population - El Salvador (%)
Place of birth for the foreign-born population - Guatemala (%)
Place of birth for the foreign-born population - Honduras (%)
Place of birth for the foreign-born population - Mexico (%)
Place of birth for the foreign-born population - Nicaragua (%)
Place of birth for the foreign-born population - Panama (%)
Place of birth for the foreign-born population - Other Central America (%)
Place of birth for the foreign-born population - Argentina (%)
Place of birth for the foreign-born population - Bolivia (%)
Place of birth for the foreign-born population - Brazil (%)
Place of birth for the foreign-born population - Chile (%)
Place of birth for the foreign-born population - Colombia (%)
Place of birth for the foreign-born population - Ecuador (%)
Place of birth for the foreign-born population - Guyana (%)
Place of birth for the foreign-born population - Peru (%)
Place of birth for the foreign-born population - Uruguay (%)
Place of birth for the foreign-born population - Venezuela (%)
Place of birth for the foreign-born population - Other South America (%)
Place of birth for the foreign-born population - Canada (%)
Place of birth for the foreign-born population - Other Northern America (%)
Place of birth for the foreign-born population - Other (%)
Latest news about races in Eastlake, OH collected exclusively by city-data.com from local newspapers, TV, and radio stations
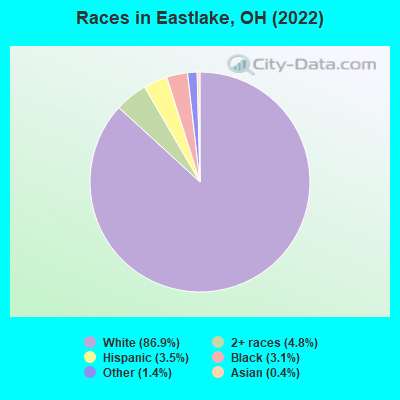
According to 2022 data, the most numerous races in Eastlake, OH are White alone (15,297 residents), Black alone (538 residents), and Two or more races (837 residents). 93.5% of Eastlake residents speak English at home. 3.9% of Eastlake, OH residents are foreign-born (3.1% born in Europe), which is about the same as the foreign-born rate of 4.0% across the entire state of Ohio.
Race distribution in Eastlake
2000 2022
9,538,111 84.0% White alone 1,290,662 11.4% Black alone 217,123 1.9% Hispanic 137,770 1.2% Two or more races 131,670 1.2% Asian alone 21,985 0.2% American Indian alone 13,483 0.1% Other race alone 2,336 0.02% Native Hawaiian and Other
8,948,793 76.1% White alone 1,401,403 11.9% Black alone 529,291 4.5% Two or more races 517,232 4.4% Hispanic 293,387 2.5% Asian alone 52,805 0.4% Other race alone 9,785 0.08% American Indian alone 3,362 0.03% Native Hawaiian and Other
Income and house value in Eastlake Median household income in 2022 $59,573 White non-Hispanic householders$39,740 Black householders$63,906 Hispanic or Latino race householdersMedian 2022 house value $171,320 White Non-Hispanic householders$148,093 Black or African American householders$428,691 American Indian or Alaska Native householders $198,445 Asian householders$186,753 Two or more races householders$122,060 Hispanic or Latino householders
Median age by race in Eastlake
50.3 Median age for White residents49.8 50.8 33.6 Median age for Black or African American residents31.2 31.1 -676,818,950.3 Median age for American Indian / Alaska Native residents-685,185,184.5 -658,163,264.6 44.4 Median age for Asian residents57.4 44.9 -800,387,596.1 Median age for Native Hawaiian / Pacific Islander residents-750,242,953.6 -805,394,989.6 23.2 Median age for Other race residents-520,202,019.7 24.7 13.7 Median age for Two or more races residents15.8 12.2 50.0 Median age for White alone residents49.5 50.7 28.0 Median age for Hispanic or Latino residents23.8 33.6
Owner/renter occupied households by race in Eastlake
House owners and renters - White residents 6,021 80.0% Owner occupied1,506 20.0% Renter occupiedHouse owners and renters - Black or African American residents 120 46.1% Owner occupied141 53.9% Renter occupiedHouse owners and renters - American Indian / Alaska Native residents 14 72.0% Owner occupied6 28.0% Renter occupiedHouse owners and renters - Asian residents 24 100.0% Owner occupiedHouse owners and renters - Native Hawaiian / Pacific Islander residents 4 100.0% Owner occupiedHouse owners and renters - Two or more races residents 164 58.4% Owner occupied116 41.6% Renter occupiedHouse owners and renters - White alone residents 6,035 80.3% Owner occupied1,482 19.7% Renter occupiedHouse owners and renters - Hispanic or Latino residents 180 81.6% Owner occupied40 18.4% Renter occupied
Language usage in Eastlake
English speakers - Total 93.5% of residents of Eastlake speak English at home.
2.3% of residents speak Spanish at home 325 84.6% Speak English very well59 15.4% Speak English less than very well4.3% of residents speak other language at home 447 61.3% Speak English very well282 38.7% Speak English less than very well
English speakers - Born in the United States 96.0% of residents of Eastlake speak English at home.
1.4% of residents speak Spanish at home 35 100.0% Speak English very well3.0% of residents speak other language at home 72 100.0% Speak English very well
English speakers - Native, born elsewhere 0.0% of residents of Eastlake speak English at home.
147.6% of residents speak Spanish at home 31 100.0% Speak English very well
English speakers - Foreign-born 13.8% of residents of Eastlake speak English at home.
8.3% of residents speak Spanish at home 12 26.7% Speak English very well33 73.3% Speak English less than very well76.8% of residents speak other language at home 185 44.3% Speak English very well233 55.7% Speak English less than very well
White (Caucasian) - Speak only English Native:
97.7% (14,106)Foreign-born:
19.2% (59)
White (Caucasian) - Speak another language Native:
2.0% (287)Foreign-born:
77.1% (235)
Black or African American - Speak only English Native:
99.8% (618)Foreign-born:
100.0% (10)
Other race - Speak another language Native:
11.9% (32)Foreign-born:
98.3% (22)
Two or more races - Speak another language Native:
24.0% (266)Foreign-born:
90.5% (81)
White alone - Speak only English Native:
97.4% (14,085)Foreign-born:
17.6% (64)
White alone - Speak another language Native:
2.3% (332)Foreign-born:
79.2% (287)
Hispanic or Latino - Speak another language Native:
42.9% (229)Foreign-born:
100.0% (76)
Foreign-born residents in Eastlake 695 residents are foreign born (3.1% Europe ).
Marital status for residents in Eastlake Marital status - White (Caucasian) population 15 years and over
Males 35.0% Never married44.2% Now married1.2% Separated8.3% Widowed11.4% DivorcedFemales 28.1% Never married40.7% Now married1.0% Separated10.7% Widowed19.6% DivorcedWomen who gave birth in the past 12 months Now married:
70.7% (107)Unmarried:
29.3% (44)
Women who did not give birth in the past 12 months Now married:
32.2% (1,011)Unmarried:
67.8% (2,133)
Marital status - Black or African American population 15 years and over
Males 69.9% Never married27.0% Now married3.0% Separated0.0% Widowed0.0% DivorcedFemales 69.2% Never married17.0% Now married0.0% Separated10.3% Widowed3.6% DivorcedWomen who did not give birth in the past 12 months Now married:
16.2% (31)Unmarried:
83.8% (162)
Marital status - American Indian / Alaska Native population 15 years and over
Males 0.0% Never married0.0% Now married0.0% Separated0.0% Widowed100.0% DivorcedFemales 0.0% Never married0.0% Now married0.0% Separated0.0% Widowed100.0% DivorcedWomen who did not give birth in the past 12 months Now married:
0.0% (0)Unmarried:
100.0% (5)
Marital status - Asian population 15 years and over
Males 0.0% Never married60.7% Now married0.0% Separated39.3% Widowed0.0% DivorcedFemales 0.0% Never married62.5% Now married0.0% Separated37.5% Widowed0.0% DivorcedWomen who did not give birth in the past 12 months Now married:
100.0% (15)Unmarried:
0.0% (0)
Marital status - Other race population 15 years and over
Males 0.0% Never married100.0% Now married0.0% Separated0.0% Widowed0.0% DivorcedFemales 78.0% Never married0.0% Now married0.0% Separated0.0% Widowed22.0% DivorcedWomen who did not give birth in the past 12 months Now married:
0.0% (0)Unmarried:
100.0% (155)
Marital status - Two or more races population 15 years and over
Males 63.6% Never married22.6% Now married3.9% Separated0.3% Widowed9.6% DivorcedFemales 32.6% Never married51.7% Now married15.7% Separated0.0% Widowed0.0% DivorcedWomen who did not give birth in the past 12 months Now married:
66.7% (49)Unmarried:
33.3% (25)
Marital status - White alone, not Hispanic / Latino population 15 years and over
Males 34.8% Never married44.7% Now married0.9% Separated8.4% Widowed11.2% DivorcedFemales 27.9% Never married40.7% Now married1.0% Separated10.7% Widowed19.6% DivorcedWomen who gave birth in the past 12 months Now married:
70.7% (108)Unmarried:
29.3% (45)
Women who did not give birth in the past 12 months Now married:
32.3% (1,028)Unmarried:
67.7% (2,156)
Marital status - Hispanic or Latino population 15 years and over
Males 38.8% Never married31.3% Now married8.2% Separated0.0% Widowed21.6% DivorcedFemales 52.4% Never married16.2% Now married0.0% Separated0.0% Widowed31.4% DivorcedWomen who did not give birth in the past 12 months Now married:
23.6% (21)Unmarried:
76.4% (67)
Ancestries in Eastlake
875 13.1% Italian698 10.5% German687 10.3% Irish666 10.0% American540 8.1% Croatian371 5.6% Hungarian265 4.0% Slovene258 3.9% Polish229 3.4% Slovak163 2.4% English133 2.0% Lithuanian126 1.9% European60 0.9% Scotch-Irish54 0.8% Swedish47 0.7% Czech41 0.6% Dutch39 0.6% French37 0.6% Yugoslavian35 0.5% French Canadian33 0.5% Serbian28 0.4% Eastern European27 0.4% Finnish26 0.4% Russian21 0.3% Scottish15 0.2% Greek13 0.2% Romanian12 0.2% Austrian9 0.1% Norwegian7 0.1% Syrian6 0.09% Welsh
Geographical mobility in Eastlake Same house 1 year ago 13,424 89.2% White (Caucasian)490 74.4% Black or African American22 100.0% American Indian / Alaska Native78 100.0% Asian4 100.0% Native Hawaiian / Pacific Islander203 63.9% Other race1,287 90.6% Two or more races13,577 89.4% White alone, not Hispanic / Latino470 77.2% Hispanic or LatinoMoved within same county 1,022 6.8% White / Caucasian141 21.4% Black or African American34 2.4% Two or more races1,023 6.7% White alone, not Hispanic / Latino107 17.5% Hispanic or LatinoMoved within same state 648 4.3% White / Caucasian10 1.5% Black or African American147 46.4% Other race115 8.1% Two or more races624 4.1% White alone, not Hispanic / Latino23 3.7% Hispanic or LatinoMoved from different state 11 0.1% White / Caucasian11 0.1% White alone, not Hispanic / LatinoMoved from abroad 5 0.0% White5 0.0% White alone, not Hispanic / Latino
Children Nativity (place of birth) in Eastlake
Children under 6 years - Living with two parents Both parents native 369 100.0% NativeBoth parents foreign-born 78 100.0% NativeChildren under 6 years - Living with one parent Native parent 316 100.0% NativeChildren 6 to 17 years - Living with two parents Both parents native 1,074 100.0% NativeBoth parents foreign-born 34 78.0% Native9 22.0% Foreign-bornOne native, one foreign-born parent 117 100.0% NativeChildren 6 to 17 years - Living with one parent Native parent 484 100.0% NativeForeign-born parent 23 70.9% Native10 29.1% Foreign-born
Grandparents responsible for own grandchildren in Eastlake
Grandparents (30 to 59 years) White / Caucasian 17 20.8% Responsible for grandchildren63 79.2% Not responsible for grandchildrenWhite alone, not Hispanic / Latino 16 20.4% Responsible for grandchildren64 79.6% Not responsible for grandchildrenGrandparents (60 years and over) White / Caucasian 68 47.9% Responsible for grandchildren74 52.1% Not responsible for grandchildrenWhite alone, not Hispanic / Latino 68 47.7% Responsible for grandchildren75 52.3% Not responsible for grandchildren