Races in Eastmont, Washington (WA) Detailed Stats
Data:
Races - White alone (%)
Races - White alone (% change since 2000)
Races - Black alone (%)
Races - Black alone (% change since 2000)
Races - American Indian alone (%)
Races - American Indian alone (% change since 2000)
Races - Asian alone (%)
Races - Asian alone (% change since 2000)
Races - Hispanic (%)
Races - Hispanic (% change since 2000)
Races - Native Hawaiian and Other Pacific Islander alone (%)
Races - Native Hawaiian and Other Pacific Islander alone (% change since 2000)
Races - Two or more races(%)
Races - Two or more races(% change since 2000)
Races - Other race alone (%)
Races - Other race alone (% change since 2000)
Racial diversity
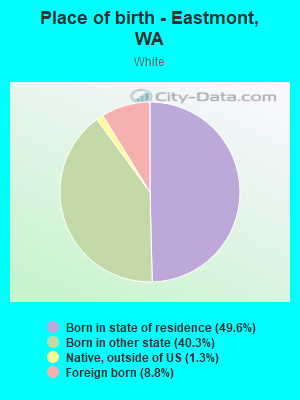
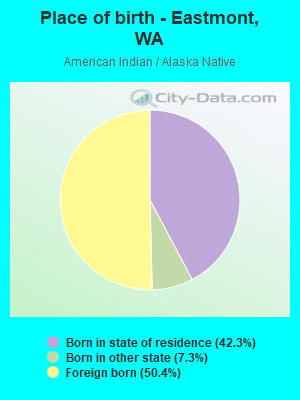
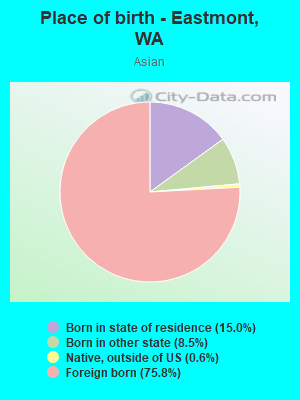
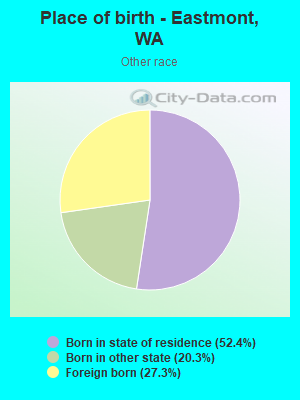
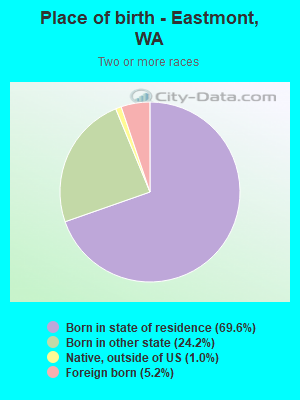
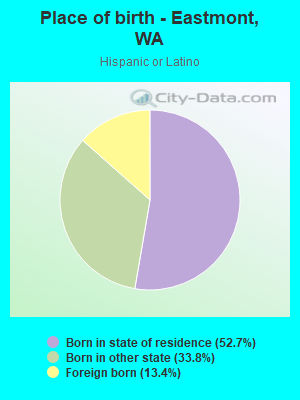
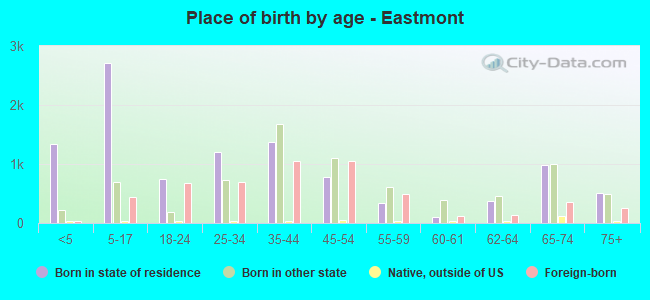
Place of birth - Born in state of residence (%)
Place of birth - Born in state of residence (%) - White
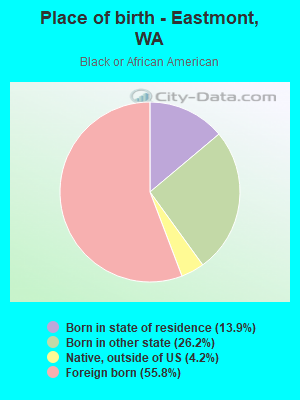
Place of birth - Born in state of residence (%) - Black or African American
Place of birth - Born in state of residence (%) - Asian
Place of birth - Born in state of residence (%) - Hispanic or Latino
Place of birth - Born in state of residence (%) - American Indian and Alaska Native
Place of birth - Born in state of residence (%) - Multirace
Place of birth - Born in state of residence (%) - Other Race
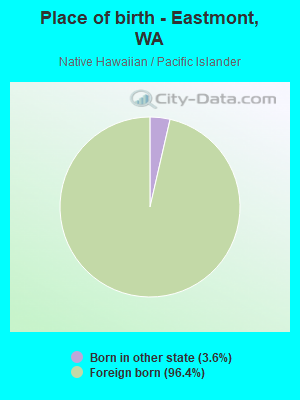
Place of birth - Born in other state (%)
Place of birth - Born in other state (%) - White
Place of birth - Born in other state (%) - Black or African American
Place of birth - Born in other state (%) - Asian
Place of birth - Born in other state (%) - Hispanic or Latino
Place of birth - Born in other state (%) - American Indian and Alaska Native
Place of birth - Born in other state (%) - Multirace
Place of birth - Born in other state (%) - Other Race
Place of birth - Native, outside of US (%)
Place of birth - Native, outside of US (%) - White
Place of birth - Native, outside of US (%) - Black or African American
Place of birth - Native, outside of US (%) - Asian
Place of birth - Native, outside of US (%) - Hispanic or Latino
Place of birth - Native, outside of US (%) - American Indian and Alaska Native
Place of birth - Native, outside of US (%) - Multirace
Place of birth - Native, outside of US (%) - Other Race
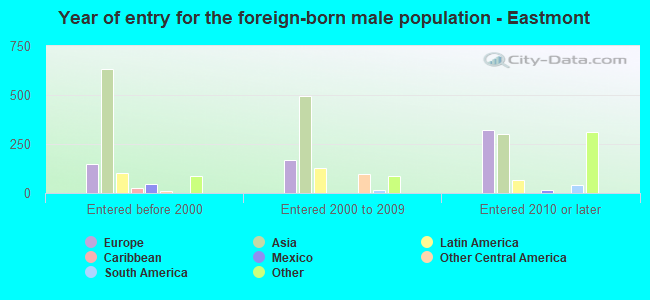
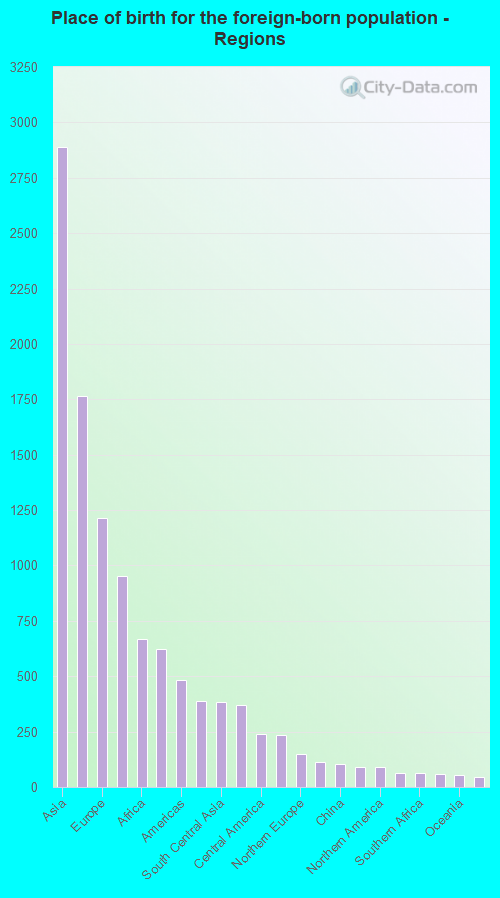
Place of birth - Foreign born (%)
Place of birth - Foreign born (%) - White
Place of birth - Foreign born (%) - Black or African American
Place of birth - Foreign born (%) - Asian
Place of birth - Foreign born (%) - Hispanic or Latino
Place of birth - Foreign born (%) - American Indian and Alaska Native
Place of birth - Foreign born (%) - Multirace
Place of birth - Foreign born (%) - Other Race
Residents speaking English at home (%)
Residents speaking English at home - Born in the United States (%)
Residents speaking English at home - Native, born elsewhere (%)
Residents speaking English at home - Foreign born (%)
Residents speaking Spanish at home (%)
Residents speaking Spanish at home - Born in the United States (%)
Residents speaking Spanish at home - Native, born elsewhere (%)
Residents speaking Spanish at home - Foreign born (%)
Residents speaking other language at home (%)
Residents speaking other language at home - Born in the United States (%)
Residents speaking other language at home - Native, born elsewhere (%)
Residents speaking other language at home - Foreign born (%)
Marital status - Never married (%)
Marital status - Now married (%)
Marital status - Separated (%)
Marital status - Widowed (%)
Marital status - Divorced (%)
Ancestries Reported - Arab (%)
Ancestries Reported - Czech (%)
Ancestries Reported - Danish (%)
Ancestries Reported - Dutch (%)
Ancestries Reported - English (%)
Ancestries Reported - French (%)
Ancestries Reported - French Canadian (%)
Ancestries Reported - German (%)
Ancestries Reported - Greek (%)
Ancestries Reported - Hungarian (%)
Ancestries Reported - Irish (%)
Ancestries Reported - Italian (%)
Ancestries Reported - Lithuanian (%)
Ancestries Reported - Norwegian (%)
Ancestries Reported - Polish (%)
Ancestries Reported - Portuguese (%)
Ancestries Reported - Russian (%)
Ancestries Reported - Scotch-Irish (%)
Ancestries Reported - Scottish (%)
Ancestries Reported - Slovak (%)
Ancestries Reported - Subsaharan African (%)
Ancestries Reported - Swedish (%)
Ancestries Reported - Swiss (%)
Ancestries Reported - Ukrainian (%)
Ancestries Reported - United States (%)
Ancestries Reported - Welsh (%)
Ancestries Reported - West Indian (%)
Ancestries Reported - Other (%)
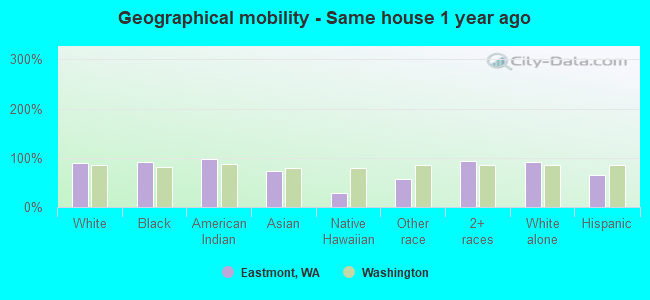
Geographical mobility - Same house 1 year ago (%)
Geographical mobility - Same house 1 year ago (%) - White
Geographical mobility - Same house 1 year ago (%) - Black or African American
Geographical mobility - Same house 1 year ago (%) - Asian
Geographical mobility - Same house 1 year ago (%) - Hispanic or Latino
Geographical mobility - Same house 1 year ago (%) - American Indian and Alaska Native
Geographical mobility - Same house 1 year ago (%) - Multirace
Geographical mobility - Same house 1 year ago (%) - Other Race
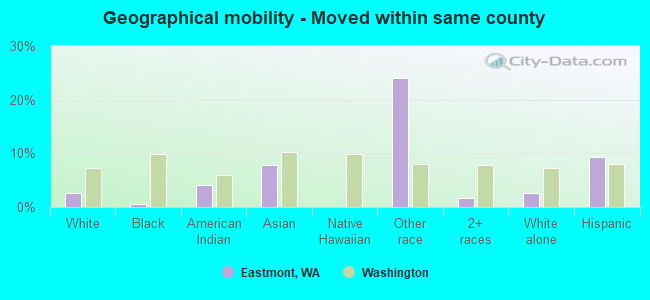
Geographical mobility - Moved within same county (%)
Geographical mobility - Moved within same county (%) - White
Geographical mobility - Moved within same county (%) - Black or African American
Geographical mobility - Moved within same county (%) - Asian
Geographical mobility - Moved within same county (%) - Hispanic or Latino
Geographical mobility - Moved within same county (%) - American Indian and Alaska Native
Geographical mobility - Moved within same county (%) - Multirace
Geographical mobility - Moved within same county (%) - Other Race
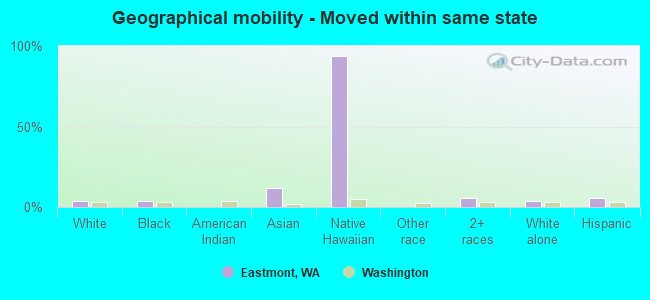
Geographical mobility - Moved from different county within same state (%)
Geographical mobility - Moved from different county within same state (%) - White
Geographical mobility - Moved from different county within same state (%) - Black or African American
Geographical mobility - Moved from different county within same state (%) - Asian
Geographical mobility - Moved from different county within same state (%) - Hispanic or Latino
Geographical mobility - Moved from different county within same state (%) - American Indian and Alaska Native
Geographical mobility - Moved from different county within same state (%) - Multirace
Geographical mobility - Moved from different county within same state (%) - Other Race
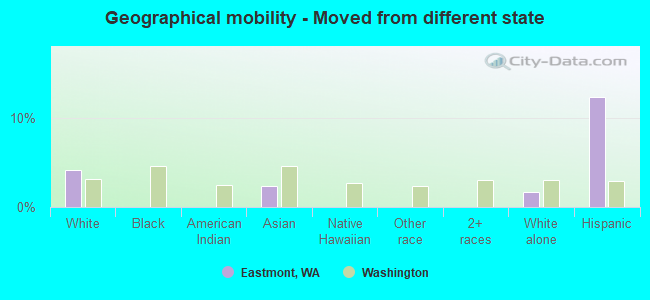
Geographical mobility - Moved from different state (%)
Geographical mobility - Moved from different state (%) - White
Geographical mobility - Moved from different state (%) - Black or African American
Geographical mobility - Moved from different state (%) - Asian
Geographical mobility - Moved from different state (%) - Hispanic or Latino
Geographical mobility - Moved from different state (%) - American Indian and Alaska Native
Geographical mobility - Moved from different state (%) - Multirace
Geographical mobility - Moved from different state (%) - Other Race
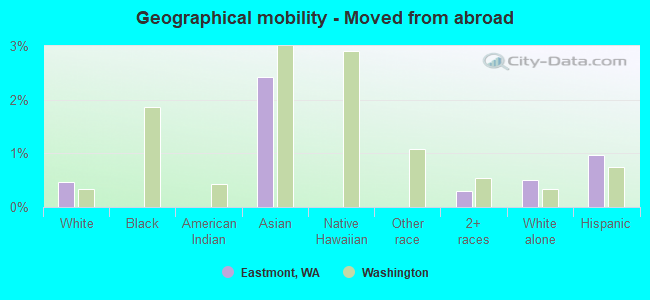
Geographical mobility - Moved from abroad (%)
Geographical mobility - Moved from abroad (%) - White
Geographical mobility - Moved from abroad (%) - Black or African American
Geographical mobility - Moved from abroad (%) - Asian
Geographical mobility - Moved from abroad (%) - Hispanic or Latino
Geographical mobility - Moved from abroad (%) - American Indian and Alaska Native
Geographical mobility - Moved from abroad (%) - Multirace
Geographical mobility - Moved from abroad (%) - Other Race
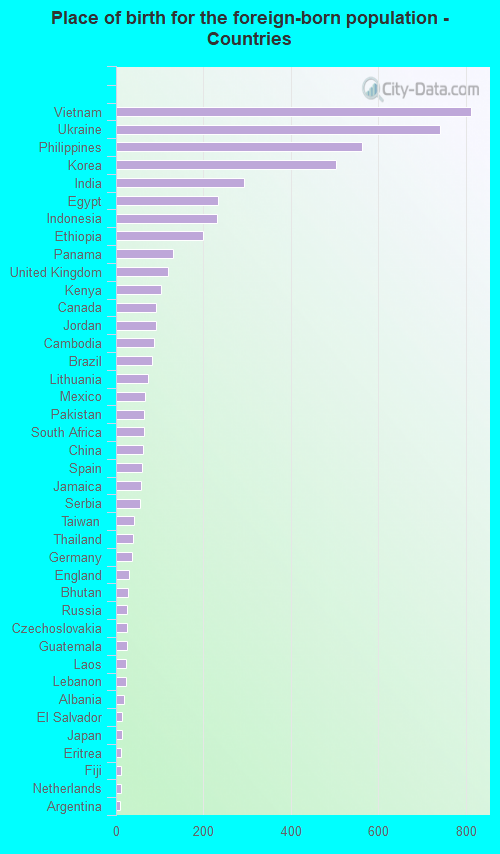
Place of birth for the foreign-born population - Ireland (%)
Place of birth for the foreign-born population - Denmark (%)
Place of birth for the foreign-born population - Norway (%)
Place of birth for the foreign-born population - Sweden (%)
Place of birth for the foreign-born population - United Kingdom (%)
Place of birth for the foreign-born population - England (%)
Place of birth for the foreign-born population - Scotland (%)
Place of birth for the foreign-born population - Other Northern Europe (%)
Place of birth for the foreign-born population - Austria (%)
Place of birth for the foreign-born population - Belgium (%)
Place of birth for the foreign-born population - France (%)
Place of birth for the foreign-born population - Germany (%)
Place of birth for the foreign-born population - Netherlands (%)
Place of birth for the foreign-born population - Switzerland (%)
Place of birth for the foreign-born population - Other Western Europe (%)
Place of birth for the foreign-born population - Greece (%)
Place of birth for the foreign-born population - Italy (%)
Place of birth for the foreign-born population - Portugal (%)
Place of birth for the foreign-born population - Spain (%)
Place of birth for the foreign-born population - Other Southern Europe (%)
Place of birth for the foreign-born population - Albania (%)
Place of birth for the foreign-born population - Belarus (%)
Place of birth for the foreign-born population - Bosnia and Herzegovina (%)
Place of birth for the foreign-born population - Bulgaria (%)
Place of birth for the foreign-born population - Croatia (%)
Place of birth for the foreign-born population - Czechoslovakia (%)
Place of birth for the foreign-born population - Hungary (%)
Place of birth for the foreign-born population - Latvia (%)
Place of birth for the foreign-born population - Lithuania (%)
Place of birth for the foreign-born population - North Macedonia (Macedonia) (%)
Place of birth for the foreign-born population - Moldova (%)
Place of birth for the foreign-born population - Poland (%)
Place of birth for the foreign-born population - Romania (%)
Place of birth for the foreign-born population - Russia (%)
Place of birth for the foreign-born population - Serbia (%)
Place of birth for the foreign-born population - Ukraine (%)
Place of birth for the foreign-born population - Other Eastern Europe (%)
Place of birth for the foreign-born population - China (%)
Place of birth for the foreign-born population - Hong Kong (%)
Place of birth for the foreign-born population - Taiwan (%)
Place of birth for the foreign-born population - Japan (%)
Place of birth for the foreign-born population - Korea (%)
Place of birth for the foreign-born population - Other Eastern Asia (%)
Place of birth for the foreign-born population - Afghanistan (%)
Place of birth for the foreign-born population - Bangladesh (%)
Place of birth for the foreign-born population - India (%)
Place of birth for the foreign-born population - Iran (%)
Place of birth for the foreign-born population - Kazakhstan (%)
Place of birth for the foreign-born population - Nepal (%)
Place of birth for the foreign-born population - Pakistan (%)
Place of birth for the foreign-born population - Sri Lanka (%)
Place of birth for the foreign-born population - Uzbekistan (%)
Place of birth for the foreign-born population - Other South Central Asia (%)
Place of birth for the foreign-born population - Burma (%)
Place of birth for the foreign-born population - Cambodia (%)
Place of birth for the foreign-born population - Indonesia (%)
Place of birth for the foreign-born population - Laos (%)
Place of birth for the foreign-born population - Malaysia (%)
Place of birth for the foreign-born population - Philippines (%)
Place of birth for the foreign-born population - Singapore (%)
Place of birth for the foreign-born population - Thailand (%)
Place of birth for the foreign-born population - Vietnam (%)
Place of birth for the foreign-born population - Other South Eastern Asia (%)
Place of birth for the foreign-born population - Armenia (%)
Place of birth for the foreign-born population - Iraq (%)
Place of birth for the foreign-born population - Israel (%)
Place of birth for the foreign-born population - Jordan (%)
Place of birth for the foreign-born population - Kuwait (%)
Place of birth for the foreign-born population - Lebanon (%)
Place of birth for the foreign-born population - Saudi Arabia (%)
Place of birth for the foreign-born population - Syria (%)
Place of birth for the foreign-born population - Turkey (%)
Place of birth for the foreign-born population - Yemen (%)
Place of birth for the foreign-born population - Other Western Asia (%)
Place of birth for the foreign-born population - Eritrea (%)
Place of birth for the foreign-born population - Ethiopia (%)
Place of birth for the foreign-born population - Kenya (%)
Place of birth for the foreign-born population - Somalia (%)
Place of birth for the foreign-born population - Uganda (%)
Place of birth for the foreign-born population - Zimbabwe (%)
Place of birth for the foreign-born population - Other Eastern Africa (%)
Place of birth for the foreign-born population - Cameroon (%)
Place of birth for the foreign-born population - Congo (%)
Place of birth for the foreign-born population - Democratic Republic of Congo (Zaire) (%)
Place of birth for the foreign-born population - Other Middle Africa (%)
Place of birth for the foreign-born population - Egypt (%)
Place of birth for the foreign-born population - Morocco (%)
Place of birth for the foreign-born population - Sudan (%)
Place of birth for the foreign-born population - Other Northern Africa (%)
Place of birth for the foreign-born population - South Africa (%)
Place of birth for the foreign-born population - Other Southern Africa (%)
Place of birth for the foreign-born population - Cabo Verde (%)
Place of birth for the foreign-born population - Ghana (%)
Place of birth for the foreign-born population - Liberia (%)
Place of birth for the foreign-born population - Nigeria (%)
Place of birth for the foreign-born population - Senegal (%)
Place of birth for the foreign-born population - Sierra Leone (%)
Place of birth for the foreign-born population - Other Western Africa (%)
Place of birth for the foreign-born population - Australia (%)
Place of birth for the foreign-born population - New Zealand (%)
Place of birth for the foreign-born population - Fiji (%)
Place of birth for the foreign-born population - Micronesia (%)
Place of birth for the foreign-born population - Bahamas (%)
Place of birth for the foreign-born population - Barbados (%)
Place of birth for the foreign-born population - Cuba (%)
Place of birth for the foreign-born population - Dominica (%)
Place of birth for the foreign-born population - Dominican Republic (%)
Place of birth for the foreign-born population - Grenada (%)
Place of birth for the foreign-born population - Haiti (%)
Place of birth for the foreign-born population - Jamaica (%)
Place of birth for the foreign-born population - St. Vincent and the Grenadines (%)
Place of birth for the foreign-born population - Trinidad and Tobago (%)
Place of birth for the foreign-born population - West Indies (%)
Place of birth for the foreign-born population - Other Caribbean (%)
Place of birth for the foreign-born population - Belize (%)
Place of birth for the foreign-born population - Costa Rica (%)
Place of birth for the foreign-born population - El Salvador (%)
Place of birth for the foreign-born population - Guatemala (%)
Place of birth for the foreign-born population - Honduras (%)
Place of birth for the foreign-born population - Mexico (%)
Place of birth for the foreign-born population - Nicaragua (%)
Place of birth for the foreign-born population - Panama (%)
Place of birth for the foreign-born population - Other Central America (%)
Place of birth for the foreign-born population - Argentina (%)
Place of birth for the foreign-born population - Bolivia (%)
Place of birth for the foreign-born population - Brazil (%)
Place of birth for the foreign-born population - Chile (%)
Place of birth for the foreign-born population - Colombia (%)
Place of birth for the foreign-born population - Ecuador (%)
Place of birth for the foreign-born population - Guyana (%)
Place of birth for the foreign-born population - Peru (%)
Place of birth for the foreign-born population - Uruguay (%)
Place of birth for the foreign-born population - Venezuela (%)
Place of birth for the foreign-born population - Other South America (%)
Place of birth for the foreign-born population - Canada (%)
Place of birth for the foreign-born population - Other Northern America (%)
Place of birth for the foreign-born population - Other (%)
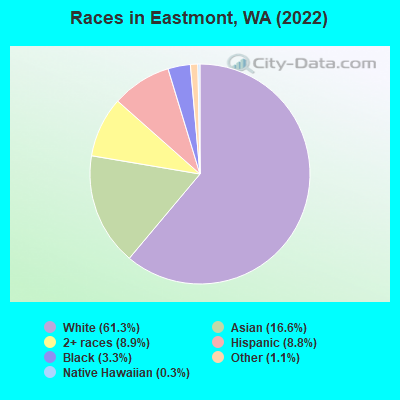
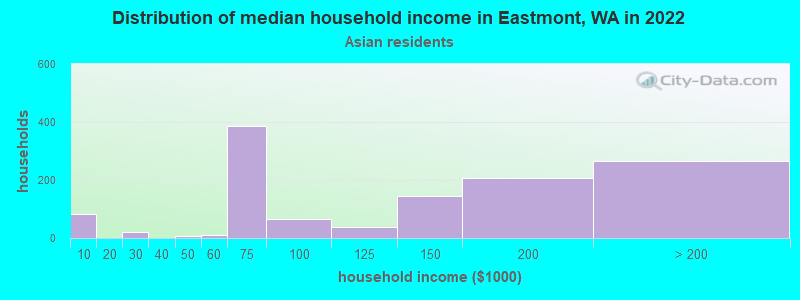
According to 2022 data, the most numerous races in Eastmont, WA are White alone (14,410 residents), Hispanic (2,068 residents), and Asian alone (3,900 residents). 75.9% of Eastmont residents speak English at home.
Race distribution in Eastmont 14,410 61.3% White alone 3,900 16.6% Asian alone 2,084 8.9% Two or more races 2,068 8.8% Hispanic 770 3.3% Black alone 263 1.1% Other race alone 82 0.3% Native Hawaiian and Other 23 0.10% American Indian alone
2000 2022
4,652,490 78.9% White alone 441,509 7.5% Hispanic 319,401 5.4% Asian alone 184,631 3.1% Black alone 175,926 3.0% Two or more races 85,396 1.4% American Indian alone 22,779 0.4% Native Hawaiian and Other 11,989 0.2% Other race alone
4,941,456 63.5% White alone 1,093,313 14.0% Hispanic 755,832 9.7% Asian alone 523,448 6.7% Two or more races 299,537 3.8% Black alone 69,024 0.9% American Indian alone 52,231 0.7% Native Hawaiian and Other 50,945 0.7% Other race alone
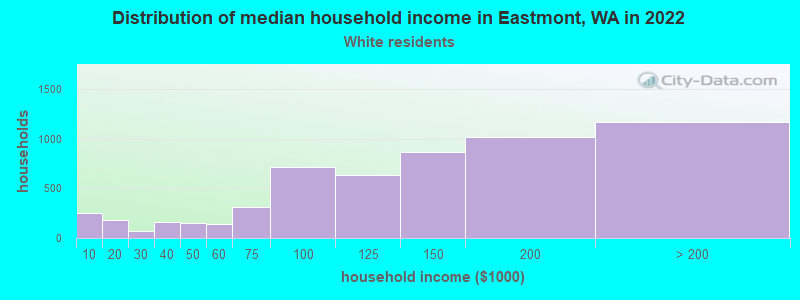
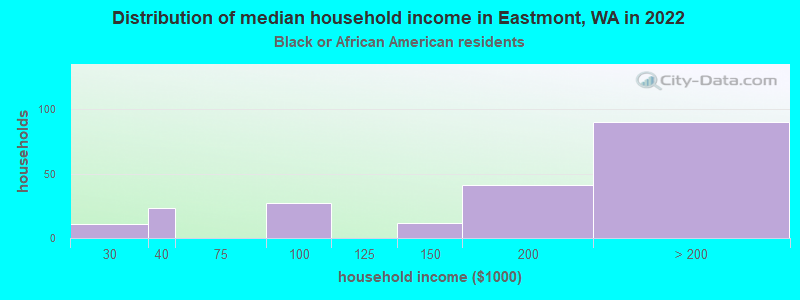
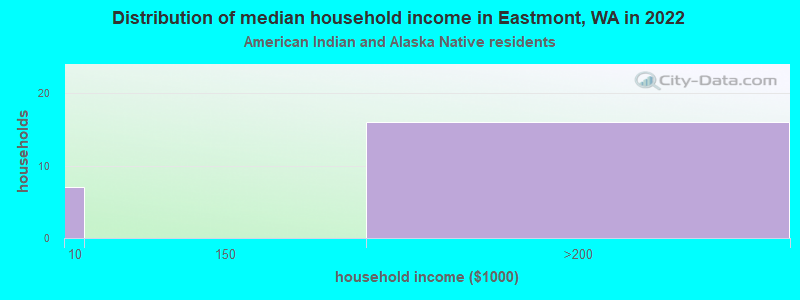
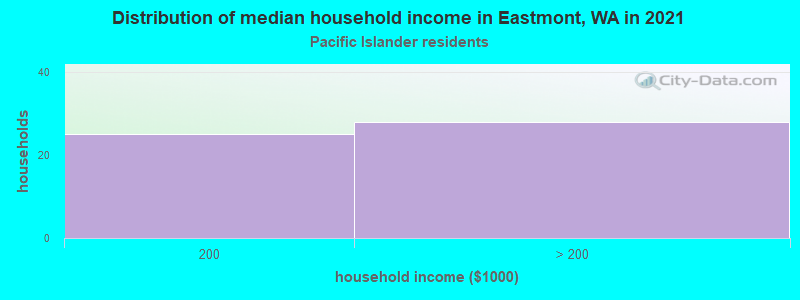
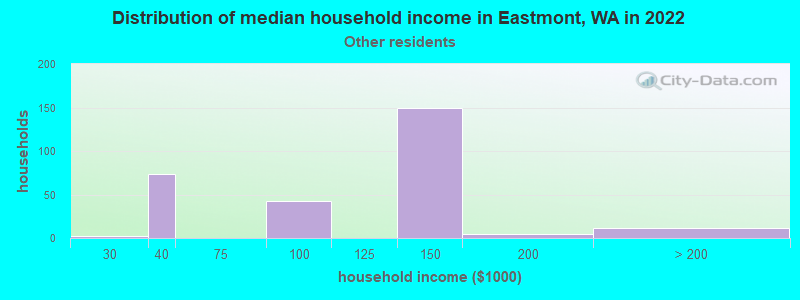
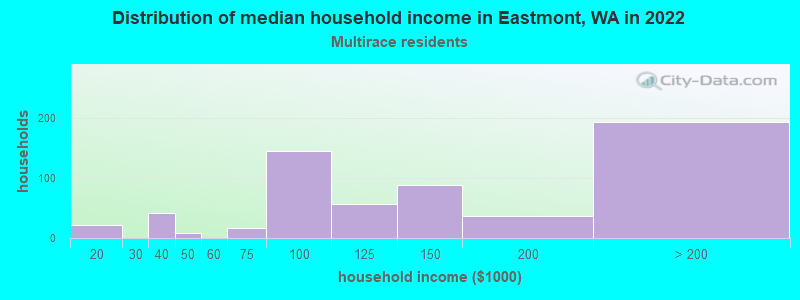
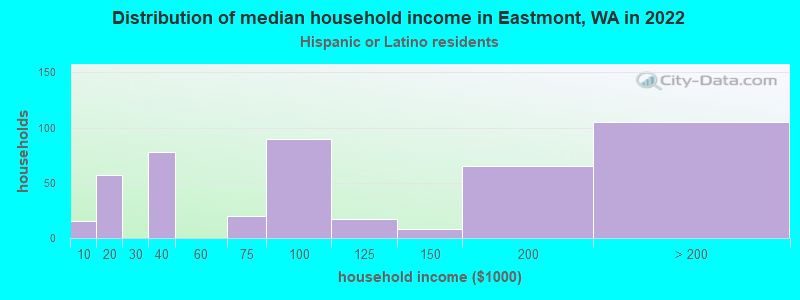
Income and house value in Eastmont Median household income in 2022 $126,459 White non-Hispanic householders$186,698 Black householders$127,588 Asian householders$136,053 Two or more races householders
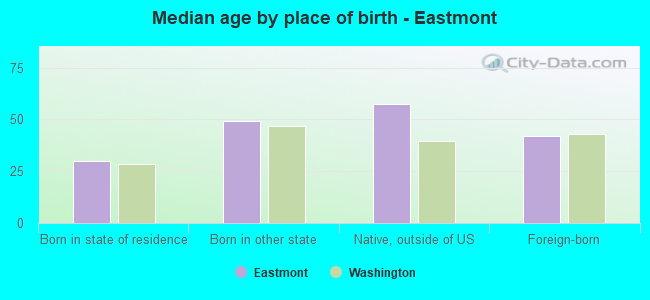
Median age by race in Eastmont
42.7 Median age for White residents41.5 45.2 40.9 Median age for Black or African American residents40.2 41.2 57.2 Median age for American Indian / Alaska Native residents-736,637,511.4 0.0 39.8 Median age for Asian residents35.9 40.2 60.6 Median age for Native Hawaiian / Pacific Islander residents-661,202,185.1 75.9 37.1 Median age for Other race residents35.3 61.4 19.8 Median age for Two or more races residents25.1 18.2 44.3 Median age for White alone residents42.7 45.7 16.4 Median age for Hispanic or Latino residents14.6 18.2
Owner/renter occupied households by race in Eastmont
House owners and renters - White residents 4,839 86.3% Owner occupied769 13.7% Renter occupiedHouse owners and renters - Black or African American residents 130 78.2% Owner occupied36 21.8% Renter occupiedHouse owners and renters - American Indian / Alaska Native residents 30 100.0% Owner occupiedHouse owners and renters - Asian residents 1,302 98.1% Owner occupied25 1.9% Renter occupiedHouse owners and renters - Native Hawaiian / Pacific Islander residents 33 100.0% Owner occupiedHouse owners and renters - Other race residents 70 21.2% Owner occupied259 78.8% Renter occupiedHouse owners and renters - Two or more races residents 583 91.6% Owner occupied54 8.4% Renter occupiedHouse owners and renters - White alone residents 4,766 87.1% Owner occupied704 12.9% Renter occupiedHouse owners and renters - Hispanic or Latino residents 305 58.7% Owner occupied215 41.3% Renter occupied
Language usage in Eastmont
English speakers - Total 75.9% of residents of Eastmont speak English at home.
3.9% of residents speak Spanish at home 669 77.6% Speak English very well193 22.4% Speak English less than very well20.3% of residents speak other language at home 2,112 47.4% Speak English very well2,341 52.6% Speak English less than very well
English speakers - Born in the United States 94.4% of residents of Eastmont speak English at home.
2.6% of residents speak Spanish at home 191 100.0% Speak English very well2.8% of residents speak other language at home 182 87.9% Speak English very well25 12.1% Speak English less than very well
English speakers - Native, born elsewhere 69.0% of residents of Eastmont speak English at home.
27.1% of residents speak Spanish at home 77 100.0% Speak English very well5.3% of residents speak other language at home 15 100.0% Speak English less than very well
English speakers - Foreign-born 25.3% of residents of Eastmont speak English at home.
5.5% of residents speak Spanish at home 222 75.3% Speak English very well73 24.7% Speak English less than very well70.2% of residents speak other language at home 1,552 41.6% Speak English very well2,181 58.4% Speak English less than very well
White (Caucasian) - Speak only English Native:
98.4% (12,353)Foreign-born:
53.6% (693)
White (Caucasian) - Speak another language Native:
2.0% (249)Foreign-born:
47.8% (618)
Black or African American - Speak only English Native:
100.0% (324)Foreign-born:
37.5% (161)
Black or African American - Speak another language Native:
7.2% (23)Foreign-born:
66.2% (284)
American Indian / Alaska Native - Speak only English Native:
82.5% (11)Foreign-born:
67.1% (17)
Asian - Speak only English Native:
41.5% (314)Foreign-born:
8.9% (265)
Asian - Speak another language Native:
58.7% (444)Foreign-born:
90.4% (2,681)
Native Hawaiian / Pacific Islander - Speak only English Native:
57.0% (3)Foreign-born:
12.1% (12)
Other race - Speak another language Native:
52.2% (305)Foreign-born:
96.4% (232)
Two or more races - Speak only English Native:
87.0% (2,143)Foreign-born:
7.8% (11)
Two or more races - Speak another language Native:
12.6% (311)Foreign-born:
89.8% (129)
White alone - Speak only English Native:
97.9% (11,867)Foreign-born:
48.6% (698)
White alone - Speak another language Native:
2.2% (262)Foreign-born:
49.1% (706)
Hispanic or Latino - Speak only English Native:
69.8% (990)Foreign-born:
6.8% (19)
Hispanic or Latino - Speak another language Native:
31.5% (447)Foreign-born:
93.0% (265)
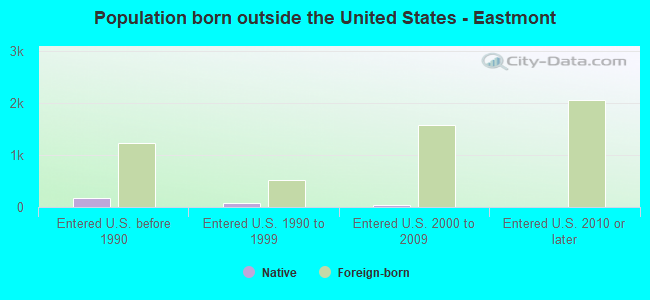
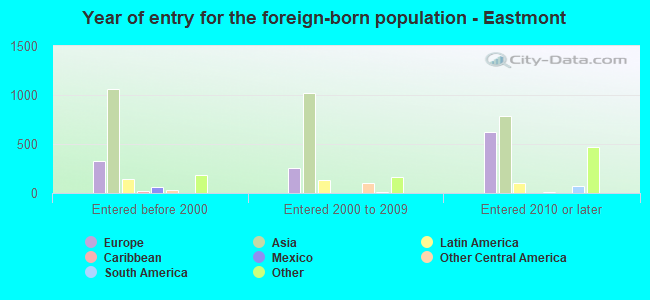
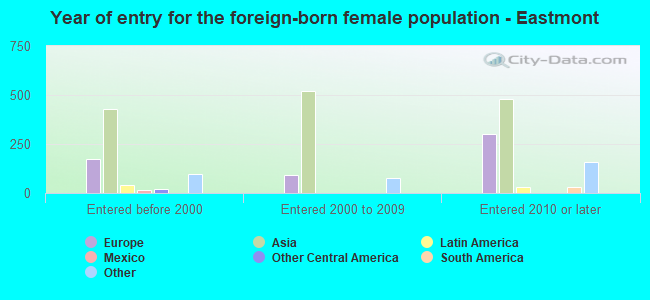
Foreign-born residents in Eastmont
Marital status for residents in Eastmont Marital status - White (Caucasian) population 15 years and over
Males 23.8% Never married65.0% Now married0.5% Separated2.1% Widowed8.6% DivorcedFemales 16.6% Never married62.9% Now married2.2% Separated6.7% Widowed11.5% DivorcedWomen who gave birth in the past 12 months Now married:
83.8% (121)Unmarried:
16.2% (23)
Women who did not give birth in the past 12 months Now married:
64.3% (1,795)Unmarried:
35.7% (996)
Marital status - Black or African American population 15 years and over
Males 35.8% Never married28.7% Now married0.0% Separated0.0% Widowed35.5% DivorcedFemales 31.6% Never married36.8% Now married7.1% Separated20.3% Widowed4.1% DivorcedWomen who gave birth in the past 12 months Now married:
100.0% (17)Unmarried:
0.0% (0)
Women who did not give birth in the past 12 months Now married:
46.6% (95)Unmarried:
53.4% (109)
Marital status - American Indian / Alaska Native population 15 years and over
Males 14.3% Never married85.7% Now married0.0% Separated0.0% Widowed0.0% DivorcedFemales 0.0% Never married0.0% Now married20.0% Separated80.0% Widowed0.0% DivorcedWomen who did not give birth in the past 12 months Now married:
100.0% (3)Unmarried:
0.0% (0)
Marital status - Asian population 15 years and over
Males 36.4% Never married32.5% Now married0.0% Separated7.7% Widowed23.4% DivorcedFemales 30.7% Never married54.2% Now married3.3% Separated5.7% Widowed6.1% DivorcedWomen who gave birth in the past 12 months Now married:
90.9% (78)Unmarried:
9.1% (8)
Women who did not give birth in the past 12 months Now married:
45.8% (527)Unmarried:
54.2% (623)
Marital status - Native Hawaiian / Pacific Islander population 15 years and over
Males 0.0% Never married0.0% Now married0.0% Separated0.0% Widowed100.0% DivorcedFemales 0.0% Never married32.1% Now married0.0% Separated67.9% Widowed0.0% DivorcedWomen who did not give birth in the past 12 months Now married:
100.0% (18)Unmarried:
0.0% (0)
Marital status - Other race population 15 years and over
Males 17.9% Never married21.9% Now married0.0% Separated0.0% Widowed60.2% DivorcedFemales 27.9% Never married72.1% Now married0.0% Separated0.0% Widowed0.0% DivorcedWomen who did not give birth in the past 12 months Now married:
29.2% (10)Unmarried:
70.8% (24)
Marital status - Two or more races population 15 years and over
Males 39.5% Never married57.4% Now married0.0% Separated0.0% Widowed3.2% DivorcedFemales 40.1% Never married52.9% Now married0.0% Separated2.4% Widowed4.7% DivorcedWomen who gave birth in the past 12 months Now married:
98.5% (72)Unmarried:
1.5% (1)
Women who did not give birth in the past 12 months Now married:
47.2% (302)Unmarried:
52.8% (338)
Marital status - White alone, not Hispanic / Latino population 15 years and over
Males 23.7% Never married64.9% Now married0.5% Separated2.1% Widowed8.9% DivorcedFemales 15.8% Never married63.3% Now married2.3% Separated6.8% Widowed11.8% DivorcedWomen who gave birth in the past 12 months Now married:
82.8% (115)Unmarried:
17.2% (24)
Women who did not give birth in the past 12 months Now married:
65.7% (1,803)Unmarried:
34.3% (942)
Marital status - Hispanic or Latino population 15 years and over
Males 19.2% Never married58.0% Now married0.0% Separated1.7% Widowed21.2% DivorcedFemales 61.0% Never married32.9% Now married0.0% Separated4.6% Widowed1.5% DivorcedWomen who gave birth in the past 12 months Now married:
100.0% (18)Unmarried:
0.0% (0)
Women who did not give birth in the past 12 months Now married:
20.1% (68)Unmarried:
79.9% (268)
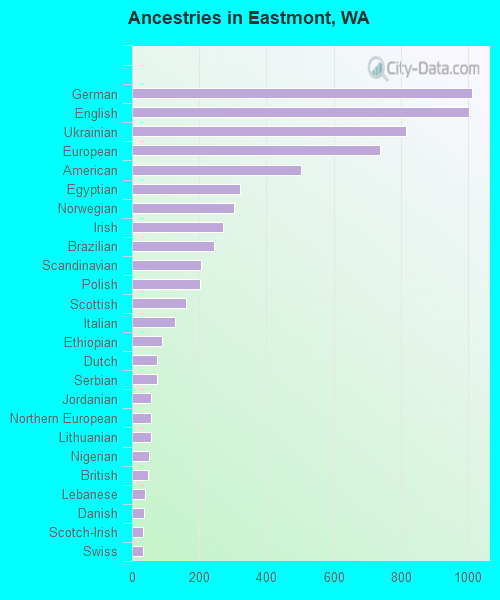
Ancestries in Eastmont
1,012 9.1% German1,003 9.1% English816 7.4% Ukrainian739 6.7% European502 4.5% American320 2.9% Egyptian304 2.7% Norwegian271 2.4% Irish244 2.2% Brazilian205 1.9% Scandinavian202 1.8% Polish162 1.5% Scottish127 1.1% Italian90 0.8% Ethiopian75 0.7% Dutch73 0.7% Serbian58 0.5% Jordanian57 0.5% Northern European56 0.5% Lithuanian52 0.5% Nigerian49 0.4% British38 0.3% Lebanese36 0.3% Danish33 0.3% Scotch-Irish33 0.3% Swiss32 0.3% Canadian27 0.2% Russian24 0.2% Czech24 0.2% French22 0.2% African21 0.2% Hungarian14 0.1% Czechoslovakian11 0.10% French Canadian10 0.09% Iranian9 0.08% Swedish8 0.07% Portuguese6 0.05% Finnish3 0.03% Pennsylvania German
Geographical mobility in Eastmont Same house 1 year ago 13,354 90.3% White (Caucasian)697 91.3% Black or African American33 97.7% American Indian / Alaska Native2,836 73.9% Asian17 28.3% Native Hawaiian / Pacific Islander485 57.8% Other race2,535 93.7% Two or more races13,030 91.9% White alone, not Hispanic / Latino1,324 64.1% Hispanic or LatinoMoved within same county 373 2.5% White / Caucasian4 0.5% Black or African American1 4.1% American Indian / Alaska Native302 7.9% Asian202 24.0% Other race45 1.7% Two or more races375 2.6% White alone, not Hispanic / Latino193 9.3% Hispanic or LatinoMoved within same state 546 3.7% White / Caucasian28 3.6% Black or African American442 11.5% Asian56 94.1% Native Hawaiian / Pacific Islander146 5.4% Two or more races567 4.0% White alone, not Hispanic / Latino119 5.7% Hispanic or LatinoMoved from different state 614 4.1% White / Caucasian89 2.3% Asian240 1.7% White alone, not Hispanic / Latino254 12.3% Hispanic or LatinoMoved from abroad 68 0.5% White93 2.4% Asian8 0.3% Two or more races70 0.5% White alone, not Hispanic / Latino20 1.0% Hispanic or Latino
Children Nativity (place of birth) in Eastmont
Children under 6 years - Living with two parents Both parents native 1,018 100.0% NativeBoth parents foreign-born 274 84.3% Native51 15.7% Foreign-bornOne native, one foreign-born parent 194 100.0% NativeChildren under 6 years - Living with one parent Native parent 157 100.0% NativeForeign-born parent 3 42.2% Native4 57.8% Foreign-bornChildren 6 to 17 years - Living with two parents Both parents native 1,775 100.0% NativeBoth parents foreign-born 247 38.9% Native387 61.1% Foreign-bornOne native, one foreign-born parent 474 100.0% NativeChildren 6 to 17 years - Living with one parent Native parent 513 100.0% NativeForeign-born parent 187 50.0% Native188 50.0% Foreign-born