Races in Eatontown, New Jersey (NJ) Detailed Stats
Data:
Races - White alone (%)
Races - White alone (% change since 2000)
Races - Black alone (%)
Races - Black alone (% change since 2000)
Races - American Indian alone (%)
Races - American Indian alone (% change since 2000)
Races - Asian alone (%)
Races - Asian alone (% change since 2000)
Races - Hispanic (%)
Races - Hispanic (% change since 2000)
Races - Native Hawaiian and Other Pacific Islander alone (%)
Races - Native Hawaiian and Other Pacific Islander alone (% change since 2000)
Races - Two or more races(%)
Races - Two or more races(% change since 2000)
Races - Other race alone (%)
Races - Other race alone (% change since 2000)
Racial diversity
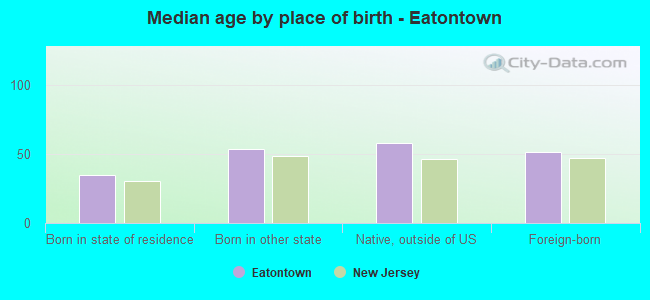
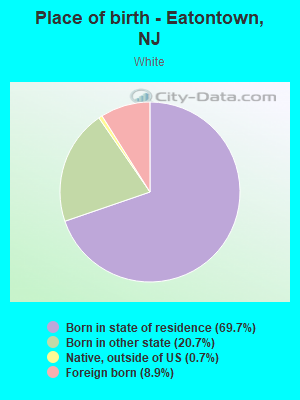
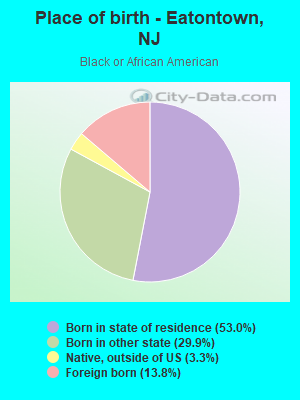
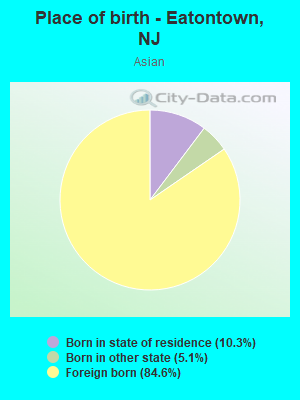
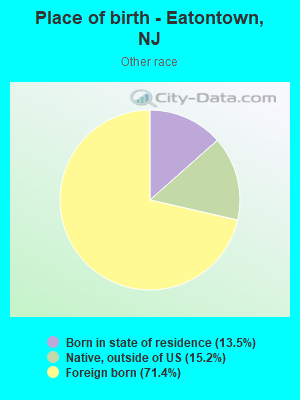
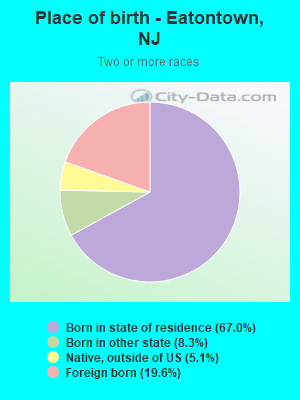
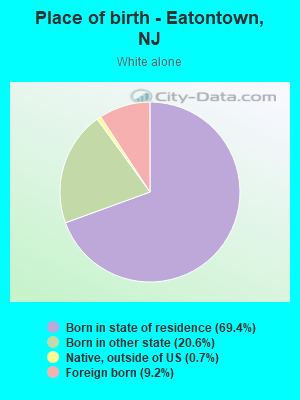
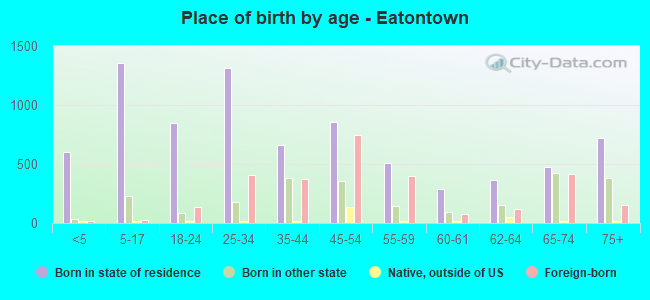
Place of birth - Born in state of residence (%)
Place of birth - Born in state of residence (%) - White
Place of birth - Born in state of residence (%) - Black or African American
Place of birth - Born in state of residence (%) - Asian
Place of birth - Born in state of residence (%) - Hispanic or Latino
Place of birth - Born in state of residence (%) - American Indian and Alaska Native
Place of birth - Born in state of residence (%) - Multirace
Place of birth - Born in state of residence (%) - Other Race
Place of birth - Born in other state (%)
Place of birth - Born in other state (%) - White
Place of birth - Born in other state (%) - Black or African American
Place of birth - Born in other state (%) - Asian
Place of birth - Born in other state (%) - Hispanic or Latino
Place of birth - Born in other state (%) - American Indian and Alaska Native
Place of birth - Born in other state (%) - Multirace
Place of birth - Born in other state (%) - Other Race
Place of birth - Native, outside of US (%)
Place of birth - Native, outside of US (%) - White
Place of birth - Native, outside of US (%) - Black or African American
Place of birth - Native, outside of US (%) - Asian
Place of birth - Native, outside of US (%) - Hispanic or Latino
Place of birth - Native, outside of US (%) - American Indian and Alaska Native
Place of birth - Native, outside of US (%) - Multirace
Place of birth - Native, outside of US (%) - Other Race
Place of birth - Foreign born (%)
Place of birth - Foreign born (%) - White
Place of birth - Foreign born (%) - Black or African American
Place of birth - Foreign born (%) - Asian
Place of birth - Foreign born (%) - Hispanic or Latino
Place of birth - Foreign born (%) - American Indian and Alaska Native
Place of birth - Foreign born (%) - Multirace
Place of birth - Foreign born (%) - Other Race
Residents speaking English at home (%)
Residents speaking English at home - Born in the United States (%)
Residents speaking English at home - Native, born elsewhere (%)
Residents speaking English at home - Foreign born (%)
Residents speaking Spanish at home (%)
Residents speaking Spanish at home - Born in the United States (%)
Residents speaking Spanish at home - Native, born elsewhere (%)
Residents speaking Spanish at home - Foreign born (%)
Residents speaking other language at home (%)
Residents speaking other language at home - Born in the United States (%)
Residents speaking other language at home - Native, born elsewhere (%)
Residents speaking other language at home - Foreign born (%)
Marital status - Never married (%)
Marital status - Now married (%)
Marital status - Separated (%)
Marital status - Widowed (%)
Marital status - Divorced (%)
Ancestries Reported - Arab (%)
Ancestries Reported - Czech (%)
Ancestries Reported - Danish (%)
Ancestries Reported - Dutch (%)
Ancestries Reported - English (%)
Ancestries Reported - French (%)
Ancestries Reported - French Canadian (%)
Ancestries Reported - German (%)
Ancestries Reported - Greek (%)
Ancestries Reported - Hungarian (%)
Ancestries Reported - Irish (%)
Ancestries Reported - Italian (%)
Ancestries Reported - Lithuanian (%)
Ancestries Reported - Norwegian (%)
Ancestries Reported - Polish (%)
Ancestries Reported - Portuguese (%)
Ancestries Reported - Russian (%)
Ancestries Reported - Scotch-Irish (%)
Ancestries Reported - Scottish (%)
Ancestries Reported - Slovak (%)
Ancestries Reported - Subsaharan African (%)
Ancestries Reported - Swedish (%)
Ancestries Reported - Swiss (%)
Ancestries Reported - Ukrainian (%)
Ancestries Reported - United States (%)
Ancestries Reported - Welsh (%)
Ancestries Reported - West Indian (%)
Ancestries Reported - Other (%)
Geographical mobility - Same house 1 year ago (%)
Geographical mobility - Same house 1 year ago (%) - White
Geographical mobility - Same house 1 year ago (%) - Black or African American
Geographical mobility - Same house 1 year ago (%) - Asian
Geographical mobility - Same house 1 year ago (%) - Hispanic or Latino
Geographical mobility - Same house 1 year ago (%) - American Indian and Alaska Native
Geographical mobility - Same house 1 year ago (%) - Multirace
Geographical mobility - Same house 1 year ago (%) - Other Race
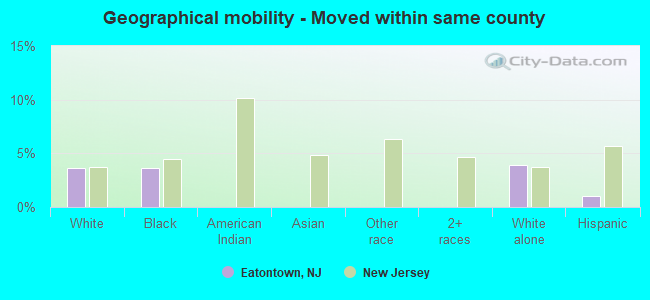
Geographical mobility - Moved within same county (%)
Geographical mobility - Moved within same county (%) - White
Geographical mobility - Moved within same county (%) - Black or African American
Geographical mobility - Moved within same county (%) - Asian
Geographical mobility - Moved within same county (%) - Hispanic or Latino
Geographical mobility - Moved within same county (%) - American Indian and Alaska Native
Geographical mobility - Moved within same county (%) - Multirace
Geographical mobility - Moved within same county (%) - Other Race
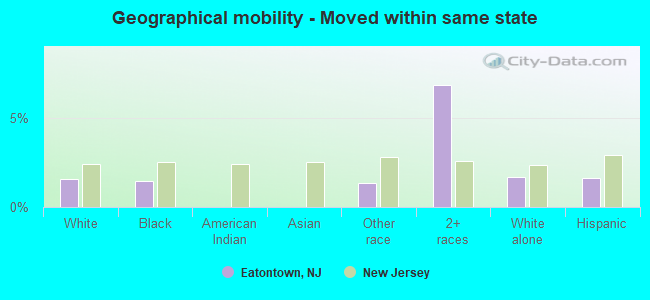
Geographical mobility - Moved from different county within same state (%)
Geographical mobility - Moved from different county within same state (%) - White
Geographical mobility - Moved from different county within same state (%) - Black or African American
Geographical mobility - Moved from different county within same state (%) - Asian
Geographical mobility - Moved from different county within same state (%) - Hispanic or Latino
Geographical mobility - Moved from different county within same state (%) - American Indian and Alaska Native
Geographical mobility - Moved from different county within same state (%) - Multirace
Geographical mobility - Moved from different county within same state (%) - Other Race
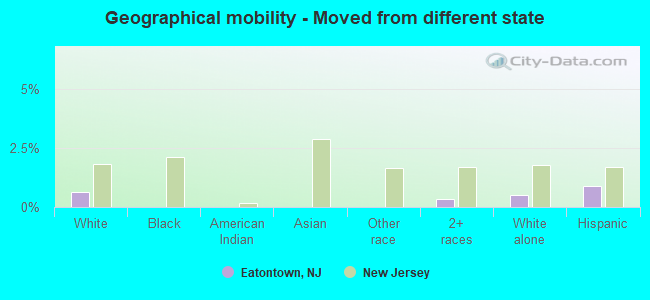
Geographical mobility - Moved from different state (%)
Geographical mobility - Moved from different state (%) - White
Geographical mobility - Moved from different state (%) - Black or African American
Geographical mobility - Moved from different state (%) - Asian
Geographical mobility - Moved from different state (%) - Hispanic or Latino
Geographical mobility - Moved from different state (%) - American Indian and Alaska Native
Geographical mobility - Moved from different state (%) - Multirace
Geographical mobility - Moved from different state (%) - Other Race
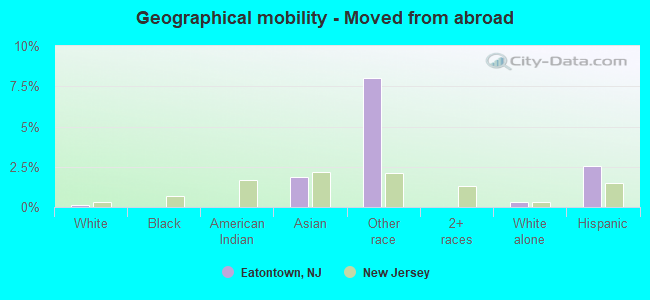
Geographical mobility - Moved from abroad (%)
Geographical mobility - Moved from abroad (%) - White
Geographical mobility - Moved from abroad (%) - Black or African American
Geographical mobility - Moved from abroad (%) - Asian
Geographical mobility - Moved from abroad (%) - Hispanic or Latino
Geographical mobility - Moved from abroad (%) - American Indian and Alaska Native
Geographical mobility - Moved from abroad (%) - Multirace
Geographical mobility - Moved from abroad (%) - Other Race
Place of birth for the foreign-born population - Ireland (%)
Place of birth for the foreign-born population - Denmark (%)
Place of birth for the foreign-born population - Norway (%)
Place of birth for the foreign-born population - Sweden (%)
Place of birth for the foreign-born population - United Kingdom (%)
Place of birth for the foreign-born population - England (%)
Place of birth for the foreign-born population - Scotland (%)
Place of birth for the foreign-born population - Other Northern Europe (%)
Place of birth for the foreign-born population - Austria (%)
Place of birth for the foreign-born population - Belgium (%)
Place of birth for the foreign-born population - France (%)
Place of birth for the foreign-born population - Germany (%)
Place of birth for the foreign-born population - Netherlands (%)
Place of birth for the foreign-born population - Switzerland (%)
Place of birth for the foreign-born population - Other Western Europe (%)
Place of birth for the foreign-born population - Greece (%)
Place of birth for the foreign-born population - Italy (%)
Place of birth for the foreign-born population - Portugal (%)
Place of birth for the foreign-born population - Spain (%)
Place of birth for the foreign-born population - Other Southern Europe (%)
Place of birth for the foreign-born population - Albania (%)
Place of birth for the foreign-born population - Belarus (%)
Place of birth for the foreign-born population - Bosnia and Herzegovina (%)
Place of birth for the foreign-born population - Bulgaria (%)
Place of birth for the foreign-born population - Croatia (%)
Place of birth for the foreign-born population - Czechoslovakia (%)
Place of birth for the foreign-born population - Hungary (%)
Place of birth for the foreign-born population - Latvia (%)
Place of birth for the foreign-born population - Lithuania (%)
Place of birth for the foreign-born population - North Macedonia (Macedonia) (%)
Place of birth for the foreign-born population - Moldova (%)
Place of birth for the foreign-born population - Poland (%)
Place of birth for the foreign-born population - Romania (%)
Place of birth for the foreign-born population - Russia (%)
Place of birth for the foreign-born population - Serbia (%)
Place of birth for the foreign-born population - Ukraine (%)
Place of birth for the foreign-born population - Other Eastern Europe (%)
Place of birth for the foreign-born population - China (%)
Place of birth for the foreign-born population - Hong Kong (%)
Place of birth for the foreign-born population - Taiwan (%)
Place of birth for the foreign-born population - Japan (%)
Place of birth for the foreign-born population - Korea (%)
Place of birth for the foreign-born population - Other Eastern Asia (%)
Place of birth for the foreign-born population - Afghanistan (%)
Place of birth for the foreign-born population - Bangladesh (%)
Place of birth for the foreign-born population - India (%)
Place of birth for the foreign-born population - Iran (%)
Place of birth for the foreign-born population - Kazakhstan (%)
Place of birth for the foreign-born population - Nepal (%)
Place of birth for the foreign-born population - Pakistan (%)
Place of birth for the foreign-born population - Sri Lanka (%)
Place of birth for the foreign-born population - Uzbekistan (%)
Place of birth for the foreign-born population - Other South Central Asia (%)
Place of birth for the foreign-born population - Burma (%)
Place of birth for the foreign-born population - Cambodia (%)
Place of birth for the foreign-born population - Indonesia (%)
Place of birth for the foreign-born population - Laos (%)
Place of birth for the foreign-born population - Malaysia (%)
Place of birth for the foreign-born population - Philippines (%)
Place of birth for the foreign-born population - Singapore (%)
Place of birth for the foreign-born population - Thailand (%)
Place of birth for the foreign-born population - Vietnam (%)
Place of birth for the foreign-born population - Other South Eastern Asia (%)
Place of birth for the foreign-born population - Armenia (%)
Place of birth for the foreign-born population - Iraq (%)
Place of birth for the foreign-born population - Israel (%)
Place of birth for the foreign-born population - Jordan (%)
Place of birth for the foreign-born population - Kuwait (%)
Place of birth for the foreign-born population - Lebanon (%)
Place of birth for the foreign-born population - Saudi Arabia (%)
Place of birth for the foreign-born population - Syria (%)
Place of birth for the foreign-born population - Turkey (%)
Place of birth for the foreign-born population - Yemen (%)
Place of birth for the foreign-born population - Other Western Asia (%)
Place of birth for the foreign-born population - Eritrea (%)
Place of birth for the foreign-born population - Ethiopia (%)
Place of birth for the foreign-born population - Kenya (%)
Place of birth for the foreign-born population - Somalia (%)
Place of birth for the foreign-born population - Uganda (%)
Place of birth for the foreign-born population - Zimbabwe (%)
Place of birth for the foreign-born population - Other Eastern Africa (%)
Place of birth for the foreign-born population - Cameroon (%)
Place of birth for the foreign-born population - Congo (%)
Place of birth for the foreign-born population - Democratic Republic of Congo (Zaire) (%)
Place of birth for the foreign-born population - Other Middle Africa (%)
Place of birth for the foreign-born population - Egypt (%)
Place of birth for the foreign-born population - Morocco (%)
Place of birth for the foreign-born population - Sudan (%)
Place of birth for the foreign-born population - Other Northern Africa (%)
Place of birth for the foreign-born population - South Africa (%)
Place of birth for the foreign-born population - Other Southern Africa (%)
Place of birth for the foreign-born population - Cabo Verde (%)
Place of birth for the foreign-born population - Ghana (%)
Place of birth for the foreign-born population - Liberia (%)
Place of birth for the foreign-born population - Nigeria (%)
Place of birth for the foreign-born population - Senegal (%)
Place of birth for the foreign-born population - Sierra Leone (%)
Place of birth for the foreign-born population - Other Western Africa (%)
Place of birth for the foreign-born population - Australia (%)
Place of birth for the foreign-born population - New Zealand (%)
Place of birth for the foreign-born population - Fiji (%)
Place of birth for the foreign-born population - Micronesia (%)
Place of birth for the foreign-born population - Bahamas (%)
Place of birth for the foreign-born population - Barbados (%)
Place of birth for the foreign-born population - Cuba (%)
Place of birth for the foreign-born population - Dominica (%)
Place of birth for the foreign-born population - Dominican Republic (%)
Place of birth for the foreign-born population - Grenada (%)
Place of birth for the foreign-born population - Haiti (%)
Place of birth for the foreign-born population - Jamaica (%)
Place of birth for the foreign-born population - St. Vincent and the Grenadines (%)
Place of birth for the foreign-born population - Trinidad and Tobago (%)
Place of birth for the foreign-born population - West Indies (%)
Place of birth for the foreign-born population - Other Caribbean (%)
Place of birth for the foreign-born population - Belize (%)
Place of birth for the foreign-born population - Costa Rica (%)
Place of birth for the foreign-born population - El Salvador (%)
Place of birth for the foreign-born population - Guatemala (%)
Place of birth for the foreign-born population - Honduras (%)
Place of birth for the foreign-born population - Mexico (%)
Place of birth for the foreign-born population - Nicaragua (%)
Place of birth for the foreign-born population - Panama (%)
Place of birth for the foreign-born population - Other Central America (%)
Place of birth for the foreign-born population - Argentina (%)
Place of birth for the foreign-born population - Bolivia (%)
Place of birth for the foreign-born population - Brazil (%)
Place of birth for the foreign-born population - Chile (%)
Place of birth for the foreign-born population - Colombia (%)
Place of birth for the foreign-born population - Ecuador (%)
Place of birth for the foreign-born population - Guyana (%)
Place of birth for the foreign-born population - Peru (%)
Place of birth for the foreign-born population - Uruguay (%)
Place of birth for the foreign-born population - Venezuela (%)
Place of birth for the foreign-born population - Other South America (%)
Place of birth for the foreign-born population - Canada (%)
Place of birth for the foreign-born population - Other Northern America (%)
Place of birth for the foreign-born population - Other (%)
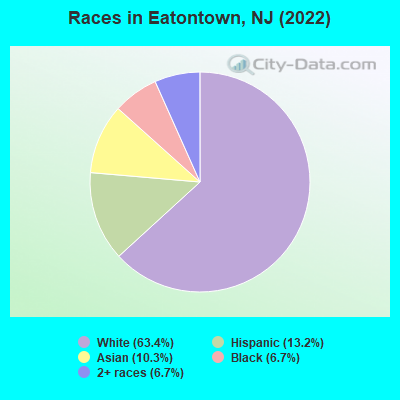
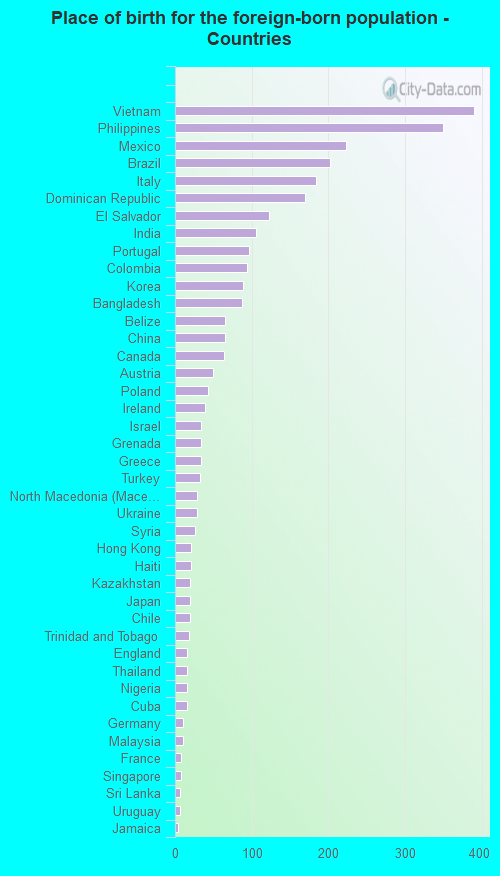
According to 2022 data, the most numerous races in Eatontown, NJ are White alone (8,581 residents), Hispanic (1,792 residents), and Black alone (903 residents). 75.7% of Eatontown residents speak English at home. 21.5% of Eatontown, NJ residents are foreign-born (9.3% born in Asia, 7.3% born in Latin America, 3.9% born in Europe), which is 7.2% less than the foreign-born rate of 23.0% across the entire state of New Jersey.
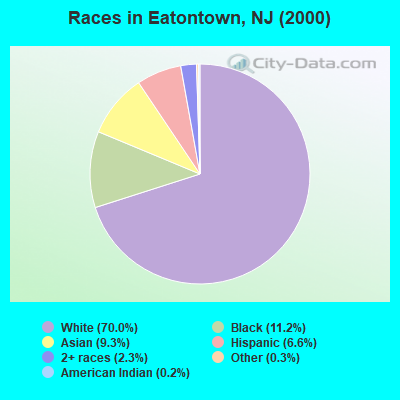
Race distribution in Eatontown
2000 2022
5,557,209 66.0% White alone 1,117,191 13.3% Hispanic 1,096,171 13.0% Black alone 477,012 5.7% Asian alone 133,689 1.6% Two or more races 19,565 0.2% Other race alone 11,338 0.1% American Indian alone 2,175 0.03% Native Hawaiian and Other
4,766,476 51.5% White alone 2,028,470 21.9% Hispanic 1,111,632 12.0% Black alone 923,546 10.0% Asian alone 332,237 3.6% Two or more races 89,847 1.0% Other race alone 8,557 0.09% American Indian alone 934 0.01% Native Hawaiian and Other
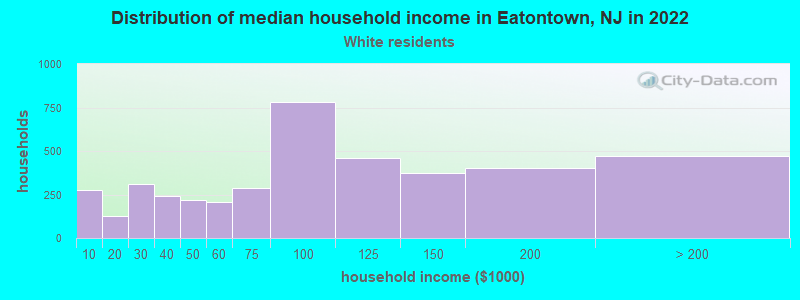
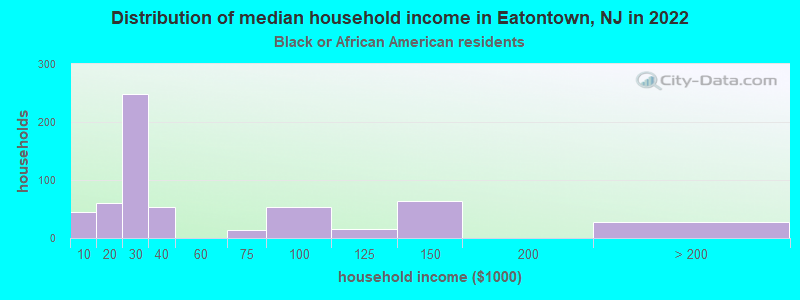
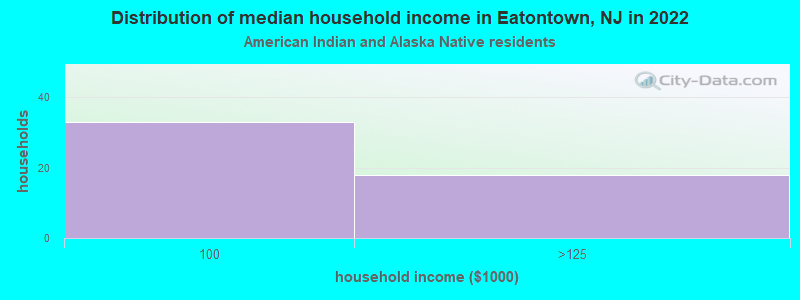
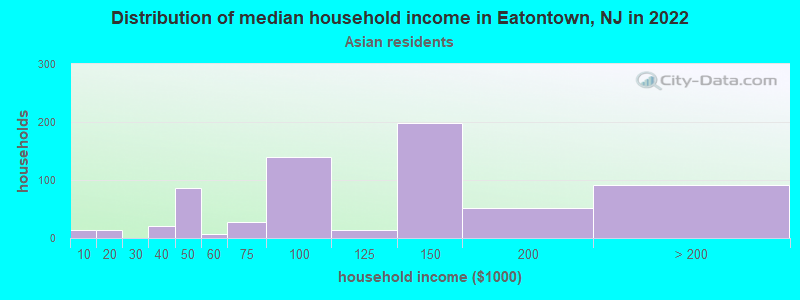
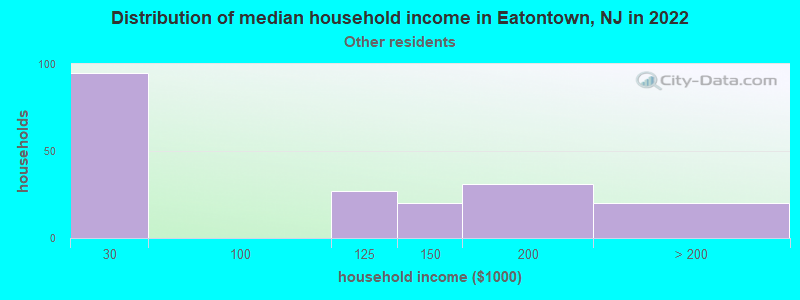
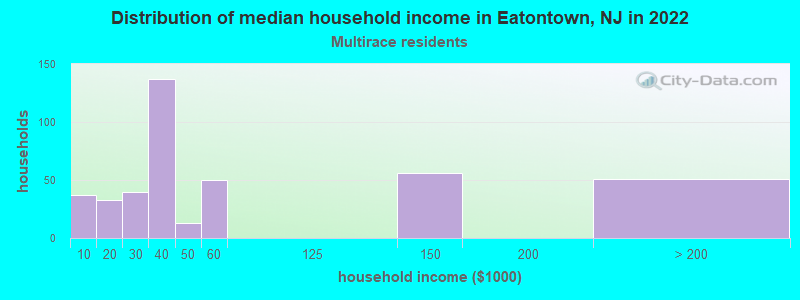
Income and house value in Eatontown Median household income in 2022 $89,469 White non-Hispanic householders$25,389 Black householders$102,444 Asian householders$32,048 Two or more races householders$123,483 Hispanic or Latino race householdersMedian 2022 house value $480,984 White Non-Hispanic householders$490,877 Black or African American householders $434,463 Asian householders$398,102 Some other race householders$505,047 Two or more races householders$494,085 Hispanic or Latino householders
Median age by race in Eatontown
45.4 Median age for White residents45.4 45.3 55.7 Median age for Black or African American residents41.8 55.3 39.8 Median age for American Indian / Alaska Native residents-594,464,500.0 49.2 46.3 Median age for Asian residents45.0 46.9 -804,177,544.9 Median age for Native Hawaiian / Pacific Islander residents-860,335,194.7 -713,070,378.3 55.4 Median age for Other race residents51.2 66.3 25.1 Median age for Two or more races residents30.3 17.0 47.1 Median age for White alone residents46.2 50.8 40.8 Median age for Hispanic or Latino residents43.1 26.3
Owner/renter occupied households by race in Eatontown
House owners and renters - White residents 2,664 65.3% Owner occupied1,416 34.7% Renter occupiedHouse owners and renters - Black or African American residents 145 27.7% Owner occupied378 72.3% Renter occupiedHouse owners and renters - American Indian / Alaska Native residents 37 55.9% Owner occupied29 44.1% Renter occupiedHouse owners and renters - Asian residents 377 60.1% Owner occupied250 39.9% Renter occupiedHouse owners and renters - Other race residents 132 72.6% Owner occupied50 27.4% Renter occupiedHouse owners and renters - Two or more races residents 99 20.3% Owner occupied390 79.7% Renter occupiedHouse owners and renters - White alone residents 2,633 64.8% Owner occupied1,432 35.2% Renter occupiedHouse owners and renters - Hispanic or Latino residents 244 62.1% Owner occupied149 37.9% Renter occupied
Language usage in Eatontown
English speakers - Total 75.7% of residents of Eatontown speak English at home.
6.3% of residents speak Spanish at home 310 38.3% Speak English very well499 61.7% Speak English less than very well19.2% of residents speak other language at home 1,513 61.3% Speak English very well955 38.7% Speak English less than very well
English speakers - Born in the United States 90.6% of residents of Eatontown speak English at home.
3.5% of residents speak Spanish at home 85 100.0% Speak English very well5.4% of residents speak other language at home 111 84.1% Speak English very well21 15.9% Speak English less than very well
English speakers - Native, born elsewhere 71.0% of residents of Eatontown speak English at home.
11.2% of residents speak Spanish at home 24 100.0% Speak English less than very well22.9% of residents speak other language at home 5 10.2% Speak English very well44 89.8% Speak English less than very well
English speakers - Foreign-born 15.6% of residents of Eatontown speak English at home.
20.7% of residents speak Spanish at home 165 27.3% Speak English very well439 72.7% Speak English less than very well65.7% of residents speak other language at home 1,050 54.7% Speak English very well868 45.3% Speak English less than very well
White (Caucasian) - Speak only English Native:
96.2% (7,286)Foreign-born:
24.7% (198)
White (Caucasian) - Speak another language Native:
3.9% (297)Foreign-born:
75.6% (607)
Black or African American - Speak only English Native:
96.7% (896)Foreign-born:
32.3% (47)
Black or African American - Speak another language Native:
1.7% (16)Foreign-born:
67.6% (97)
Asian - Speak only English Native:
52.6% (110)Foreign-born:
10.1% (124)
Asian - Speak another language Native:
46.3% (97)Foreign-born:
89.9% (1,101)
Other race - Speak only English Native:
100.0% (181)Foreign-born:
12.3% (52)
Other race - Speak another language Native:
8.8% (16)Foreign-born:
87.3% (365)
Two or more races - Speak only English Native:
74.3% (796)Foreign-born:
3.6% (10)
Two or more races - Speak another language Native:
23.6% (253)Foreign-born:
100.0% (270)
White alone - Speak only English Native:
97.2% (7,064)Foreign-born:
23.3% (185)
White alone - Speak another language Native:
2.8% (204)Foreign-born:
78.6% (626)
Hispanic or Latino - Speak only English Native:
76.2% (680)Foreign-born:
12.8% (97)
Hispanic or Latino - Speak another language Native:
26.1% (233)Foreign-born:
86.9% (657)
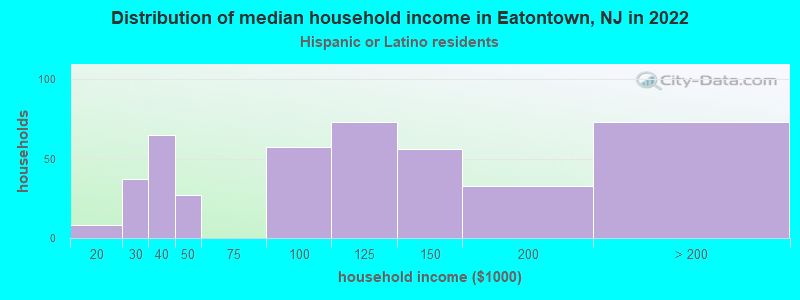
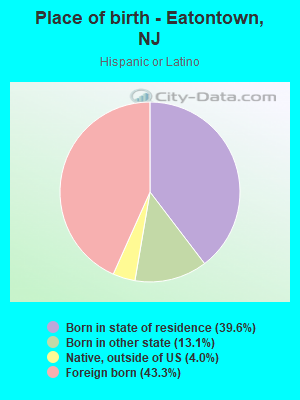
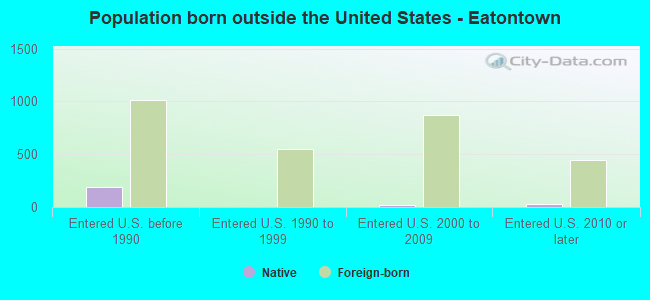
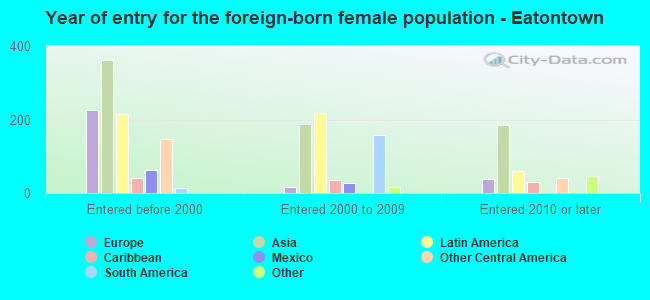
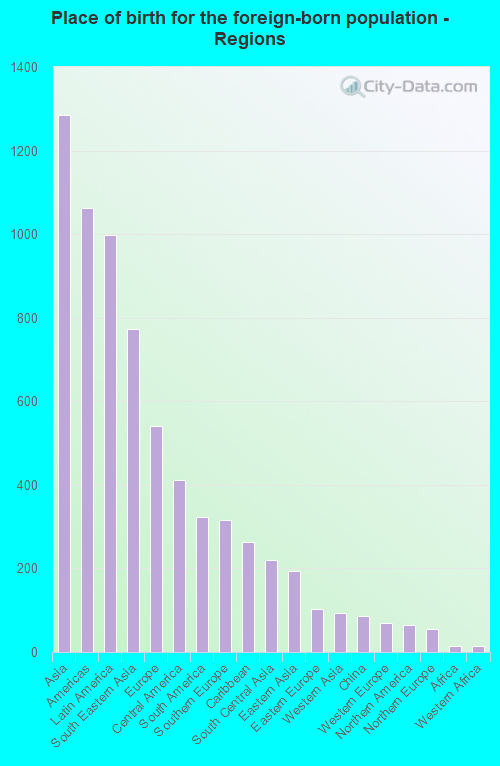
Foreign-born residents in Eatontown 2,906 residents are foreign born (9.3% Asia , 7.3% Latin America , 3.9% Europe ).
This city:
21.5%New Jersey:
23.2%
Marital status for residents in Eatontown Marital status - White (Caucasian) population 15 years and over
Males 38.1% Never married47.8% Now married0.8% Separated5.5% Widowed7.9% DivorcedFemales 28.4% Never married45.0% Now married1.6% Separated8.0% Widowed17.1% DivorcedWomen who gave birth in the past 12 months Now married:
81.4% (107)Unmarried:
18.6% (24)
Women who did not give birth in the past 12 months Now married:
40.1% (614)Unmarried:
59.9% (915)
Marital status - Black or African American population 15 years and over
Males 49.3% Never married36.7% Now married0.0% Separated0.0% Widowed14.0% DivorcedFemales 22.2% Never married26.5% Now married13.3% Separated18.1% Widowed19.8% DivorcedWomen who did not give birth in the past 12 months Now married:
43.2% (84)Unmarried:
56.8% (110)
Marital status - American Indian / Alaska Native population 15 years and over
Males 0.0% Never married100.0% Now married0.0% Separated0.0% Widowed0.0% DivorcedFemales 22.4% Never married46.9% Now married0.0% Separated30.6% Widowed0.0% DivorcedWomen who did not give birth in the past 12 months Now married:
46.3% (29)Unmarried:
53.7% (34)
Marital status - Asian population 15 years and over
Males 30.4% Never married64.1% Now married0.0% Separated0.0% Widowed5.5% DivorcedFemales 36.3% Never married50.2% Now married0.9% Separated2.7% Widowed10.0% DivorcedWomen who did not give birth in the past 12 months Now married:
44.1% (177)Unmarried:
55.9% (225)
Marital status - Other race population 15 years and over
Males 53.1% Never married46.9% Now married0.0% Separated0.0% Widowed0.0% DivorcedFemales 0.0% Never married72.0% Now married0.0% Separated28.0% Widowed0.0% DivorcedWomen who did not give birth in the past 12 months Now married:
100.0% (55)Unmarried:
0.0% (0)
Marital status - Two or more races population 15 years and over
Males 32.3% Never married58.1% Now married0.0% Separated0.0% Widowed9.7% DivorcedFemales 75.6% Never married16.4% Now married2.0% Separated1.6% Widowed4.4% DivorcedWomen who did not give birth in the past 12 months Now married:
7.6% (37)Unmarried:
92.4% (446)
Marital status - White alone, not Hispanic / Latino population 15 years and over
Males 39.4% Never married45.7% Now married0.8% Separated5.8% Widowed8.3% DivorcedFemales 28.2% Never married43.8% Now married1.6% Separated8.4% Widowed18.0% DivorcedWomen who gave birth in the past 12 months Now married:
81.4% (111)Unmarried:
18.6% (25)
Women who did not give birth in the past 12 months Now married:
37.4% (529)Unmarried:
62.6% (887)
Marital status - Hispanic or Latino population 15 years and over
Males 32.1% Never married64.7% Now married0.0% Separated0.0% Widowed3.2% DivorcedFemales 22.9% Never married63.5% Now married0.0% Separated12.5% Widowed1.1% DivorcedWomen who did not give birth in the past 12 months Now married:
59.2% (212)Unmarried:
40.8% (146)
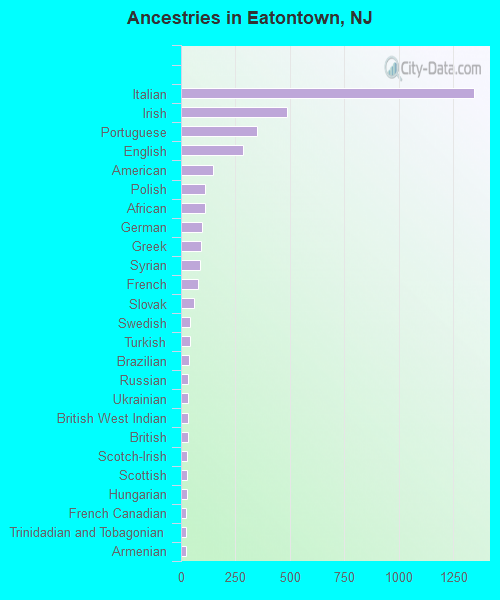
Ancestries in Eatontown
1,347 19.2% Italian487 6.9% Irish351 5.0% Portuguese286 4.1% English145 2.1% American111 1.6% Polish109 1.6% African96 1.4% German94 1.3% Greek87 1.2% Syrian78 1.1% French60 0.9% Slovak42 0.6% Swedish42 0.6% Turkish37 0.5% Brazilian33 0.5% Russian33 0.5% Ukrainian32 0.5% British West Indian31 0.4% British28 0.4% Scotch-Irish27 0.4% Scottish26 0.4% Hungarian23 0.3% French Canadian23 0.3% Trinidadian and Tobagonian22 0.3% Armenian22 0.3% Macedonian19 0.3% Canadian14 0.2% Nigerian12 0.2% Slavic12 0.2% Haitian8 0.1% Scandinavian7 0.10% Eastern European6 0.09% Estonian3 0.04% Jamaican
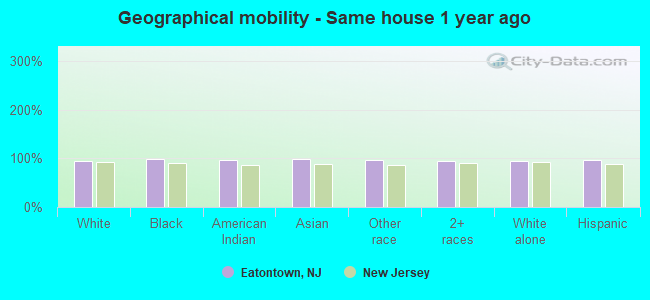
Geographical mobility in Eatontown Same house 1 year ago 8,374 94.2% White (Caucasian)1,041 97.9% Black or African American165 96.6% American Indian / Alaska Native1,407 98.8% Asian596 95.7% Other race1,301 93.7% Two or more races7,971 93.9% White alone, not Hispanic / Latino1,715 96.1% Hispanic or LatinoMoved within same county 322 3.6% White / Caucasian38 3.6% Black or African American329 3.9% White alone, not Hispanic / Latino18 1.0% Hispanic or LatinoMoved within same state 139 1.6% White / Caucasian16 1.5% Black or African American9 1.4% Other race94 6.8% Two or more races142 1.7% White alone, not Hispanic / Latino29 1.6% Hispanic or LatinoMoved from different state 57 0.6% White / Caucasian5 0.3% Two or more races42 0.5% White alone, not Hispanic / Latino16 0.9% Hispanic or LatinoMoved from abroad 10 0.1% White26 1.9% Asian50 8.0% Other race27 0.3% White alone, not Hispanic / Latino45 2.5% Hispanic or Latino
Children Nativity (place of birth) in Eatontown
Children under 6 years - Living with two parents Both parents native 559 100.0% NativeBoth parents foreign-born 52 100.0% NativeOne native, one foreign-born parent 61 100.0% NativeChildren under 6 years - Living with one parent Native parent 71 100.0% NativeForeign-born parent 20 100.0% NativeChildren 6 to 17 years - Living with two parents Both parents native 660 100.0% NativeBoth parents foreign-born 277 88.8% Native35 11.2% Foreign-bornOne native, one foreign-born parent 140 100.0% NativeChildren 6 to 17 years - Living with one parent Native parent 355 100.0% NativeForeign-born parent 137 48.9% Native144 51.1% Foreign-born
Grandparents responsible for own grandchildren in Eatontown
Grandparents (30 to 59 years) White / Caucasian 110 100.0% Responsible for grandchildrenWhite alone, not Hispanic / Latino 35 100.0% Responsible for grandchildrenGrandparents (60 years and over) White / Caucasian 13 46.7% Responsible for grandchildren15 53.3% Not responsible for grandchildrenWhite alone, not Hispanic / Latino 14 47.1% Responsible for grandchildren15 52.9% Not responsible for grandchildren