Races in Edina, Minnesota (MN) Detailed Stats
Data:
Races - White alone (%)
Races - White alone (% change since 2000)
Races - Black alone (%)
Races - Black alone (% change since 2000)
Races - American Indian alone (%)
Races - American Indian alone (% change since 2000)
Races - Asian alone (%)
Races - Asian alone (% change since 2000)
Races - Hispanic (%)
Races - Hispanic (% change since 2000)
Races - Native Hawaiian and Other Pacific Islander alone (%)
Races - Native Hawaiian and Other Pacific Islander alone (% change since 2000)
Races - Two or more races(%)
Races - Two or more races(% change since 2000)
Races - Other race alone (%)
Races - Other race alone (% change since 2000)
Racial diversity
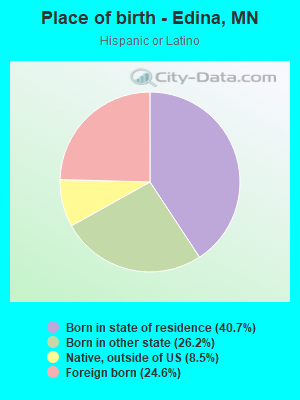
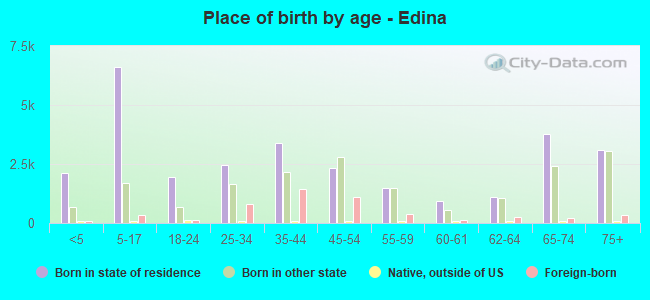
Place of birth - Born in state of residence (%)
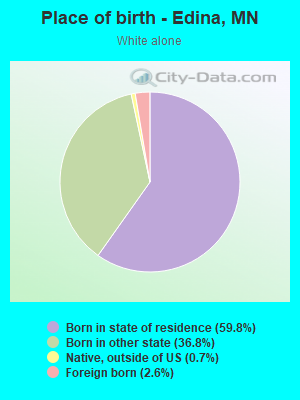
Place of birth - Born in state of residence (%) - White
Place of birth - Born in state of residence (%) - Black or African American
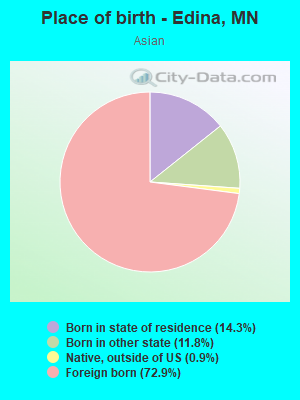
Place of birth - Born in state of residence (%) - Asian
Place of birth - Born in state of residence (%) - Hispanic or Latino
Place of birth - Born in state of residence (%) - American Indian and Alaska Native
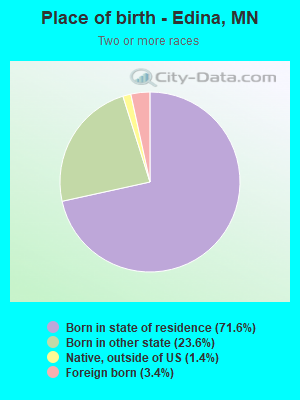
Place of birth - Born in state of residence (%) - Multirace
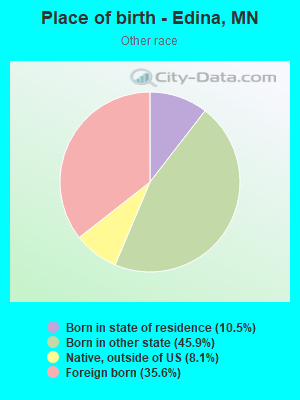
Place of birth - Born in state of residence (%) - Other Race
Place of birth - Born in other state (%)
Place of birth - Born in other state (%) - White
Place of birth - Born in other state (%) - Black or African American
Place of birth - Born in other state (%) - Asian
Place of birth - Born in other state (%) - Hispanic or Latino
Place of birth - Born in other state (%) - American Indian and Alaska Native
Place of birth - Born in other state (%) - Multirace
Place of birth - Born in other state (%) - Other Race
Place of birth - Native, outside of US (%)
Place of birth - Native, outside of US (%) - White
Place of birth - Native, outside of US (%) - Black or African American
Place of birth - Native, outside of US (%) - Asian
Place of birth - Native, outside of US (%) - Hispanic or Latino
Place of birth - Native, outside of US (%) - American Indian and Alaska Native
Place of birth - Native, outside of US (%) - Multirace
Place of birth - Native, outside of US (%) - Other Race
Place of birth - Foreign born (%)
Place of birth - Foreign born (%) - White
Place of birth - Foreign born (%) - Black or African American
Place of birth - Foreign born (%) - Asian
Place of birth - Foreign born (%) - Hispanic or Latino
Place of birth - Foreign born (%) - American Indian and Alaska Native
Place of birth - Foreign born (%) - Multirace
Place of birth - Foreign born (%) - Other Race
Residents speaking English at home (%)
Residents speaking English at home - Born in the United States (%)
Residents speaking English at home - Native, born elsewhere (%)
Residents speaking English at home - Foreign born (%)
Residents speaking Spanish at home (%)
Residents speaking Spanish at home - Born in the United States (%)
Residents speaking Spanish at home - Native, born elsewhere (%)
Residents speaking Spanish at home - Foreign born (%)
Residents speaking other language at home (%)
Residents speaking other language at home - Born in the United States (%)
Residents speaking other language at home - Native, born elsewhere (%)
Residents speaking other language at home - Foreign born (%)
Marital status - Never married (%)
Marital status - Now married (%)
Marital status - Separated (%)
Marital status - Widowed (%)
Marital status - Divorced (%)
Ancestries Reported - Arab (%)
Ancestries Reported - Czech (%)
Ancestries Reported - Danish (%)
Ancestries Reported - Dutch (%)
Ancestries Reported - English (%)
Ancestries Reported - French (%)
Ancestries Reported - French Canadian (%)
Ancestries Reported - German (%)
Ancestries Reported - Greek (%)
Ancestries Reported - Hungarian (%)
Ancestries Reported - Irish (%)
Ancestries Reported - Italian (%)
Ancestries Reported - Lithuanian (%)
Ancestries Reported - Norwegian (%)
Ancestries Reported - Polish (%)
Ancestries Reported - Portuguese (%)
Ancestries Reported - Russian (%)
Ancestries Reported - Scotch-Irish (%)
Ancestries Reported - Scottish (%)
Ancestries Reported - Slovak (%)
Ancestries Reported - Subsaharan African (%)
Ancestries Reported - Swedish (%)
Ancestries Reported - Swiss (%)
Ancestries Reported - Ukrainian (%)
Ancestries Reported - United States (%)
Ancestries Reported - Welsh (%)
Ancestries Reported - West Indian (%)
Ancestries Reported - Other (%)
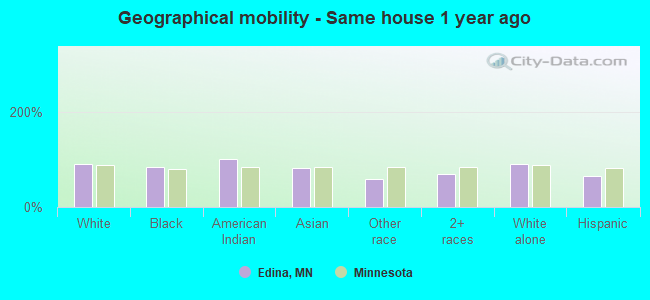
Geographical mobility - Same house 1 year ago (%)
Geographical mobility - Same house 1 year ago (%) - White
Geographical mobility - Same house 1 year ago (%) - Black or African American
Geographical mobility - Same house 1 year ago (%) - Asian
Geographical mobility - Same house 1 year ago (%) - Hispanic or Latino
Geographical mobility - Same house 1 year ago (%) - American Indian and Alaska Native
Geographical mobility - Same house 1 year ago (%) - Multirace
Geographical mobility - Same house 1 year ago (%) - Other Race
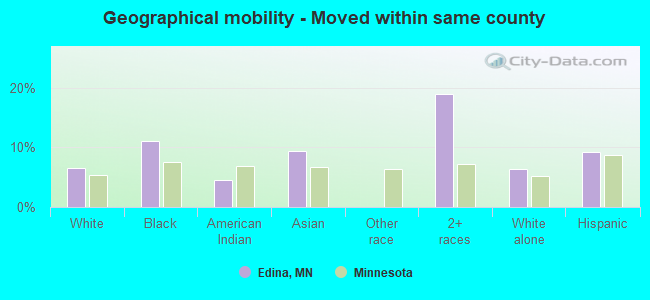
Geographical mobility - Moved within same county (%)
Geographical mobility - Moved within same county (%) - White
Geographical mobility - Moved within same county (%) - Black or African American
Geographical mobility - Moved within same county (%) - Asian
Geographical mobility - Moved within same county (%) - Hispanic or Latino
Geographical mobility - Moved within same county (%) - American Indian and Alaska Native
Geographical mobility - Moved within same county (%) - Multirace
Geographical mobility - Moved within same county (%) - Other Race
Geographical mobility - Moved from different county within same state (%)
Geographical mobility - Moved from different county within same state (%) - White
Geographical mobility - Moved from different county within same state (%) - Black or African American
Geographical mobility - Moved from different county within same state (%) - Asian
Geographical mobility - Moved from different county within same state (%) - Hispanic or Latino
Geographical mobility - Moved from different county within same state (%) - American Indian and Alaska Native
Geographical mobility - Moved from different county within same state (%) - Multirace
Geographical mobility - Moved from different county within same state (%) - Other Race
Geographical mobility - Moved from different state (%)
Geographical mobility - Moved from different state (%) - White
Geographical mobility - Moved from different state (%) - Black or African American
Geographical mobility - Moved from different state (%) - Asian
Geographical mobility - Moved from different state (%) - Hispanic or Latino
Geographical mobility - Moved from different state (%) - American Indian and Alaska Native
Geographical mobility - Moved from different state (%) - Multirace
Geographical mobility - Moved from different state (%) - Other Race
Geographical mobility - Moved from abroad (%)
Geographical mobility - Moved from abroad (%) - White
Geographical mobility - Moved from abroad (%) - Black or African American
Geographical mobility - Moved from abroad (%) - Asian
Geographical mobility - Moved from abroad (%) - Hispanic or Latino
Geographical mobility - Moved from abroad (%) - American Indian and Alaska Native
Geographical mobility - Moved from abroad (%) - Multirace
Geographical mobility - Moved from abroad (%) - Other Race
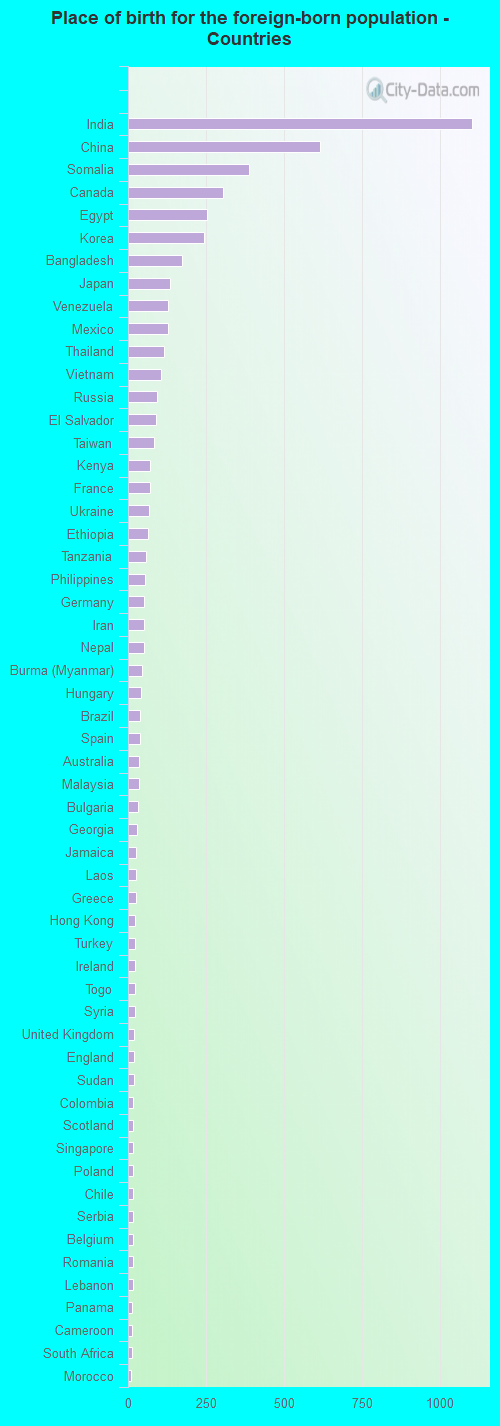
Place of birth for the foreign-born population - Ireland (%)
Place of birth for the foreign-born population - Denmark (%)
Place of birth for the foreign-born population - Norway (%)
Place of birth for the foreign-born population - Sweden (%)
Place of birth for the foreign-born population - United Kingdom (%)
Place of birth for the foreign-born population - England (%)
Place of birth for the foreign-born population - Scotland (%)
Place of birth for the foreign-born population - Other Northern Europe (%)
Place of birth for the foreign-born population - Austria (%)
Place of birth for the foreign-born population - Belgium (%)
Place of birth for the foreign-born population - France (%)
Place of birth for the foreign-born population - Germany (%)
Place of birth for the foreign-born population - Netherlands (%)
Place of birth for the foreign-born population - Switzerland (%)
Place of birth for the foreign-born population - Other Western Europe (%)
Place of birth for the foreign-born population - Greece (%)
Place of birth for the foreign-born population - Italy (%)
Place of birth for the foreign-born population - Portugal (%)
Place of birth for the foreign-born population - Spain (%)
Place of birth for the foreign-born population - Other Southern Europe (%)
Place of birth for the foreign-born population - Albania (%)
Place of birth for the foreign-born population - Belarus (%)
Place of birth for the foreign-born population - Bosnia and Herzegovina (%)
Place of birth for the foreign-born population - Bulgaria (%)
Place of birth for the foreign-born population - Croatia (%)
Place of birth for the foreign-born population - Czechoslovakia (%)
Place of birth for the foreign-born population - Hungary (%)
Place of birth for the foreign-born population - Latvia (%)
Place of birth for the foreign-born population - Lithuania (%)
Place of birth for the foreign-born population - North Macedonia (Macedonia) (%)
Place of birth for the foreign-born population - Moldova (%)
Place of birth for the foreign-born population - Poland (%)
Place of birth for the foreign-born population - Romania (%)
Place of birth for the foreign-born population - Russia (%)
Place of birth for the foreign-born population - Serbia (%)
Place of birth for the foreign-born population - Ukraine (%)
Place of birth for the foreign-born population - Other Eastern Europe (%)
Place of birth for the foreign-born population - China (%)
Place of birth for the foreign-born population - Hong Kong (%)
Place of birth for the foreign-born population - Taiwan (%)
Place of birth for the foreign-born population - Japan (%)
Place of birth for the foreign-born population - Korea (%)
Place of birth for the foreign-born population - Other Eastern Asia (%)
Place of birth for the foreign-born population - Afghanistan (%)
Place of birth for the foreign-born population - Bangladesh (%)
Place of birth for the foreign-born population - India (%)
Place of birth for the foreign-born population - Iran (%)
Place of birth for the foreign-born population - Kazakhstan (%)
Place of birth for the foreign-born population - Nepal (%)
Place of birth for the foreign-born population - Pakistan (%)
Place of birth for the foreign-born population - Sri Lanka (%)
Place of birth for the foreign-born population - Uzbekistan (%)
Place of birth for the foreign-born population - Other South Central Asia (%)
Place of birth for the foreign-born population - Burma (%)
Place of birth for the foreign-born population - Cambodia (%)
Place of birth for the foreign-born population - Indonesia (%)
Place of birth for the foreign-born population - Laos (%)
Place of birth for the foreign-born population - Malaysia (%)
Place of birth for the foreign-born population - Philippines (%)
Place of birth for the foreign-born population - Singapore (%)
Place of birth for the foreign-born population - Thailand (%)
Place of birth for the foreign-born population - Vietnam (%)
Place of birth for the foreign-born population - Other South Eastern Asia (%)
Place of birth for the foreign-born population - Armenia (%)
Place of birth for the foreign-born population - Iraq (%)
Place of birth for the foreign-born population - Israel (%)
Place of birth for the foreign-born population - Jordan (%)
Place of birth for the foreign-born population - Kuwait (%)
Place of birth for the foreign-born population - Lebanon (%)
Place of birth for the foreign-born population - Saudi Arabia (%)
Place of birth for the foreign-born population - Syria (%)
Place of birth for the foreign-born population - Turkey (%)
Place of birth for the foreign-born population - Yemen (%)
Place of birth for the foreign-born population - Other Western Asia (%)
Place of birth for the foreign-born population - Eritrea (%)
Place of birth for the foreign-born population - Ethiopia (%)
Place of birth for the foreign-born population - Kenya (%)
Place of birth for the foreign-born population - Somalia (%)
Place of birth for the foreign-born population - Uganda (%)
Place of birth for the foreign-born population - Zimbabwe (%)
Place of birth for the foreign-born population - Other Eastern Africa (%)
Place of birth for the foreign-born population - Cameroon (%)
Place of birth for the foreign-born population - Congo (%)
Place of birth for the foreign-born population - Democratic Republic of Congo (Zaire) (%)
Place of birth for the foreign-born population - Other Middle Africa (%)
Place of birth for the foreign-born population - Egypt (%)
Place of birth for the foreign-born population - Morocco (%)
Place of birth for the foreign-born population - Sudan (%)
Place of birth for the foreign-born population - Other Northern Africa (%)
Place of birth for the foreign-born population - South Africa (%)
Place of birth for the foreign-born population - Other Southern Africa (%)
Place of birth for the foreign-born population - Cabo Verde (%)
Place of birth for the foreign-born population - Ghana (%)
Place of birth for the foreign-born population - Liberia (%)
Place of birth for the foreign-born population - Nigeria (%)
Place of birth for the foreign-born population - Senegal (%)
Place of birth for the foreign-born population - Sierra Leone (%)
Place of birth for the foreign-born population - Other Western Africa (%)
Place of birth for the foreign-born population - Australia (%)
Place of birth for the foreign-born population - New Zealand (%)
Place of birth for the foreign-born population - Fiji (%)
Place of birth for the foreign-born population - Micronesia (%)
Place of birth for the foreign-born population - Bahamas (%)
Place of birth for the foreign-born population - Barbados (%)
Place of birth for the foreign-born population - Cuba (%)
Place of birth for the foreign-born population - Dominica (%)
Place of birth for the foreign-born population - Dominican Republic (%)
Place of birth for the foreign-born population - Grenada (%)
Place of birth for the foreign-born population - Haiti (%)
Place of birth for the foreign-born population - Jamaica (%)
Place of birth for the foreign-born population - St. Vincent and the Grenadines (%)
Place of birth for the foreign-born population - Trinidad and Tobago (%)
Place of birth for the foreign-born population - West Indies (%)
Place of birth for the foreign-born population - Other Caribbean (%)
Place of birth for the foreign-born population - Belize (%)
Place of birth for the foreign-born population - Costa Rica (%)
Place of birth for the foreign-born population - El Salvador (%)
Place of birth for the foreign-born population - Guatemala (%)
Place of birth for the foreign-born population - Honduras (%)
Place of birth for the foreign-born population - Mexico (%)
Place of birth for the foreign-born population - Nicaragua (%)
Place of birth for the foreign-born population - Panama (%)
Place of birth for the foreign-born population - Other Central America (%)
Place of birth for the foreign-born population - Argentina (%)
Place of birth for the foreign-born population - Bolivia (%)
Place of birth for the foreign-born population - Brazil (%)
Place of birth for the foreign-born population - Chile (%)
Place of birth for the foreign-born population - Colombia (%)
Place of birth for the foreign-born population - Ecuador (%)
Place of birth for the foreign-born population - Guyana (%)
Place of birth for the foreign-born population - Peru (%)
Place of birth for the foreign-born population - Uruguay (%)
Place of birth for the foreign-born population - Venezuela (%)
Place of birth for the foreign-born population - Other South America (%)
Place of birth for the foreign-born population - Canada (%)
Place of birth for the foreign-born population - Other Northern America (%)
Place of birth for the foreign-born population - Other (%)
Latest news about races in Edina, MN collected exclusively by city-data.com from local newspapers, TV, and radio stations
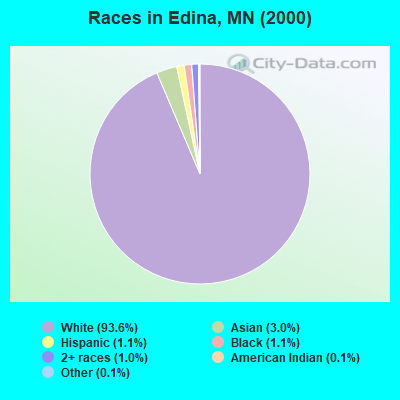
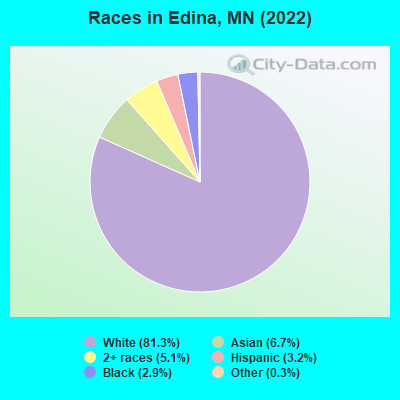
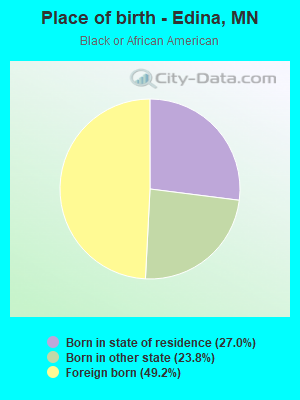
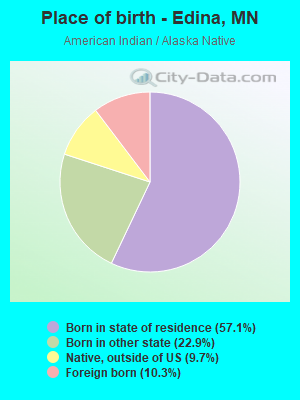
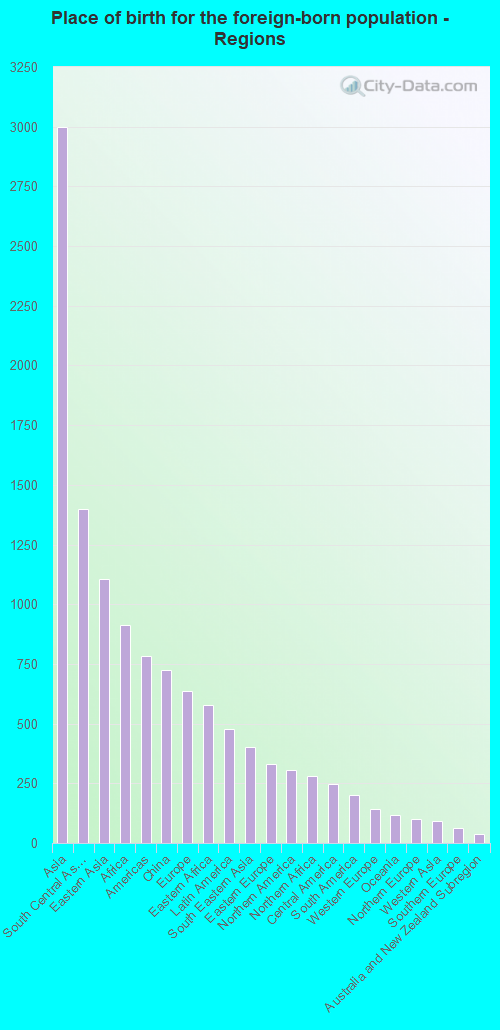
According to 2022 data, the most numerous races in Edina, MN are White alone (42,742 residents), Black alone (1,501 residents), and Hispanic (1,682 residents). 87.6% of Edina residents speak English at home. 10.4% of Edina, MN residents are foreign-born (5.5% born in Asia, 1.7% born in Africa, 1.2% born in Europe), which is 22.9% greater than the foreign-born rate of 8.0% across the entire state of Minnesota.
Race distribution in Edina
2000 2022
4,337,143 88.2% White alone 168,813 3.4% Black alone 143,382 2.9% Hispanic 141,083 2.9% Asian alone 70,304 1.4% Two or more races 52,009 1.1% American Indian alone 5,031 0.1% Other race alone 1,714 0.03% Native Hawaiian and Other
4,356,347 76.2% White alone 395,179 6.9% Black alone 333,830 5.8% Hispanic 294,800 5.2% Asian alone 259,649 4.5% Two or more races 42,125 0.7% American Indian alone 32,976 0.6% Other race alone 2,278 0.04% Native Hawaiian and Other
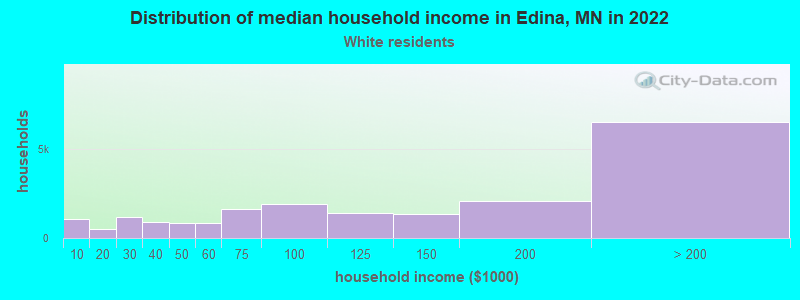
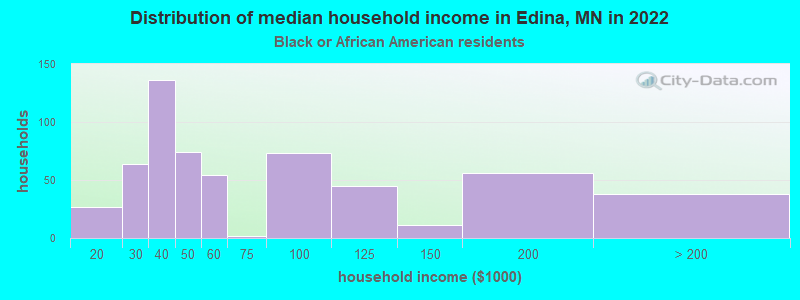
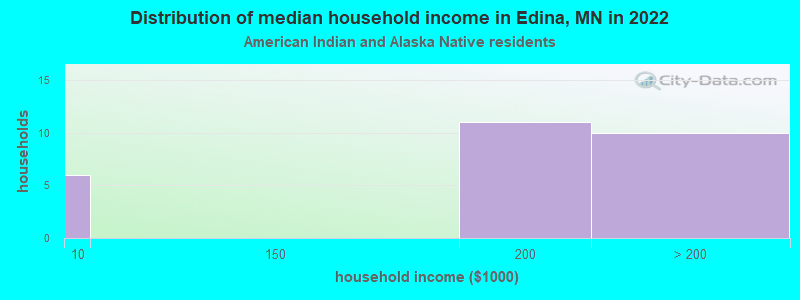
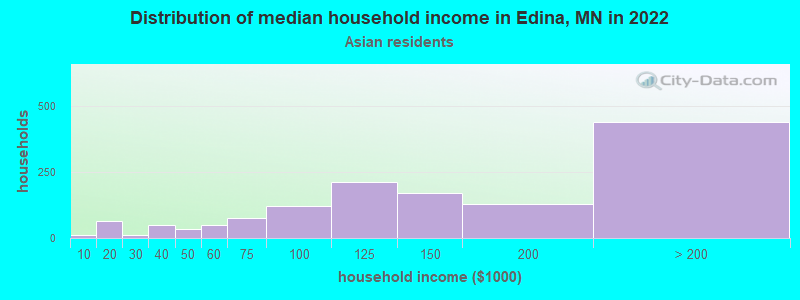
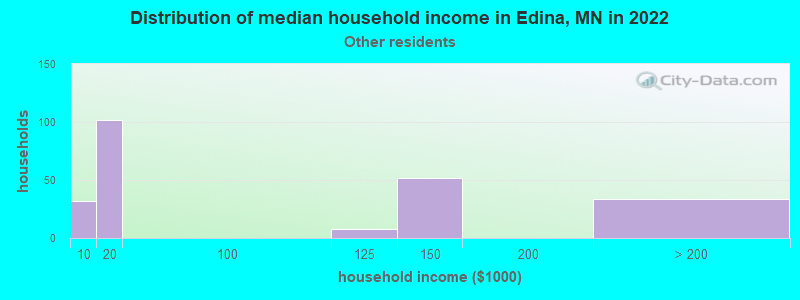
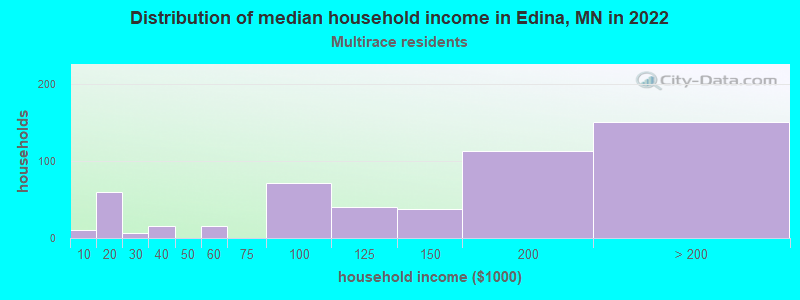
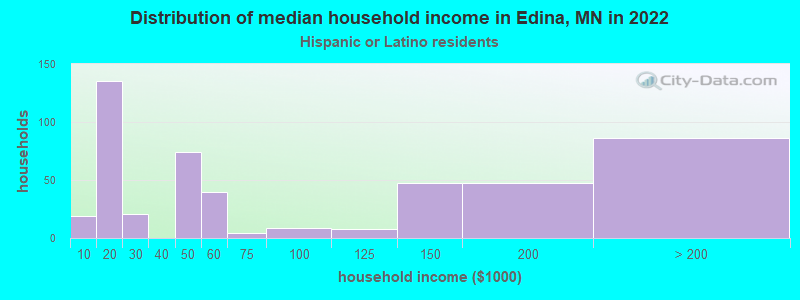
Income and house value in Edina Median household income in 2022 $122,290 White non-Hispanic householders$48,187 Black householdersover $200,000 American Indian and Alaska Native householders$129,016 Asian householders$148,552 Two or more races householdersMedian 2022 house value $710,678 White Non-Hispanic householders$635,225 Black or African American householders$509,091 American Indian or Alaska Native householders $657,718 Asian householders$726,053 Some other race householders$450,722 Two or more races householders$839,944 Hispanic or Latino householders
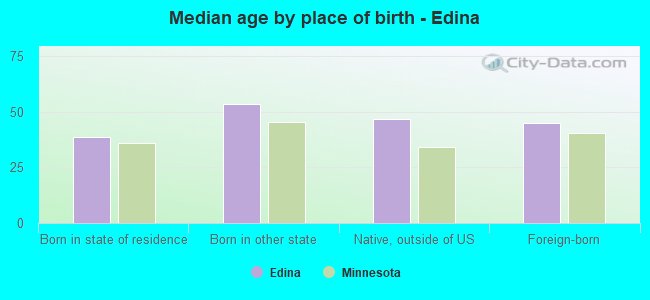
Median age by race in Edina
49.7 Median age for White residents47.0 52.8 31.5 Median age for Black or African American residents35.4 29.9 56.3 Median age for American Indian / Alaska Native residents56.0 54.0 39.2 Median age for Asian residents37.9 40.8 -790,303,029.5 Median age for Native Hawaiian / Pacific Islander residents-856,799,036.4 -365,948,037.2 41.4 Median age for Other race residents33.8 40.7 14.2 Median age for Two or more races residents10.6 20.0 49.8 Median age for White alone residents47.3 52.5 21.0 Median age for Hispanic or Latino residents21.0 23.0
Owner/renter occupied households by race in Edina
House owners and renters - White residents 14,780 73.7% Owner occupied5,287 26.3% Renter occupiedHouse owners and renters - Black or African American residents 96 16.1% Owner occupied500 83.9% Renter occupiedHouse owners and renters - American Indian / Alaska Native residents 27 76.6% Owner occupied8 23.4% Renter occupiedHouse owners and renters - Asian residents 755 54.7% Owner occupied626 45.3% Renter occupiedHouse owners and renters - Other race residents 86 40.5% Owner occupied126 59.5% Renter occupiedHouse owners and renters - Two or more races residents 374 74.1% Owner occupied131 25.9% Renter occupiedHouse owners and renters - White alone residents 14,796 74.0% Owner occupied5,195 26.0% Renter occupiedHouse owners and renters - Hispanic or Latino residents 162 35.5% Owner occupied294 64.5% Renter occupied
Language usage in Edina
English speakers - Total 87.6% of residents of Edina speak English at home.
1.9% of residents speak Spanish at home 567 61.0% Speak English very well362 39.0% Speak English less than very well10.6% of residents speak other language at home 3,983 75.3% Speak English very well1,307 24.7% Speak English less than very well
English speakers - Born in the United States 95.7% of residents of Edina speak English at home.
1.4% of residents speak Spanish at home 162 68.9% Speak English very well73 31.1% Speak English less than very well2.7% of residents speak other language at home 303 65.3% Speak English very well161 34.7% Speak English less than very well
English speakers - Native, born elsewhere 62.9% of residents of Edina speak English at home.
27.5% of residents speak Spanish at home 70 54.7% Speak English very well58 45.3% Speak English less than very well11.8% of residents speak other language at home 51 92.7% Speak English very well4 7.3% Speak English less than very well
English speakers - Foreign-born 19.9% of residents of Edina speak English at home.
6.5% of residents speak Spanish at home 125 37.9% Speak English very well205 62.1% Speak English less than very well74.4% of residents speak other language at home 2,777 73.6% Speak English very well996 26.4% Speak English less than very well
White (Caucasian) - Speak only English Native:
97.5% (39,119)Foreign-born:
47.7% (507)
White (Caucasian) - Speak another language Native:
2.6% (1,047)Foreign-born:
53.9% (573)
Black or African American - Speak only English Native:
87.7% (476)Foreign-born:
5.0% (38)
Black or African American - Speak another language Native:
9.7% (53)Foreign-born:
100.0% (756)
American Indian / Alaska Native - Speak another language Native:
54.5% (35)Foreign-born:
76.9% (6)
Asian - Speak only English Native:
56.3% (428)Foreign-born:
17.8% (448)
Asian - Speak another language Native:
46.0% (349)Foreign-born:
82.1% (2,060)
Other race - Speak only English Native:
56.1% (173)Foreign-born:
6.8% (19)
Other race - Speak another language Native:
45.1% (139)Foreign-born:
93.5% (258)
Two or more races - Speak only English Native:
88.5% (2,382)Foreign-born:
60.0% (69)
Two or more races - Speak another language Native:
11.6% (312)Foreign-born:
44.5% (51)
White alone - Speak only English Native:
97.7% (39,042)Foreign-born:
44.2% (497)
White alone - Speak another language Native:
2.3% (931)Foreign-born:
55.2% (621)
Hispanic or Latino - Speak only English Native:
59.3% (622)Foreign-born:
21.3% (89)
Hispanic or Latino - Speak another language Native:
41.5% (435)Foreign-born:
81.0% (338)
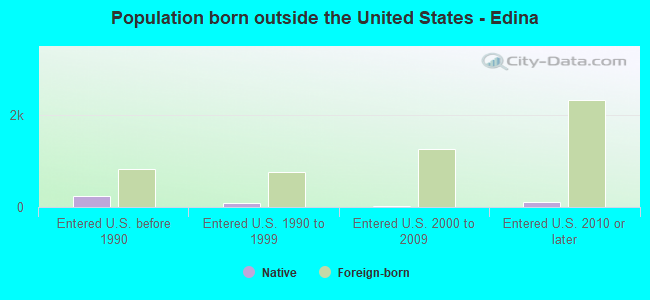
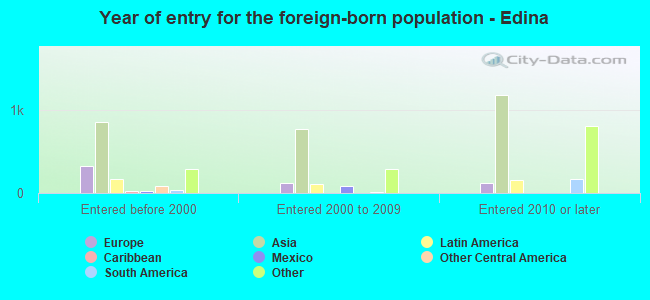
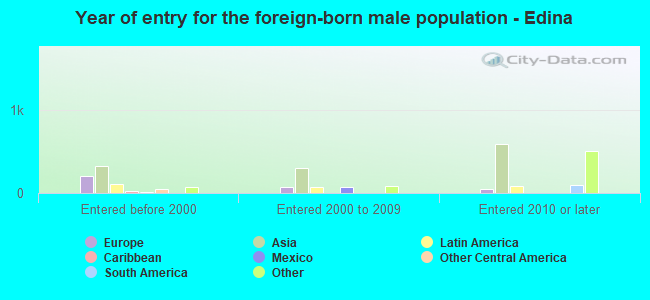
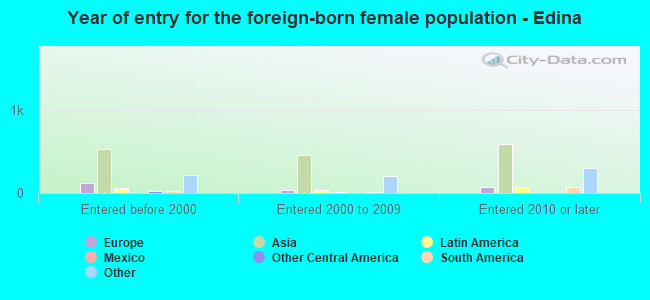
Foreign-born residents in Edina 5,455 residents are foreign born (5.5% Asia , 1.7% Africa , 1.2% Europe ).
This city:
10.4%Minnesota:
8.5%
Marital status for residents in Edina Marital status - White (Caucasian) population 15 years and over
Males 24.5% Never married66.7% Now married0.5% Separated2.2% Widowed6.2% DivorcedFemales 20.4% Never married54.9% Now married1.0% Separated11.5% Widowed12.2% DivorcedWomen who gave birth in the past 12 months Now married:
100.0% (224)Unmarried:
0.0% (0)
Women who did not give birth in the past 12 months Now married:
53.7% (4,031)Unmarried:
46.3% (3,471)
Marital status - Black or African American population 15 years and over
Males 45.7% Never married49.8% Now married0.2% Separated0.0% Widowed4.3% DivorcedFemales 48.1% Never married41.3% Now married0.0% Separated0.0% Widowed10.6% DivorcedWomen who gave birth in the past 12 months Now married:
40.9% (64)Unmarried:
59.1% (92)
Women who did not give birth in the past 12 months Now married:
53.1% (149)Unmarried:
46.9% (131)
Marital status - American Indian / Alaska Native population 15 years and over
Males 17.4% Never married82.6% Now married0.0% Separated0.0% Widowed0.0% DivorcedFemales 2.1% Never married97.9% Now married0.0% Separated0.0% Widowed0.0% DivorcedWomen who did not give birth in the past 12 months Now married:
0.0% (0)Unmarried:
100.0% (1)
Marital status - Asian population 15 years and over
Males 18.4% Never married78.0% Now married0.0% Separated3.6% Widowed0.0% DivorcedFemales 18.6% Never married70.9% Now married0.8% Separated2.8% Widowed6.9% DivorcedWomen who gave birth in the past 12 months Now married:
78.1% (50)Unmarried:
21.9% (14)
Women who did not give birth in the past 12 months Now married:
75.9% (856)Unmarried:
24.1% (272)
Marital status - Other race population 15 years and over
Males 18.8% Never married64.0% Now married0.0% Separated0.0% Widowed17.2% DivorcedFemales 45.7% Never married50.0% Now married0.0% Separated0.0% Widowed4.3% DivorcedWomen who did not give birth in the past 12 months Now married:
41.6% (38)Unmarried:
58.4% (53)
Marital status - Two or more races population 15 years and over
Males 55.9% Never married37.7% Now married0.0% Separated0.0% Widowed6.3% DivorcedFemales 52.8% Never married38.7% Now married0.0% Separated0.5% Widowed7.9% DivorcedWomen who gave birth in the past 12 months Now married:
100.0% (46)Unmarried:
0.0% (0)
Women who did not give birth in the past 12 months Now married:
32.8% (273)Unmarried:
67.2% (558)
Marital status - White alone, not Hispanic / Latino population 15 years and over
Males 23.6% Never married67.5% Now married0.5% Separated2.2% Widowed6.2% DivorcedFemales 20.1% Never married54.8% Now married1.0% Separated11.6% Widowed12.4% DivorcedWomen who gave birth in the past 12 months Now married:
100.0% (228)Unmarried:
0.0% (0)
Women who did not give birth in the past 12 months Now married:
53.8% (4,021)Unmarried:
46.2% (3,458)
Marital status - Hispanic or Latino population 15 years and over
Males 51.9% Never married36.9% Now married0.0% Separated0.0% Widowed11.3% DivorcedFemales 40.6% Never married55.0% Now married0.0% Separated0.7% Widowed3.7% DivorcedWomen who did not give birth in the past 12 months Now married:
52.4% (182)Unmarried:
47.6% (165)
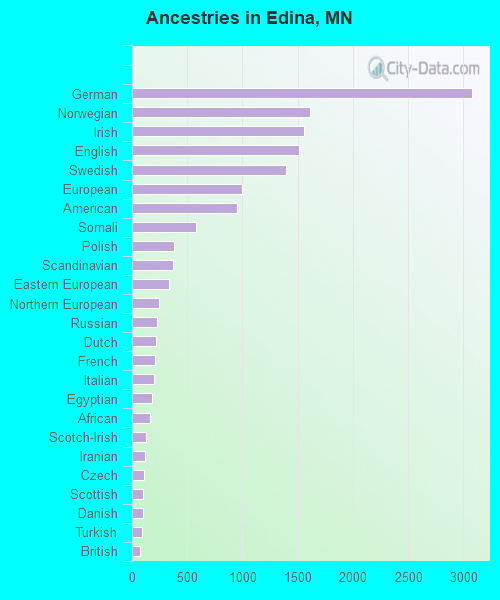
Ancestries in Edina
3,077 14.9% German1,610 7.8% Norwegian1,560 7.6% Irish1,507 7.3% English1,395 6.8% Swedish993 4.8% European950 4.6% American583 2.8% Somali382 1.9% Polish369 1.8% Scandinavian336 1.6% Eastern European247 1.2% Northern European225 1.1% Russian221 1.1% Dutch212 1.0% French201 1.0% Italian185 0.9% Egyptian166 0.8% African129 0.6% Scotch-Irish116 0.6% Iranian112 0.5% Czech98 0.5% Scottish96 0.5% Danish95 0.5% Turkish76 0.4% British76 0.4% Canadian73 0.4% Greek64 0.3% Slovak48 0.2% Finnish47 0.2% Jamaican44 0.2% Ukrainian43 0.2% Hungarian42 0.2% Kenyan41 0.2% Liberian40 0.2% Belgian40 0.2% Swiss38 0.2% Lebanese38 0.2% Brazilian37 0.2% Australian37 0.2% Nigerian36 0.2% Croatian29 0.1% Yugoslavian29 0.1% Bulgarian24 0.1% Latvian24 0.1% French Canadian24 0.1% Welsh23 0.1% West Indian20 0.10% Romanian19 0.09% Ethiopian18 0.09% Austrian15 0.07% Syrian14 0.07% Portuguese9 0.04% Slovene9 0.04% Serbian7 0.03% Estonian5 0.02% Czechoslovakian4 0.02% Ghanaian3 0.01% Lithuanian3 0.01% Slavic
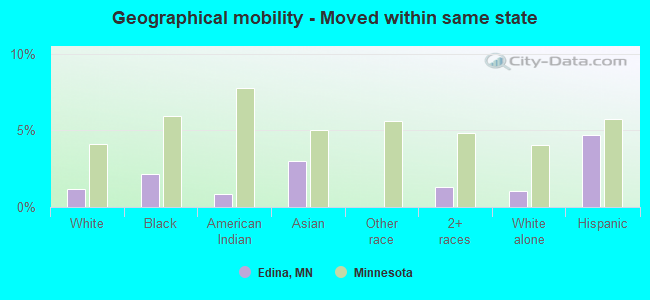
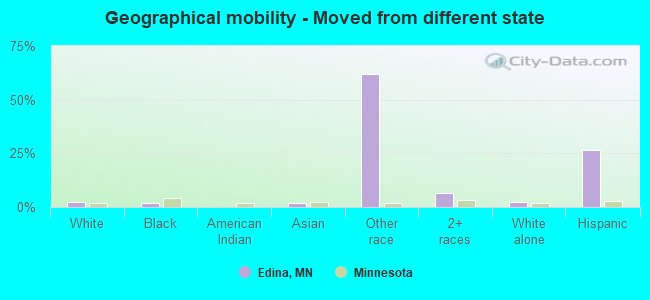
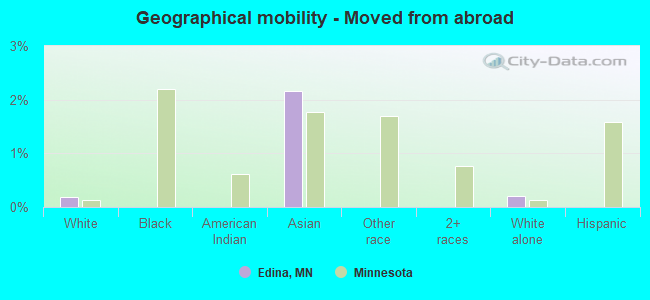
Geographical mobility in Edina Same house 1 year ago 38,240 89.9% White (Caucasian)1,142 82.9% Black or African American73 100.0% American Indian / Alaska Native2,888 82.5% Asian426 59.2% Other race2,324 68.8% Two or more races38,331 90.2% White alone, not Hispanic / Latino1,115 66.5% Hispanic or LatinoMoved within same county 2,786 6.5% White / Caucasian152 11.0% Black or African American3 4.6% American Indian / Alaska Native329 9.4% Asian640 18.9% Two or more races2,726 6.4% White alone, not Hispanic / Latino154 9.2% Hispanic or LatinoMoved within same state 512 1.2% White / Caucasian30 2.1% Black or African American1 0.8% American Indian / Alaska Native104 3.0% Asian45 1.3% Two or more races450 1.1% White alone, not Hispanic / Latino78 4.7% Hispanic or LatinoMoved from different state 1,063 2.5% White / Caucasian23 1.6% Black or African American64 1.8% Asian448 62.2% Other race214 6.3% Two or more races1,030 2.4% White alone, not Hispanic / Latino443 26.4% Hispanic or LatinoMoved from abroad 82 0.2% White76 2.2% Asian88 0.2% White alone, not Hispanic / Latino
Children Nativity (place of birth) in Edina
Children under 6 years - Living with two parents Both parents native 2,202 100.0% NativeBoth parents foreign-born 641 90.0% Native72 10.0% Foreign-bornOne native, one foreign-born parent 253 100.0% NativeChildren under 6 years - Living with one parent Native parent 229 100.0% NativeForeign-born parent 39 100.0% NativeChildren 6 to 17 years - Living with two parents Both parents native 5,767 99.2% Native46 0.8% Foreign-bornBoth parents foreign-born 776 80.5% Native188 19.5% Foreign-bornOne native, one foreign-born parent 540 100.0% NativeChildren 6 to 17 years - Living with one parent Native parent 799 98.6% Native12 1.4% Foreign-bornForeign-born parent 54 60.6% Native35 39.4% Foreign-born
Grandparents responsible for own grandchildren in Edina
Grandparents (30 to 59 years) Asian 17 100.0% Not responsible for grandchildren
Grandparents (60 years and over) Asian 24 100.0% Not responsible for grandchildren